Guidance on the valuation
of supported housing
Supplement to ‘Rent influencing regime:
implementing the rent restructuring framework’
23
4
CONTENTS
1 Introduction 1
2 Existing Use Valuations 2
3 Depreciated replacement costs (DRC) 3
4 Example valuation calculations 6
Tables
1 Local authorities within each TCI area
(based on TCI circular of 1998/99) 9
2 Formula for converting sq m into hectares 12
3 Valuation Office residential land values
SUPPLEMENT TO ‘RENT INFLUENCING REGIME: IMPLEMENTING THE RENT RESTRUCTURING FRAMEWORK’
APPENDIX I:
GUIDANCE ON THE VALUATION OF SUPPORTED HOUSING
1 INTRODUCTION
1.1
This guidance explains the approach that housing associations (HAs)
should adopt to the valuation of supported housing for rent
restructuring purposes. This guidance is not intended to provide advice
on valuations for accounting purposes. The term supported housing
covers all schemes that may attract Supporting People grant.
1.2
The key principles underpinning rent restructuring for supported
housing are the same as those for general needs housing. Rents are
expected to reflect the size, condition and location of the
accommodation. Properties have to be valued for these purposes
using a common valuation base ( January 1999) and a comparable
method.
1.3
There are two approaches that can be used by HAs to the valuation of
supported housing. Existing Use Valuation (EUV), which assumes
vacant possession, is the preferred method of valuation and, where
possible, HAs should obtain EUVs for supported housing. Where it is
not appropriate to value properties on this basis, HAs can use a
Depreciated Replacement Cost (DRC) method of valuation. This
guidance broadly explains how HAs can use both the EUV and DRC
methods to value their supported housing stock and examples are
shown in section 4 of this Appendix.
1.4
The main principles underpinning the valuation methods for supported
housing are as follows. The methods should:
•
reflect the same principles as those for general needs housing
•
be simple to operate
•
take account of the full costs of replacement.
1
APPENDIX I: JANUAR
2 EXISTING USE VALUATIONS
2.1
EUVs should be applied to ordinary supported housing units that are
similar to general needs housing, for instance self-contained housing
and small shared units. The concept of EUV is based on assuming
vacant possession and continued residential use.
2.2
A useful source of information about stock valuation is
A New Financial
Framework for Local Authority Housing — Guidance on Stock Valuation
published by DTLR in May 2000. Appendix F to this guide sets out the
definition by the Royal Institution of Chartered Surveyors of the
concept of Existing Use Value. In particular the concept assumes that
the property remains in its current use, which in this instance is housing
and is not converted into, for example, retail or office accommodation.
2.3
Supported housing schemes can be included within HAs’ existing
valuation methods for general needs housing, where the stock is similar.
Such approaches may involve valuing a representative sample of housing
stock, or HAs jointly forming a ‘valuation club’ where valuations are
shared. Where a supported housing scheme is isolated from other types
of properties then an individual valuation may be required. The EUV
methodology should reflect the cost of specialist adaptations.
2.4
It is anticipated that the EUV method of valuation should be
appropriate for a substantial proportion of supported housing, as there
is sufficient evidence of various types of residential property to enable a
robust valuation to be prepared for rent restructuring purposes. HAs
should, where possible, use EUVs. HAs may choose to use external
valuers or appropriately qualified in-house staff to carry out EUVs.
3 DEPRECIATED REPLACEMENT COSTS (DRC)
3.1
The DTLR has recognised that in some cases valuations on an EUV
basis will not take account of the particular qualities and characteristics
of supported housing. Where the Board of an HA decides that this is
the case, with the benefit of professional advice where appropriate, the
HA may value properties on a DRC basis.
3.2
The DRC method of valuation broadly corresponds to the cost of
replacing the building, taking account of the fact that generally it would
not be brand new. This approach should only be applied for the
purposes of rent restructuring.
3.3
The approach set out in this guidance involves the calculation of a DRC
valuation based on the replacement of an existing property with a
modern alternative. This replacement cost will need to be depreciated
where the condition of the existing property does not meet modern
standards. The value of the land will then need to be added to this
calculation.
3.4
The methodology set out below explains how HAs with specialist
properties can calculate a DRC. HAs may pursue this approach without
having to engage professional valuers, in which case they should ensure
that a competent person is responsible for applying the methodology.
Build cost per square metre (sq m)
3.5
To calculate the DRC of an existing property it will be necessary for the
HA to first calculate the cost of its replacement with a modern
alternative. The methodology involves using a standard per sq m rate
for the build cost of a modern alternative. The January 1999 rates for
each TCI area are shown below, details of the local authorities that fall
within each TCI area are shown in Table 1.
TCI area A B C D E Build cost per sq m 871 799 761 737 707
The sq m build rates shown above include on-costs and take account of
the additional costs associated with building supported housing.
3.6
HAs will need to calculate the gross external area of the existing
property using guidance provided in the Royal Institution of Chartered
Surveyor’s Code of Measuring Practice, Fifth Edition (available from
RICS priced £20 for members and £25 for non members telephone 020
7222 7000). If the gross external area is difficult to measure, then HAs
could derive this calculation from the gross internal area, taking into
account the thickness of the external walls and the space occupied by
partitions.
3APPENDIX I: JANUAR
The calculation will involve multiplying the build rate by the gross sq m
to arrive at a replacement cost for a modern alternative.
Specialist adaptations
3.7
Supported housing can include the provision of specialist adaptations
for people with a physical disability. A distinction needs to be made
between property related adaptations and personal equipment for an
individual (eg hoists etc).
3.8
The build cost calculation for replacing an existing scheme with a
modern alternative includes the costs of complying with building
regulation requirements for wheelchair accessibility. There are, however,
other property related adaptations that may need to be taken into
account in assessing replacement costs, for instance the provision of
specialist equipment.
3.9
Two key multipliers have been identified that can enhance the basic
build cost to take account of those adaptations that are not reflected
within the sq m calculation. These multipliers are as follows:
Wheelchair (specialist fixed equipment eg showers/kitchen units) 1.12 Serviced by new lifts 1.12
Condition of the property
3.10
To ensure that the DRC valuation reflects the condition of the property,
it will be necessary for the replacement cost to be depreciated.
3.11
Where the property has been regularly maintained and upgraded, and
complies with modern design and construction standards, the
replacement cost should not be depreciated. Where the property does
not meet modern standards a notional abatement factor of 0.90 should
be applied to depreciate the replacement costs in any of the following
circumstances:
•
no central heating
•
the kitchen/s has not been refurbished within the previous 10 years
•
the bathroom/s has not been refurbished within the previous 15
years.
Standardised land value calculation
3.12
There are two approaches that HAs can adopt to calculating the land
value for rent restructuring purposes. These approaches are explained
below.
3.13
HAs can use professional valuers (internal or external) to provide advice
on the valuation of a site (at the January 1999 price base). This approach
provides a tailored method for calculating the value of the land
component.
3.14
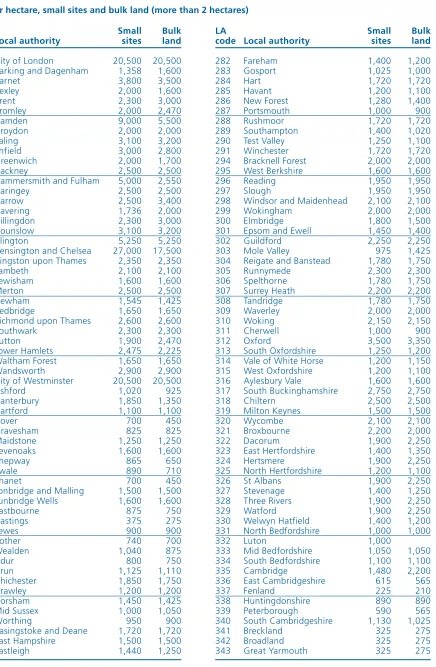
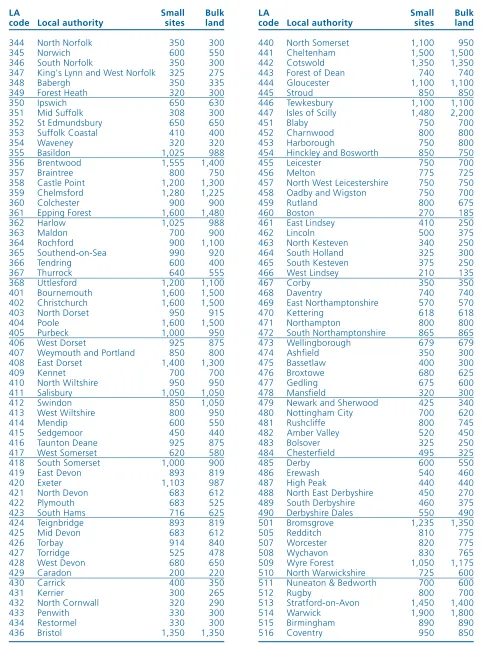
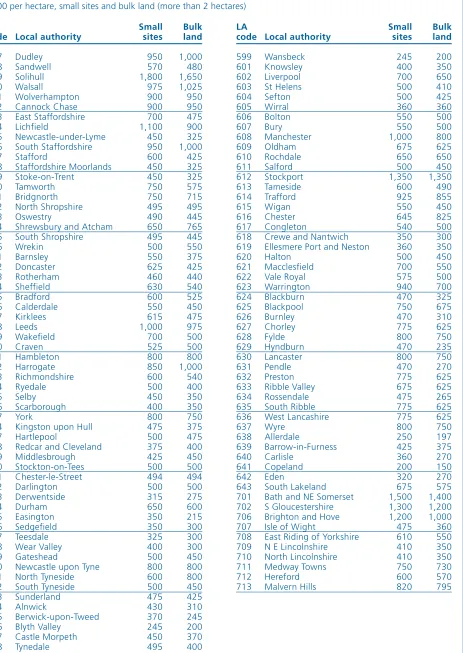
Alternatively HAs can use land values prepared by the Valuation Office
in Spring 1999. If these land values are used, it is not necessary to rebase
the valuation to January 1999. This approach would involve HAs
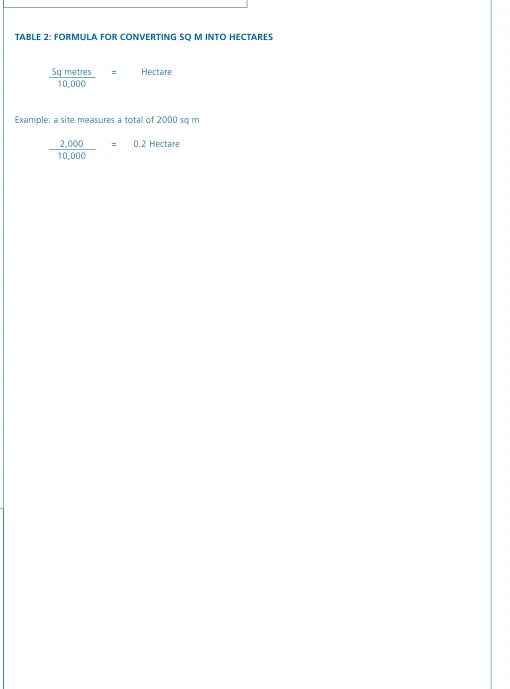
calculating the size of the site in hectares (see formula in Table 2 to
translate sq m into hectares). HAs could make use of ordnance survey
maps to facilitate this calculation. The value of the land would be
derived by multiplying the land value prepared by the Valuation Office
by the actual size of the site.
3.15
The land values prepared by the Valuation Office are based on each local
authority area, assuming a representative location with planning
permission available for residential development, services are to the
edge of the site and the site is ripe for development. The Spring 1999
values for each local authority area are given in Table 3 showing the
value of small sites as well as those in excess of two hectares. As the
valuation figures provide a broad indication of land value over each
local authority area, they may not reflect the specific value of the HA’s
site. Where an HA considers this to be the case, it may wish to use a
professional valuer.
5
APPENDIX I: JANUAR
4 EXAMPLE VALUATION CALCULATIONS
4.1 Example 1
A scheme for people with AIDS/HIV provides 8 self contained units in a
block of flats in the Midlands. This scheme has been funded through the
supported housing funding framework and incorporates a number of
specialist adaptations to enable tenants to remain in their homes, should
their physical condition deteriorate.
This scheme is very similar to other self contained units that have been
recently valued on a sample basis using EUV. The valuer agrees a slight
enhancement to the EUV of each unit, to reflect the costs of adapting
them to enable people with fluctuating health care needs to live
independently.
4.2 Example 2
A women’s refuge for 8 women was built in 1902 and was converted
into a refuge in 1985. Although the scheme has been well maintained,
the services and facilities have not been upgraded since it was
refurbished. The gross area of the scheme is 200 sq m. The scheme is
located in TCI area A
Sq m replacement build costs (TCI area A) £871 sq m (a) Gross area of scheme 200 sq m (b) Estimated replacement costs £174,200 (a) x (b) Multipliers None
Condition factor 0.90 Estimated replacement cost (depreciated) £156,780
Land valuation (per hectare Lambeth, 1999) £2,100,000 (d) Site size 0.075 hectare (e) Land value £157,500 (d) x (e) Total valuation £314,280
Valuation per unit £39,285
4.3 Example 3
A specialist scheme for 12 people with learning disabilities was
originally built in 1895 and came into management in 1995. The scheme
has been built to wheelchair standards and has a lift. The scheme has
been well maintained. The gross area of the scheme is 420 sq m. The
scheme is located in TCI area D.
Sq m replacement build costs
(TCI area D) (incl. wheelchair accessibility) £737 sq m (a) Gross area of scheme 420 sq m (b) Estimated replacement costs £309,540 (a) x (b) Multipliers
Wheelchair equipment 1.12 (c) Lift 1.12 (d) Gross multiplier 1.25 (c) x (d) Estimated replacement costs £386,925
Condition factor None Estimated replacement cost (depreciated) £386,925
Land valuation (per hectare for Exeter, 1999) £1,103,000 (e) Site size 0.2 hectare (f) Land value £220,600 (e) x (f) Total valuation £607,525
Valuation per unit £50,627
7
APPENDIX I: JANUAR
4.4 Example 4
A scheme for 6 single homeless people in TCI area E was developed as a
new build scheme in 1980. Substantial major repairs works were
undertaken to the property in 1999 with the installation of a new hot
water and heating system, the upgrading of the kitchen and bathrooms
and the installation of a new electrical system. The repairs have also
involved catch up internal and external cyclical works
Sq m replacement build costs
(incl wheelchair accessibility) £707 sq m (a) Gross area of scheme 150 sq m (b) Estimated replacement costs £ 106,050 (a) x (b) Multipliers None
Condition factor None Estimated replacement cost (depreciated) £106,050
Land valuation £450,000 (d) (per hectare for Stoke-on-Trent, 1999)
Site size 0.12 hectare (e) Land value £54,000 (d) x (e) Total valuation £160,050
Valuation per unit £26,675
4.5
You can download a spreadsheet from the National Housing
Federation’s website (www.housing.org.uk) which automatically
calculates the DRC if you insert the location and dimensions of the
building and land.
9
APPENDIX I: JANUAR
[image:11.595.56.271.154.795.2]Y 2002
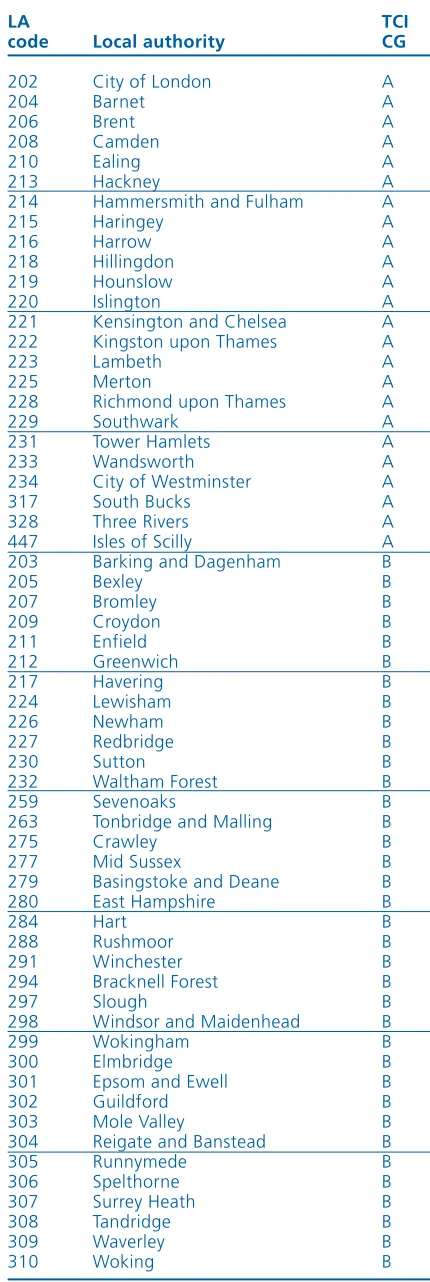
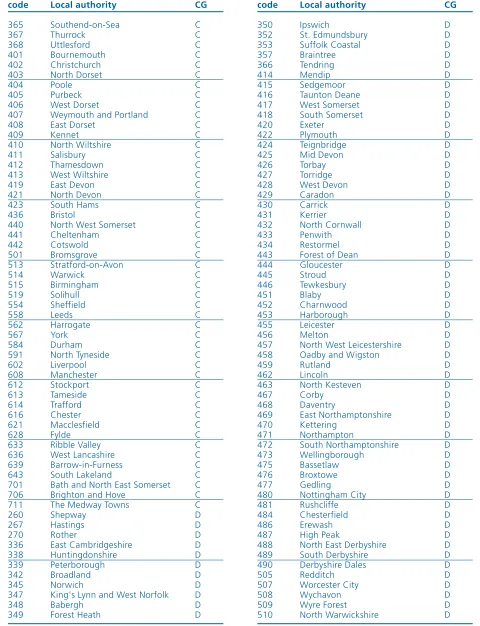
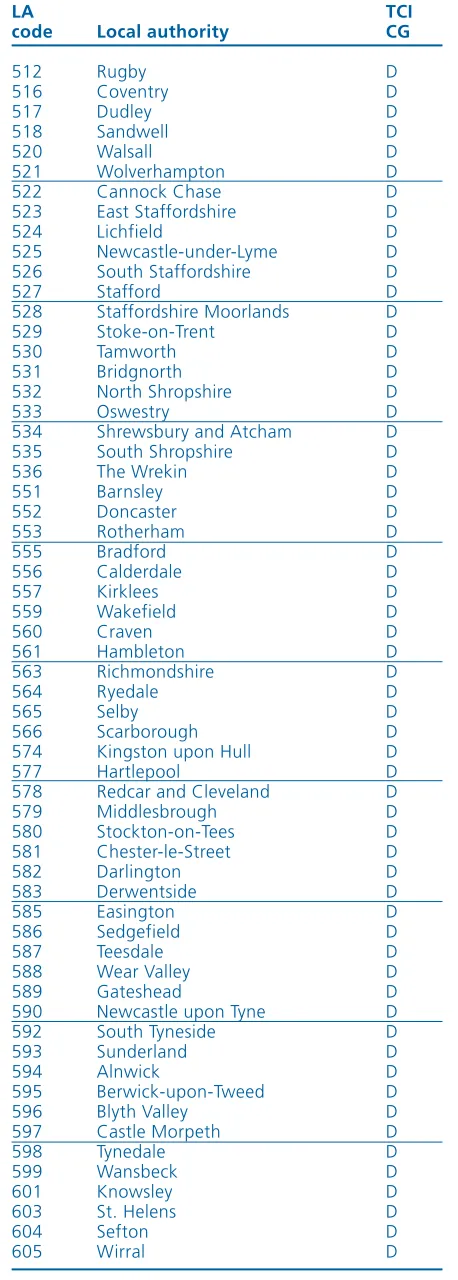
TABLE 1: LOCAL AUTHORITIES WITHIN EACH TCI AREA (BASED ON TCI CIRCULAR OF 1998/99)
LA TCI
code Local authority CG
202 City of London A 204 Barnet A 206 Brent A 208 Camden A 210 Ealing A 213 Hackney A 214 Hammersmith and Fulham A 215 Haringey A 216 Harrow A 218 Hillingdon A 219 Hounslow A 220 Islington A 221 Kensington and Chelsea A 222 Kingston upon Thames A 223 Lambeth A 225 Merton A 228 Richmond upon Thames A 229 Southwark A 231 Tower Hamlets A 233 Wandsworth A 234 City of Westminster A 317 South Bucks A 328 Three Rivers A 447 Isles of Scilly A 203 Barking and Dagenham B 205 Bexley B 207 Bromley B 209 Croydon B 211 Enfield B 212 Greenwich B 217 Havering B 224 Lewisham B 226 Newham B 227 Redbridge B 230 Sutton B 232 Waltham Forest B 259 Sevenoaks B 263 Tonbridge and Malling B 275 Crawley B 277 Mid Sussex B 279 Basingstoke and Deane B 280 East Hampshire B 284 Hart B 288 Rushmoor B 291 Winchester B 294 Bracknell Forest B 297 Slough B 298 Windsor and Maidenhead B 299 Wokingham B 300 Elmbridge B 301 Epsom and Ewell B 302 Guildford B 303 Mole Valley B 304 Reigate and Banstead B 305 Runnymede B 306 Spelthorne B 307 Surrey Heath B 308 Tandridge B 309 Waverley B 310 Woking B
LA TCI
code Local authority CG
LA TCI
code Local authority CG
365 Southend-on-Sea C 367 Thurrock C 368 Uttlesford C 401 Bournemouth C 402 Christchurch C 403 North Dorset C 404 Poole C 405 Purbeck C 406 West Dorset C 407 Weymouth and Portland C 408 East Dorset C 409 Kennet C 410 North Wiltshire C 411 Salisbury C 412 Thamesdown C 413 West Wiltshire C 419 East Devon C 421 North Devon C 423 South Hams C 436 Bristol C 440 North West Somerset C 441 Cheltenham C 442 Cotswold C 501 Bromsgrove C 513 Stratford-on-Avon C 514 Warwick C 515 Birmingham C 519 Solihull C 554 Sheffield C 558 Leeds C 562 Harrogate C 567 York C 584 Durham C 591 North Tyneside C 602 Liverpool C 608 Manchester C 612 Stockport C 613 Tameside C 614 Trafford C 616 Chester C 621 Macclesfield C 628 Fylde C 633 Ribble Valley C 636 West Lancashire C 639 Barrow-in-Furness C 643 South Lakeland C 701 Bath and North East Somerset C 706 Brighton and Hove C 711 The Medway Towns C 260 Shepway D 267 Hastings D 270 Rother D 336 East Cambridgeshire D 338 Huntingdonshire D 339 Peterborough D 342 Broadland D 345 Norwich D 347 King's Lynn and West Norfolk D
Y 2002
LA TCI
code Local authority CG
[image:12.595.63.543.170.796.2]11
APPENDIX I: JANUAR
Y 2002
LA TCI
code Local authority CG
512 Rugby D 516 Coventry D 517 Dudley D 518 Sandwell D 520 Walsall D 521 Wolverhampton D 522 Cannock Chase D 523 East Staffordshire D 524 Lichfield D 525 Newcastle-under-Lyme D 526 South Staffordshire D 527 Stafford D 528 Staffordshire Moorlands D 529 Stoke-on-Trent D 530 Tamworth D 531 Bridgnorth D 532 North Shropshire D 533 Oswestry D 534 Shrewsbury and Atcham D 535 South Shropshire D 536 The Wrekin D 551 Barnsley D 552 Doncaster D 553 Rotherham D 555 Bradford D 556 Calderdale D 557 Kirklees D 559 Wakefield D 560 Craven D 561 Hambleton D 563 Richmondshire D 564 Ryedale D 565 Selby D 566 Scarborough D 574 Kingston upon Hull D 577 Hartlepool D 578 Redcar and Cleveland D 579 Middlesbrough D 580 Stockton-on-Tees D 581 Chester-le-Street D 582 Darlington D 583 Derwentside D 585 Easington D 586 Sedgefield D 587 Teesdale D 588 Wear Valley D 589 Gateshead D 590 Newcastle upon Tyne D 592 South Tyneside D 593 Sunderland D 594 Alnwick D 595 Berwick-upon-Tweed D 596 Blyth Valley D 597 Castle Morpeth D 598 Tynedale D 599 Wansbeck D 601 Knowsley D 603 St. Helens D 604 Sefton D 605 Wirral D
LA TCI
code Local authority CG
[image:13.595.54.283.159.799.2]Y 2002
Sq metres = Hectare 10,000
[image:14.595.56.566.93.782.2]Example: a site measures a total of 2000 sq m 2,000 = 0.2 Hectare 10,000
13
APPENDIX I: JANUAR
Y 2002
LA Small Bulk
code Local authority sites land
[image:15.595.94.530.134.801.2]202 City of London 20,500 20,500 203 Barking and Dagenham 1,358 1,600 204 Barnet 3,800 3,500 205 Bexley 2,000 1,600 206 Brent 2,300 3,000 207 Bromley 2,000 2,470 208 Camden 9,000 5,500 209 Croydon 2,000 2,000 210 Ealing 3,100 3,200 211 Enfield 3,000 2,800 212 Greenwich 2,000 1,700 213 Hackney 2,500 2,500 214 Hammersmith and Fulham 5,000 2,550 215 Haringey 2,500 2,500 216 Harrow 2,500 3,400 217 Havering 1,736 2,000 218 Hillingdon 2,300 3,000 219 Hounslow 3,100 3,200 220 Islington 5,250 5,250 221 Kensington and Chelsea 27,000 17,500 222 Kingston upon Thames 2,350 2,350 223 Lambeth 2,100 2,100 224 Lewisham 1,600 1,600 225 Merton 2,500 2,500 226 Newham 1,545 1,425 227 Redbridge 1,650 1,650 228 Richmond upon Thames 2,600 2,600 229 Southwark 2,300 2,300 230 Sutton 1,900 2,470 231 Tower Hamlets 2,475 2,225 232 Waltham Forest 1,650 1,650 233 Wandsworth 2,900 2,900 234 City of Westminster 20,500 20,500 251 Ashford 1,020 925 252 Canterbury 1,850 1,350 253 Dartford 1,100 1,100 254 Dover 700 450 256 Gravesham 825 825 257 Maidstone 1,250 1,250 259 Sevenoaks 1,600 1,600 260 Shepway 865 650 261 Swale 890 710 262 Thanet 700 450 263 Tonbridge and Malling 1,500 1,500 264 Tunbridge Wells 1,600 1,600 266 Eastbourne 875 750 267 Hastings 375 275 269 Lewes 900 900 270 Rother 740 700 271 Wealden 1,040 875 272 Adur 800 750 273 Arun 1,125 1,110 274 Chichester 1,850 1,750 275 Crawley 1,200 1,200 276 Horsham 1,450 1,425 277 Mid Sussex 1,000 1,050 278 Worthing 950 900 279 Basingstoke and Deane 1,720 1,720 280 East Hampshire 1,500 1,500 281 Eastleigh 1,440 1,250
TABLE 3: VALUATION OFFICE RESIDENTIAL LAND VALUES AT SPRING 1999 £000 per hectare, small sites and bulk land (more than 2 hectares)
LA Small Bulk
code Local authority sites land
282 Fareham 1,400 1,200 283 Gosport 1,025 1,000 284 Hart 1,720 1,720 285 Havant 1,200 1,100 286 New Forest 1,280 1,400 287 Portsmouth 1,000 900 288 Rushmoor 1,720 1,720 289 Southampton 1,400 1,020 290 Test Valley 1,250 1,100 291 Winchester 1,720 1,720 294 Bracknell Forest 2,000 2,000 295 West Berkshire 1,600 1,600 296 Reading 1,950 1,950 297 Slough 1,950 1,950 298 Windsor and Maidenhead 2,100 2,100 299 Wokingham 2,000 2,000 300 Elmbridge 1,800 1,500 301 Epsom and Ewell 1,450 1,400 302 Guildford 2,250 2,250 303 Mole Valley 975 1,425 304 Reigate and Banstead 1,780 1,750 305 Runnymede 2,300 2,300 306 Spelthorne 1,780 1,750 307 Surrey Heath 2,200 2,200 308 Tandridge 1,780 1,750 309 Waverley 2,000 2,000 310 Woking 2,150 2,150 311 Cherwell 1,000 900 312 Oxford 3,500 3,350 313 South Oxfordshire 1,250 1,200 314 Vale of White Horse 1,200 1,150 315 West Oxfordshire 1,200 1,100 316 Aylesbury Vale 1,600 1,600 317 South Buckinghamshire 2,750 2,750 318 Chiltern 2,500 2,500 319 Milton Keynes 1,500 1,500 320 Wycombe 2,100 2,100 321 Broxbourne 2,200 2,000 322 Dacorum 1,900 2,250 323 East Hertfordshire 1,400 1,350 324 Hertsmere 1,900 2,250 325 North Hertfordshire 1,200 1,100 326 St Albans 1,900 2,250 327 Stevenage 1,400 1,250 328 Three Rivers 1,900 2,250 329 Watford 1,900 2,250 330 Welwyn Hatfield 1,400 1,200 331 North Bedfordshire 1,000 1,000 332 Luton 1,000
Y 2002
LA Small Bulk
code Local authority sites land
344 North Norfolk 350 300 345 Norwich 600 550 346 South Norfolk 350 300 347 King's Lynn and West Norfolk 325 275 348 Babergh 350 335 349 Forest Heath 320 300 350 Ipswich 650 630 351 Mid Suffolk 308 300 352 St Edmundsbury 650 650 353 Suffolk Coastal 410 400 354 Waveney 320 320 355 Basildon 1,025 988 356 Brentwood 1,555 1,400 357 Braintree 800 750 358 Castle Point 1,200 1,300 359 Chelmsford 1,280 1,225 360 Colchester 900 900 361 Epping Forest 1,600 1,480 362 Harlow 1,025 988 363 Maldon 700 900 364 Rochford 900 1,100 365 Southend-on-Sea 990 920 366 Tendring 600 400 367 Thurrock 640 555 368 Uttlesford 1,200 1,100 401 Bournemouth 1,600 1,500 402 Christchurch 1,600 1,500 403 North Dorset 950 915 404 Poole 1,600 1,500 405 Purbeck 1,000 950 406 West Dorset 925 875 407 Weymouth and Portland 850 800 408 East Dorset 1,400 1,300 409 Kennet 700 700 410 North Wiltshire 950 950 411 Salisbury 1,050 1,050 412 Swindon 850 1,050 413 West Wiltshire 800 950 414 Mendip 600 550 415 Sedgemoor 450 440 416 Taunton Deane 925 875 417 West Somerset 620 580 418 South Somerset 1,000 900 419 East Devon 893 819 420 Exeter 1,103 987 421 North Devon 683 612 422 Plymouth 683 525 423 South Hams 716 625 424 Teignbridge 893 819 425 Mid Devon 683 612 426 Torbay 914 840 427 Torridge 525 478 428 West Devon 680 650 429 Caradon 200 220 430 Carrick 400 350 431 Kerrier 300 265 432 North Cornwall 320 290 433 Penwith 330 300
LA Small Bulk
code Local authority sites land
440 North Somerset 1,100 950 441 Cheltenham 1,500 1,500 442 Cotswold 1,350 1,350 443 Forest of Dean 740 740 444 Gloucester 1,100 1,100 445 Stroud 850 850 446 Tewkesbury 1,100 1,100 447 Isles of Scilly 1,480 2,200 451 Blaby 750 700 452 Charnwood 800 800 453 Harborough 750 800 454 Hinckley and Bosworth 850 750 455 Leicester 750 700 456 Melton 775 725 457 North West Leicestershire 750 750 458 Oadby and Wigston 750 700 459 Rutland 800 675 460 Boston 270 185 461 East Lindsey 410 250 462 Lincoln 500 375 463 North Kesteven 340 250 464 South Holland 325 300 465 South Kesteven 375 250 466 West Lindsey 210 135 467 Corby 350 350 468 Daventry 740 740 469 East Northamptonshire 570 570 470 Kettering 618 618 471 Northampton 800 800 472 South Northamptonshire 865 865 473 Wellingborough 679 679 474 Ashfield 350 300 475 Bassetlaw 400 300 476 Broxtowe 680 625 477 Gedling 675 600 478 Mansfield 320 300 479 Newark and Sherwood 425 340 480 Nottingham City 700 620 481 Rushcliffe 800 745 482 Amber Valley 520 450 483 Bolsover 325 250 484 Chesterfield 495 325 485 Derby 600 550 486 Erewash 540 460 487 High Peak 440 440 488 North East Derbyshire 450 270 489 South Derbyshire 460 375 490 Derbyshire Dales 550 490 501 Bromsgrove 1,235 1,350 505 Redditch 810 775 507 Worcester 820 775 508 Wychavon 830 765 509 Wyre Forest 1,050 1,175 510 North Warwickshire 725 600 511 Nuneaton & Bedworth 700 600 512 Rugby 800 700 513 Stratford-on-Avon 1,450 1,400 514 Warwick 1,900 1,800 TABLE 3 (CONTINUED): VALUATION OFFICE RESIDENTIAL LAND VALUES AT SPRING 1999
[image:16.595.62.545.152.798.2]15
APPENDIX I: JANUAR
Y 2002
LA Small Bulk
code Local authority sites land
517 Dudley 950 1,000 518 Sandwell 570 480 519 Solihull 1,800 1,650 520 Walsall 975 1,025 521 Wolverhampton 900 950 522 Cannock Chase 900 950 523 East Staffordshire 700 475 524 Lichfield 1,100 900 525 Newcastle-under-Lyme 450 325 526 South Staffordshire 950 1,000 527 Stafford 600 425 528 Staffordshire Moorlands 450 325 529 Stoke-on-Trent 450 325 530 Tamworth 750 575 531 Bridgnorth 750 715 532 North Shropshire 495 495 533 Oswestry 490 445 534 Shrewsbury and Atcham 650 765 535 South Shropshire 495 445 536 Wrekin 500 550 551 Barnsley 550 375 552 Doncaster 625 425 553 Rotherham 460 440 554 Sheffield 630 540 555 Bradford 600 525 556 Calderdale 550 450 557 Kirklees 615 475 558 Leeds 1,000 975 559 Wakefield 700 500 560 Craven 525 500 561 Hambleton 800 800 562 Harrogate 850 1,000 563 Richmondshire 600 540 564 Ryedale 500 400 565 Selby 450 350 566 Scarborough 400 350 567 York 800 750 574 Kingston upon Hull 475 375 577 Hartlepool 500 475 578 Redcar and Cleveland 375 400 579 Middlesbrough 425 450 580 Stockton-on-Tees 500 500 581 Chester-le-Street 494 494 582 Darlington 500 500 583 Derwentside 315 275 584 Durham 650 600 585 Easington 350 215 586 Sedgefield 350 300 587 Teesdale 325 300 588 Wear Valley 400 300 589 Gateshead 500 450 590 Newcastle upon Tyne 800 800 591 North Tyneside 600 800 592 South Tyneside 500 450 593 Sunderland 475 425 594 Alnwick 430 310 595 Berwick-upon-Tweed 370 245 596 Blyth Valley 245 200 597 Castle Morpeth 450 370 598 Tynedale 495 400
LA Small Bulk
code Local authority sites land
599 Wansbeck 245 200 601 Knowsley 400 350 602 Liverpool 700 650 603 St Helens 500 410 604 Sefton 500 425 605 Wirral 360 360 606 Bolton 550 500 607 Bury 550 500 608 Manchester 1,000 800 609 Oldham 675 625 610 Rochdale 650 650 611 Salford 500 450 612 Stockport 1,350 1,350 613 Tameside 600 490 614 Trafford 925 855 615 Wigan 550 450 616 Chester 645 825 617 Congleton 540 500 618 Crewe and Nantwich 350 300 619 Ellesmere Port and Neston 360 350 620 Halton 500 450 621 Macclesfield 700 550 622 Vale Royal 575 500 623 Warrington 940 700 624 Blackburn 470 325 625 Blackpool 750 675 626 Burnley 470 310 627 Chorley 775 625 628 Fylde 800 750 629 Hyndburn 470 235 630 Lancaster 800 750 631 Pendle 470 270 632 Preston 775 625 633 Ribble Valley 675 625 634 Rossendale 475 265 635 South Ribble 775 625 636 West Lancashire 775 625 637 Wyre 800 750 638 Allerdale 250 197 639 Barrow-in-Furness 425 375 640 Carlisle 360 270 641 Copeland 200 150 642 Eden 320 270 643 South Lakeland 675 575 701 Bath and NE Somerset 1,500 1,400 702 S Gloucestershire 1,300 1,200 706 Brighton and Hove 1,200 1,000 707 Isle of Wight 475 360 708 East Riding of Yorkshire 610 550 709 N E Lincolnshire 410 350 710 North Lincolnshire 410 350 711 Medway Towns 750 730 712 Hereford 600 570 713 Malvern Hills 820 795 TABLE 3 (CONTINUED): VALUATION OFFICE RESIDENTIAL LAND VALUES AT SPRING 1999
[image:17.595.73.536.138.791.2]