ORIGINAL RESEARCH
Degree of Hippocampal Atrophy Is Related to
Side of Seizure Onset in Temporal Lobe Epilepsy
M. Garcı´a-Fin˜ana C.E. Denby S.S. Keller U.C. Wieshmann N. Roberts
BACKGROUND AND PURPOSE: Temporal lobe epilepsy (TLE) is associated with pathologic changes in hippocampal physiology and morphology. Our aim was to quantify volume reduction of the right and left hippocampus in patients with TLE and to investigate whether the degree of hippocampal atrophy is related to the side of seizure onset.
METHODS: The volume of the right and left hippocampus was estimated for 50 controls and 101 patients with TLE, by applying the unbiased Cavalieri method on MR images.
RESULTS: Pairwise comparisons, within a multivariate analysis of variance and adjusted by using the Bonferroni correction, revealed that both right and left hippocampal volumes were, on average, significantly smaller in patients with right-sided seizure onset (R-patients) relative to those of controls (P⬍.001 andP⫽.04, respectively). Furthermore, left hippocampal volume was significantly smaller in patients with left-sided seizure onset (L-patients) compared with controls (P ⬍ .001), but the right-sided hippocampal volume was not significantly smaller (P ⫽ .71). Moreover, a correlation analysis revealed that the strong linear association between the right and left hippocampal volumes existing in the control population (r⫽0.73) is partially lost in patients with TLE (rⱕ0.48), and this loss in correlation appears to be more pronounced in L-patients than in R-patients.
CONCLUSION:Our MR imaging results suggest that although the major damage in patients with TLE is located in the hippocampus ipsilateral to the side of seizure onset, R-patients are more likely to have bilateral hippocampal volume reduction. These findings support the hypothesis that cerebral hemi-spheres may not only differ in their functionality organization but also in their vulnerability to a neurologic insult.
H
ippocampal sclerosis is the most common neuropathol-ogy associated with medically intractable temporal lobe epilepsy (TLE).1,2This abnormality— characterized by neuro-nal loss and reactive gliosis—is found in approximately 65% of surgically resected temporal lobes.3Although diagnosis of hip-pocampal sclerosis may be rigorously established only by his-topathologic examination, it can be inferred during presurgi-cal evaluation by performing quantitative imaging analysis on T1-weighted and T2-weighted MR images.3-12Evidence of volume reduction of the hippocampus ipsilat-eral to the side of seizure onset in patients with TLE has been observed in a large number of studies.8,12-15In particular, ste-reologic methods, namely the Cavalieri method and point-counting, have been applied to MR images to estimate hip-pocampal volume in patients with TLE and in controls.12,15,16 Besides the property of lack of bias, the main attractive features of the stereologic methods are their high efficiency and easy implementation. For this reason, stereologic methods have been applied in combination with MR imaging to obtain, without shape assumptions, unbiased volume estimations of a wide variety of biologic structures.17-22
The influence of the side of seizure onset on hippocampal atrophy has been previously analyzed.14In this analysis, the hippocampus was divided into head, body, and tail according
to specific anatomic borders as defined by Duvernoy.23The study revealed hippocampal atrophy contralateral to the side of seizure onset with a different location in patients with right and left TLE (body and head, respectively). The objective of this study was to quantify hippocampal volume reduction in patients with TLE and to investigate whether there is a rela-tionship between degree of hippocampal atrophy and side of seizure onset.
Methods
Subjects
One hundred forty-one patients with clinical evidence of TLE referred for presurgical evaluation were included in this cross-sectional retro-spective study. Informed consent was obtained from the patient, and protocol approval was acquired from an ethics committee. Family history of epilepsy was absent. MR images did not show foreign tissue or dysgenetic, vascular, or posttraumatic lesions. Among the 141 pa-tients considered for epilepsy surgery, 19 papa-tients with bilateral sei-zure onset and 21 for whom the classification of side of seisei-zure onset was not established were excluded from the analysis. To avoid the introduction of selection bias, we included all the remaining 101 patients in the analysis, independent of whether they underwent surgery.
From the 101 patients, 48 patients showed evidence of a right-sided seizure onset (R-patients) and 53 patients showed evidence of a left-sided seizure onset (L-patients) (Table 1). The patients were classified as having right- or left-sided seizure onset by using surface electroencephalogram recordings (EEG) and invasive foramen ovale recordings when EEG re-cordings failed to establish a focus. Fifty controls with no history of neu-rologic or psychiatric impairments were also investigated.
The Cavalieri Volume Estimator
The volume of the hippocampus was estimated for each subject by using the Cavalieri method in combination with point-counting. The
Received June 24, 2005; accepted after revision September 20.
This work was supported by the Spanish Ministry of Science and Technology I⫹D Project no. MTM2005– 08689-C02– 01. S.S.K. was funded by Professions Allied to Medicine Grant, The School of Health Sciences, University of Liverpool.
From the Centre for Medical Statistics (M.G.-F.), Health Evaluation; Magnetic Resonance and Image Analysis Research Centre (MARIARC) (C.E.D., S.S.K., N.R.), University of Liverpool; and The Walton Centre for Neurology and Neurosurgery (WCNN) (S.S.K., U.C.W.), Liverpool, UK.
Cavalieri volume estimator is applied by intersecting the structure, physically or with a noninvasive method, by a set of parallel and sys-tematic planes a distanceTapart (Fig 1). The volume is estimated by
1) Vˆ⫽T共A1⫹A2⫹ 䡠 䡠 䡠 ⫹An兲
whereAi, i⫽1, 2, . . . ,nis the intersection area between the structure
and a plane at the point of abscissaez⫹(i⫺1)T, andz, which gives the position for the first nonempty intersection, is a uniform random abscissa in an interval of lengthT(24and references therein).
When section areas, {Ai,i⫽1, 2, . . . ,n}, cannot be measured
automatically, they can be estimated without bias by
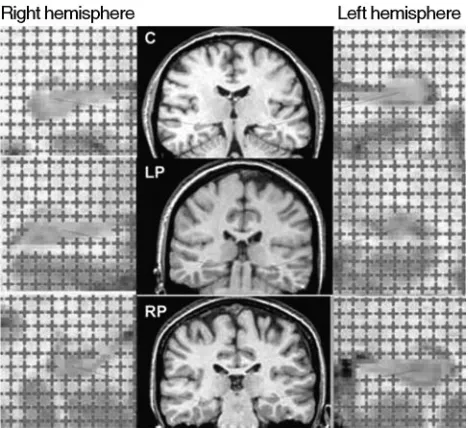
point-count-ing.25In this method, a square grid of test points, with a convenient grid sideu, is superimposed uniformly at random on each section (Fig 2). LetPidenote the number of test points hitting a section of
un-known areaAi.An unbiased estimator ofAiisAˆi⫽u2Piand equation
1 becomes
2) Vˆ⫽Tu2共P
1⫹P2⫹ 䡠 䡠 䡠 ⫹Pn兲
Equation 2 provides an unbiased estimator ofVbased on 2 sampling stages, namely Cavalieri sectioning and point-counting.
Acquisition of MR Images and Volume Estimation
MR images for patients and controls were acquired with a 1.5T SIGNA whole-body imaging system (GE Healthcare, Milwaukee, Wis). A total of 124 coronal T1-weighted images were recorded per subject by using 3D spoiled gradient-echo (SPGR) pulse imaging (TR/TE, 34/ 9 ms; flip angle, 30°). Each image refers to a contiguous section of tissue of 1.6-mm thickness with a field of view of 20 cm (Fig 2, middle column).
The SPGR images transferred to a SPARC 10 workstation (Sun Microsystems, Santa Clara, Calif) and input to Analyze software (Mayo Foundation, Rochester, Minn) where the 256⫻256⫻124 acquired voxels of sides 0.625⫻0.625⫻1.6 mm, were linearly inter-polated to 256⫻256⫻256 cubic voxels of the 0.781-mm side. To obtain an optimal visualization of the hippocampal structure, we re-formatted the image sections along the long axis of the hippocampus. For each subject, a sample consisting of every third MR image, begin-ning at a random starting position within the section interval, was extracted from the completed image set for point-counting analysis. The distance between consecutive images was therefore T ⫽
3⫻0.781⫽2.343 mm. A test system for point-counting with a grid sizeu⫽2.343 mm (ie, 3 pixels) was superimposed uniformly at ran-dom on each MR image within the Analyze software, and its orienta-tion was maintained constant in all secorienta-tions (Fig 2). However, it is recommended to superimpose the square grid isotropically at ran-dom on each of the sections; in fact, the error prediction formula here applied (see next subsection) has been designed under this
assump-Fig 1.Illustration of the application of the Cavalieri method to estimate hippocampal
volume.
[image:2.585.301.535.42.256.2]Fig 2. Illustration of the point-counting technique applied to estimate hippocampal volume from MR images of a control (C, top row), patient with left-sided seizure onset (LP, second row), and patient with right-sided seizure onset (RP, bottom row).
Table 1: Demographic and clinical information for controls and patients
Controls
Left-Sided Seizure Onset
Right-Sided Seizure Onset
Mean age, y (SD) 33 (10.4) 34 (8.4) 34 (9.7)
Sex (%)
M 25 (50) 24 (45.3) 20 (42)
F 25 (50) 29 (55.7) 28 (58)
Handedness (%)
Right 42 (87.5) 40 (80) 43 (91.5)
Left 6 (12.5) 10 (20) 4 (8.5)
Not established 2 3 1
Mean onset, y (SD) 10.6 (9) 10.4 (8)
Febrile convulsiosn (%)
Yes 18 (45) 15 (36.6)
No 22 (55) 26 (63.4)
Not recorded 13 7
BRAIN
ORIGINAL
[image:2.585.53.287.51.559.2]tion of isotropy. Unbiased volume estimates of the right and left hip-pocampus were obtained by applying equation 2.
The hippocampus comprises, in our definition, hippocampus proper, dentate gyrus, ambient gyrus, subiculum, fimbria, alveus, and hippocampal vertical digitations; the uncus and choroid plexus are both excluded. The anterior boundary of the hippocampus is here defined as the first section on which the hippocampus can be differ-entiated from the amygdala (by visualization of the alveus and the region of CSF superior to the alveus). The posterior boundary is de-fined as the section on which the lateral ventricles divide into frontal and temporal lobes (Fig 3).
Error Prediction of the Cavalieri and Point-Counting Techniques
The volume estimate given by equation 2 is affected by 2 different types of stereologic error. The first is due to the variability among sections (Cavalieri sampling), whereas the second is due to the vari-ability within sections (point-counting). The stereologic coefficient of error ofVˆ(ie, CE(Vˆ)⫽公Var(Vˆ)/Vwhere Var(Vˆ )is the variance of the volume estimatorVˆandVis the true volume) is frequently used to asses the precision of the volume estimator. The prediction ofCE(Vˆ )
from a single systematic sample {P1, P2, . . . ,Pn} is, however, not a trivial problem because the observations are not independent in gen-eral. The relevant theory, originally developed by Matheron, has been elaborated and adapted to stereology.26-30These results, together with some recent findings,21,31-35have made possible the elaboration of a convenient formula for predicting the coefficient of error of the vol-ume estimate. In particular, the square coefficient of error is decom-posed into
3) CE2共Vˆ兲⫽CE
S
2共Vˆ兲⫹CE
PC
2 共Vˆ兲
where CES2(Vˆ) is the contribution of the variability between sections
and CEPC2 (Vˆ) is the mean variability due to point-counting within sections. A recent error predictor formula, which is based on estima-tors of these 2 components, is available in Garcı´a-Fin˜ana et al,21 equa-tions 3.5–3.6.
Statistical Analysis
One-way analysis of variance (ANOVA) and the2test were applied to test whether controls, R-patients, and L-patients were significantly unbalanced in age, sex, and handedness and whether R- and
L-pa-tients were significantly unbalanced in age of onset and febrile convulsions.
Critical Limits for the Hippocampal Volume and Asymmetry Index
Hippocampal volume smaller than a speci-fied critical value was classispeci-fied as hip-pocampal abnormality. Under the assump-tion that the hippocampal volume estimate in controls can be considered normally dis-tributed, then, a 100(1⫺␣)% prediction lower bound for a new observation of the hippocampal volume can be obtained by applying
4) Vcritical⫽V⫺t1⫺a,N⫺1䡠sV䡠
冑
1⫹(1/N)whereN is the control sample size,Vis the mean volume of the control sample,t1⫺␣,N⫺1is the (1⫺␣)— quantile of the Studentt distribution withN⫺1 degrees of freedom, andsVis the control
sample standard deviation.
Hippocampal volume asymmetry index is defined as
IA⫽2(VL⫺VR)/(VL⫹VR). Under the assumption thatIAin
con-trols follows a normal distribution, a 2-sided 100(1⫺␣)% prediction interval for a new observation ofIAcan be obtained by applying I¯A⫾t1⫺␣/2,N⫺1䡠sI
A䡠公1⫹(1/N), whereI¯AandsIAare the mean and
standard deviation ofIAin the control sample, respectively.
Comparison of Hippocampal Volume Between Patients with TLE and Controls
There is a certain degree of association between the right and left hippocampal volume. For this reason, it seems natural to analyze the right and left hippocampal volumes together, as a bivariate variable. To test whether hippocampal volume differs among the 3 subject groups (controls, R-patients, and L-patients), we performed a bivari-ate analysis of variance (MANOVA). MANOVA provides an overall analysis of the whole data; therefore, if the test is significant, pairwise comparisons need to be carried out to identify which groups differ and for which particular variable.
Correlation Between Right and Left Hippocampal Volume
Spearman’s rank correlation was used to assess the degree of linear association between the right and left hippocampus volume. We an-alyzed whether the correlation existing in the control population dif-fers from the one observed in R-patients and/or L-patients.
Results
Comparison of Subject’s Characteristics
Control and patient groups did not differ significantly in age (1-way ANOVA;P⫽.67), sex (2;P⫽.71), and handedness (2;P⫽.25). Also, R-patients were not significantly different from L-patients in age of seizure onset (Mann-WhitneyUtest;
P⫽.92) or presence of febrile convulsions (2,P⫽.44).
Statistical Distribution of the Control Data
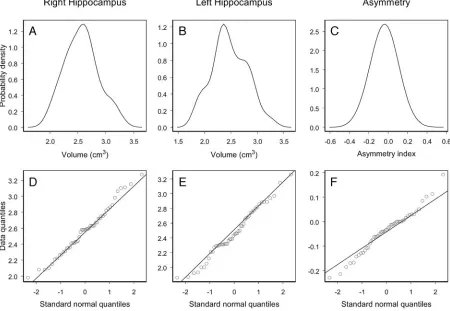
The hypothesis of normality was not rejected for the right and left hippocampal volume in controls (P⫽.65 andP⫽.44, respectively). The degree of agreement between the probabil-ity distribution of the data (Fig 4A, -B) and the normal
prob-Fig 3.Illustration of the boundaries of the hippocampus.
[image:3.585.55.377.43.241.2]ability distribution can be interpreted by the Q-Q plots dis-played in Fig 4D, -E). Q-Q plots show data quantiles plotted versus quantiles of the standard normal distribution. In par-ticular, a straight line passing through the first and third quar-tiles of the data and the corresponding quarquar-tiles of the stan-dard normal distribution is plotted. As one can appreciate in Fig 4, the control data do not show important deviations from the straight line that would exactly fit the data if they were normally distributed.
The hypothesis thatIAin controls follows a normal
distri-bution was not rejected (P⫽.28) (Fig 4C, -F).
Precision of the Hippocampal Volume Estimate
The efficiency of the Cavalieri method and point-counting to estimate hippocampal volume is directly connected with the geometry of the hippocampal boundary. In this study, the precision of the right and left hippocampal volume es-timate was not different among controls, R-patients, and L-patients. The coefficients of error obtained were between 3% and 5%.
Critical Limits for the Hippocampal Volume and Asymmetry Index
The 99% lower bounds for the right and left hippocampal volume, obtained by applying equation 4 to the control data, were 1.84 cm3and 1.66 cm3, respectively. The 99% prediction interval obtained for a new observation of IA was ⫺0.27⬍IA⬍0.19. Thus, a patient is classified as having
bi-lateral hippocampal atrophy if the right and left hippocampal volume estimate (VRandVL, respectively) is smaller than 1.84
cm3and 1.66 cm3, respectively. Unilateral right hippocampal atrophy is detected ifVR⬍184 cm3andVLⱖ166 cm3, and
unilateral left hippocampal atrophy, ifVRⱖ184 cm3andVL ⬍166 cm3. The asymmetry index is regarded as abnormal whenIA⬍ ⫺0.27 orIA ⬎0.19.
Estimates of right and left hippocampal volume and vol-ume asymmetry of patients with TLE are plotted with the corresponding 99% critical limits predicted from the con-trol data (Fig 5). From the 48 R-patients, 31 patients showed evidence of unilateral right hippocampal atrophy, 1 patient showed left hippocampal atrophy, and 4 patients showed evidence of bilateral hippocampal atrophy (Table 2 and Fig 5, left panel). Two R-patients for whom the volume of neither hippocampus was significantly smaller than the lower bound presented a significantly larger IA(ie, with
greater left than right hippocampal volume) compared with that of controls. From the 53 L-patients, 38 patients showed evidence of unilateral left hippocampal atrophy and 1 pa-tient showed evidence of bilateral hippocampal atrophy (none of the L-patients presented unilateral right hip-pocampal atrophy). Five L-patients, for whom the volume of neither hippocampus was significantly smaller than the lower bound, presented a significantly lowerIA(ie, with
smaller left than right hippocampal volume) compared with that of controls.
The proportion of patients with hippocampal atrophy showing bilateral atrophy differed between R-patients (2%) and L-patients (8%), though this difference was not statisti-cally significant (Fisher exact test,P⫽.09).
[image:4.585.68.518.48.359.2]Comparison of Hippocampal Volume Between Patients with TLE and Controls
A large proportion of R-patients (73%) and L-patients (74%) showed a lower volume of the hippocampus ipsilateral to the side of seizure onset than the corresponding 99% lower bound (Fig 5, left panel). Although this effect is not so pronounced for the hippocampus contralateral to the side of seizure onset, R-patients seemed to have, on average, a lower contralateral volume compared with controls. A MANOVA test revealed that hippocampal volume differed significantly among the 3 groups of interest (ie, controls and patients with right and left seizure onset;P⬍.001). Pairwise comparisons, adjusted by using the Bonferroni correction, revealed that R-patients had a significantly smaller right and left hippocampal volume com-pared with that of controls (P⬍.001 andP⫽.04, respec-tively). On the other hand, L-patients showed a significantly smaller left hippocampal volume relative to that of controls (P⬍.001), though no significant difference was found in the right hippocampal volume relative to that of controls (P⫽.71).
Correlation Between Right and Left Hippocampal Volume in Patients with TLE
Analysis of the correlation between the right and left hippocam-pal volume in patients with TLE suggests that there is a different
volume reduction process between R- and L-patients. As one would expect, there is a strong correlation between the right and left hippocampal volume in controls (Spearman rank correlation,
r⫽0.73,P⬍.001), (ie, large/small left hippocampal volume is associated with large/small right hippocampal volume; Fig 6, bot-tom panel). This high level of correlation is partially lost in pa-tients with TLE because of unilateral or bilateral volume changes of the hippocampus. In particular, a weaker, but still strongly significant, linear association (r⫽0.48,P⫽.001) can be observed in R-patients, for whom the contralateral hippocampal volume reduction seems to be correlated with the ipsilateral hippocampal volume reduction (Fig 6, top left panel). On the other hand, L-patients showed much weaker linear association between the right and left hippocampal volume (r⫽0.28,P⫽.04). This may be explained by the fact that L-patients do not show a significant volume change of the contralateral hippocampus, whereas an im-portant volume reduction, and not proportional to the initial volume, was observed in the ipsilateral hippocampus.
Discussion
Our findings can be summarized as follows: (1) The Cavalieri method and point-counting can be used in clinical practice to obtain unbiased and highly efficient estimates of the hip-pocampal volume (coefficient of error [CE]⬍5%). Also, the error predictor formulae of the Cavalieri estimator enable us to predict the precision of the hippocampal volume estimate from the data itself. (2) We provide a classification of hip-pocampal atrophy (ie, unilateral or bilateral) based on 99% bounds for hippocampal volume in controls. The analysis re-vealed bilateral hippocampal atrophy in 8% and 2% of the R-patients and L-patients, respectively. (3) The multivariate analysis showed strong evidence of volume reduction in the hippocampus ipsilateral to the side of seizure onset in patients with TLE and evidence of volume reduction in the hippocam-pus contralateral to side of seizure onset in R-patients, though this effect was not statistically significant in L-patients. (4) Analysis of the correlation between the right and left hip-pocampal volume showed a stronger level of correlation in R-patients than in L-patients.
Volume reduction in the hippocampus ipsilateral to side of
Fig 5.Left and right hippocampal volume estimate (left panel) and hippocampal volume asymmetry index (right panel) for controls and patients with TLE. The dashed lines represent the
[image:5.585.56.535.41.222.2]99% prediction lower bounds for the left and right hippocampal volume estimate (left panel) and the 99% prediction interval for the hippocampal volume asymmetry index (right panel). The proportion of patients showing abnormal hippocampal volume is indicated in parentheses.
Table 2: Classification of hippocampal atrophy in 101 patients with temporal lobe epilepsy
Patients with right-sided seizure onset (n⫽48)
No evidence of HA 10 (21%)
Unilateral HA 34 (71%)
Right HA 31 (65%)
Left HA 1 (2%)
Only asymmetry (rightⰆleft) 2 (4%)
Bilateral HA 4 (8%)
Patients with left-sided seizure onset (n⫽53)
No evidence of HA 9 (17%)
Unilateral HA 43 (81%)
Right HA 0 (0%)
Left HA 38 (72%)
Only asymmetry (rightⰆleft) 5 (9%)
Bilateral HA 1 (2%)
[image:5.585.54.285.290.435.2]seizure onset in patients with TLE has been reported in earlier studies.8,12,16Our MR imaging results support these findings and indicate that R-patients are more likely to have bilateral hippocampal atrophy than L-patients. Spearman rank corre-lation test revealed that patients with TLE showed a weaker correlation between the right and left hippocampal volume than controls, and this loss of correlation is more pronounced in L-patients than in R-patients, for whom ipsilateral hip-pocampal volume reduction seemed to be correlated with a contralateral volume reduction.
Our findings seem to support previous studies in which R-patients and L-patients showed a different process of tem-poral lobe volume reduction. In particular, Avery et al36 showed that the degree of correlation between the asymmetry index and age of onset is strongly influenced by the side of seizure onset, suggesting that right and left TLE may corre-spond to different types of epilepsy. Salmenpera¨ et al9 quanti-fied the right and left hippocampal volume reduction in a group of 145 patients with unilateral TLE. In particular, pa-tients with at least 21 years of right TLE showed an ipsilateral and contralateral hippocampal volume reduction of 29% and 7%, respectively; and patients with at least 21 years of left TLE, a reduction of 14% and 4%, respectively. Moreover, Bernas-coni et al14found a significant contralateral volume reduction of the hippocampal body in R-patients and of the hippocam-pal head in L-patients.
Pathologic studies showed that hippocampal sclerosis is often unilateral or, if bilateral, usually asymmetric.37The
de-sign and nature of these pathologic studies precluded the detection of the effects we described here. The possibility that our result is due to an interaction between lateraliza-tion of brain development and age of onset appears to be an insufficient explanation because age of onset was not sig-nificantly different between R- and L-patients. However, the cerebral hemispheres may not only differ in their func-tional organization but also in their vulnerability to any insult. Our result would suggest an increased vulnerability of the left hemisphere.
The estimation of geometric parameters of a biologic struc-ture (such as volume, surface area, length, number of neurons, etc) from the analysis of sections or projections of the structure is a problem that often arises in biomedical studies. The develop-ment of mathematic formulae and techniques relevant to this problem has led to the so-called stereologic methods, which are widely applied in several areas of biomedicine.17-22,24,35The ste-reologic methods are recognized for their easy implementation, high efficiency, and providing unbiased estimates of the parame-ters of interest on the basis of an appropriate sampling design. In particular, the stereologic Cavalieri method used here has been designed to estimate the volume of any structure regardless of its shape (eg, hippocampal volume).
There are different sources of error that may affect the vol-ume estimate. A first source of error is introduced by the Cava-lieri method and point-counting. When the shape of the hip-pocampus is irregular and convoluted, a higher sampling attenuation is required to estimate the hippocampal volume with the same precision as when it is smooth. Patients with TLE may show a more irregular hippocampus than controls; therefore, the volume estimate may be less precise for the first group.38 In this study, however, the precision of the hip-pocampal volume estimate was not significantly different among controls, R-patients, and L-patients (hippocampal vol-ume was estimated for all subjects with a coefficient of error
⬍5%). The second source of error, and probably the most important, is produced by a different way of interpretation between observers in the identification of hippocampal
Fig 6.Left hippocampal volume versus right hippocampal volume in R-patients (top left
[image:6.585.55.520.47.393.2]boundaries on MR images. Given that all observers would pre-sumably identify the same boundaries of interest under a per-fect image resolution, discrepancies between observer ratings are exclusively produced by limitations of the imaging tech-nique (ie, partial volume effects and inhomogeneities in the image intensity of the MR technique). This bias, identified by many researchers as error coming from the observer, is in reality a consequence of a nonperfect resolution of the imag-ing technique and is difficult to quantify.21
The design of a confidence interval for the right and left hippocampal volume of a patient with TLE that takes into account these sources of error would have a significant contri-bution in the diagnosis. By definition, this interval is mathe-matically designed to include the true volume with a given probability (eg, 99%). The length of the confidence interval decreases as the precision of the volume estimate increases, and its upper limit can be used as a reference value to identify hippocampal atrophy (ie, we can check whether this upper limit is below the 99% lower bound obtained from the control population). A less precise hippocampal volume estimate (ie, with a lower sampling intensity and/or MR image resolution) would produce a wider interval and, then, a less sensitive de-tection of hippocampal atrophy. A reliable classification of hippocampal atrophy would also depend on the accuracy of the 99% lower bounds in controls, and this is determined by the size and precision of the control data. Therefore, the lower bounds derived here should not be considered as absolute val-ues because they are subject to certain factors (control sample size, sampling attenuation, and MR image resolution). In par-ticular, control data obtained with less precision usually gen-erate smaller lower bounds, and significant volume reductions are then detected with more difficulty.
Conclusion
Our study indicates that although the major damage in pa-tients with TLE was produced in the hippocampus ipsilateral to the side of seizure onset, R-patients are more likely to have bilateral hippocampal atrophy than L-patients.
Acknowledgments
We thank 2 anonymous referees for their helpful suggestions. We thank Prof. Luis Cruz-Orive for his helpful comments in an earlier version of the paper and help with Fig 1. We also thank the radiographers and nursing staff at MARIARC for their assistance.
References
1. Norman RM, Sandry S, Corsellis JAN.The nature and origin of patho-anatom-ical change in the epileptic brain.In: Vinken PJ, Bruyn GW, eds.Handbook of Clinical Neurology,Vol. 15. Amsterdam, Holland: North Holland Publishing Company; 1974:611–20
2. Duncan JS.Imaging and epilepsy.Brain1997;120:339 –77
3. Babb TL, Brown WJ.Pathological findings in epilepsy.In: Engel J, ed.Surgical Treatment of the Epilepsies.New York: Raven Press; 1987:511– 40
4. Cendes F, Andermann F, Gloor P, et al.MRI volumetric measurement of amyg-dala and hippocampus in temporal lobe epilepsy.Neurology1993;43:719 –25 5. Cook MJ, Fish DR, Shorvon SD, et al.Hippocampal volumetric and
morpho-metric studies in frontal and temporal lobe epilepsy.Brain1992;115:1001–15 6. Luby M, Spencer DD, Kim JH, et al.Hippocampal MRI volumetrics and tem-poral lobe substrates in medial temtem-poral lobe epilepsy.Magn Reson Imaging
1995;13:1065–71
7. Quigg M, Bertram EH, Jackson T, et al.Volumetric magnetic resonance
imag-ing evidence of bilateral hippocampal atrophy in mesial temporal lobe epi-lepsy.Epilepsia1997;38:588 –94
8. Salmenpera¨ T, Ka¨lvia¨inen R, Partanen K, et al.Hippocampal damage caused by seizures in temporal lobe epilepsy.Lancet1998;351(9095):35
9. Salmenpera¨ T, Ka¨lvia¨inen R, Partanen K, et al.Hippocampal and amygdaloid damage in partial epilepsy: a cross-sectional MRI study of 241 patients. Epi-lepsy Res2001;46:69 – 82
10. Tasch E, Cendes F, Li LM, et al.Neuroimaging evidence of progressive neuronal loss and dysfunction in temporal lobe epilepsy.Ann Neurol1999;45:568 –76 11. Theodore WH, Bhatia S, Hatta J, et al.Hippocampal atrophy, epilepsy duration
and febrile seizures in patients with partial seizures.Neurology1999;1:132–36 12. Mackay CE, Webb J, Eldridge P, et al..Quantitative magnetic resonance in
consecutive patients evaluated for surgical treatment of temporal lobe epi-lepsy.J Magn Reson Imaging2000;18:1187–99
13. Berkovic S, Andermann F, Olivier A, et al.Hippocampal sclerosis in temporal lobe epilepsy demonstrated by magnetic resonance imaging.Ann Neurol1991; 29:175– 82
14. Bernasconi N, Bernasconi A, Caramanos Z, et al.Mesial temporal damage in temporal lobe epilepsy: a volumetric MRI study of the hippocampus, amyg-dala and parahippocampal region.Brain2003;126:462– 69
15. Keller SS, Mackay CE, Barrick TR, et al.Voxel-based morphometric compari-son of hippocampal and extrahippocampal abnormalities in patients with left and right hippocampal atrophy.Neuroimage2002;16:23–31
16. Keller SS, Wieshmann UC, Mackay CE, et al.Voxel-based morphometry of grey matter abnormalities in patients with medically intractable temporal lobe epilepsy: effects of side of seizure onset and epilepsy duration.J Neurol Neurosurg Psychiatry2002;73:648 –56
17. Light K, Roberts N, Whitehouse GH, et al.Unbiased and efficient estimation of bladder volume with MR imaging.J Magn Reson Imaging1995;5:33– 41 18. Roberts N, Puddephat M, McNulty V.The benefit of stereology for
quantita-tive radiology.Br J Radiol2000;73:679 –97
19. Cruz-Orive LM, Insausti A, Insausti R, et al.A case study from neuroscience involving stereology and multivariate analysis.In: Evans SM, Janson AM, Ny-engaard JR, eds.Quantitative Methods in Neurosciences.Oxford, UK: Oxford University Press; 2004:16 – 64
20. Doherty CP, Fitzsimons M, Holohan T, et al.Accuracy and validity of stereology as a quantitative method for assessment of human temporal lobe volumes acquired by magnetic resonance imaging.J Magn Reson Imaging2000;18:1017–25 21. Garcı´a-Fin˜ana M, Cruz-Orive LM, Mackay CE, et al.Comparison of MR
imag-ing against physical sectionimag-ing to estimate the volume of human cerebral compartments.Neuroimage2003;18:505–16
22. Schmitz C, Hof PR.Design-based stereology in neuroscience.Neuroscience
2005;130:813–31
23. Duvernoy HM.The Human Hippocampus: An Atlas of Applied Anatomy. Mu-nich, Germany: JF Bergmann Verlag; 1998
24. Howard CV, Reed MG.Unbiased Stereology: Three-Dimensional Measurement in Microscopy.Oxford, UK: Bios Sci; 1998
25. Mathieu O, Cruz-Orive LM, Hoppeler H, et al.Measuring error and sampling variation in stereology: comparison of the efficiency of various methods for planar image analysis.J Microsc1981;121:75– 88
26. Matheron G.The Theory of Regionalized Variables and Its Applications. Les Cah-iers du Centre de Morphologie Mathe´matique de Fontainebleau, No. 5.Paris, France: E´cole Nationale Supe´rieure des Mines de Paris, Fontainebleau; 1971 27. Matheron G.Les Variables Re´gionalise´es et Leur Estimation.Paris,France:
Mas-son et Cie; 1965
28. Gundersen HJ, Jensen EB.The efficiency of systematic sampling in stereology and its prediction.J Microsc1987;147:229 – 63
29. Cruz-Orive LM. On the precision of systematic sampling: a review of Matheron’ s transitive methods.J Microsc1989;153:315–33
30. Cruz-Orive LM.Systematic sampling in stereology.Bull Int Stat Inst (Proc 49th Session, Florence)1993;55:451– 68
31. Gundersen HJG, Jensen EBV, Kieˆu K, et al.The efficiency of systematic sam-pling in stereology: reconsidered.J Microsc1999;193(Pt 3):199 –211 32. Kieˆu K.Three Lectures on Systematic Geometric Sampling: Memoirs,Vol. 13. Aarhus,
Denmark: Department of Theoretical Statistics, University of Aarhus; 1997 33. Kieˆu K, Souchet S, Istas J.Precision of systematic sampling and transitive
methods.J Statist Plan Inf1999;77:263–79
34. Garcı´a-Fin˜ana M, Cruz-Orive LM.New approximations for the efficiency of Cavalieri sampling.J Microsc2000;199:224 –238
35. Baddeley A, Jensen EBV.Stereology for Statisticians.London, UK: Chapman & Hall/CRC; 2004
36. Avery RA, Zubal IG, Studholme C, et al.Interictal 99mTc-HMPAO spect in temporal lobe epilepsy: relation to clinical variables.Epilepsia2001;42:869 –74 37. Margerison JH. Corsellis JA.Epilepsy and the temporal lobes: a clinical, elec-troencephalographic and neuropathological study of the brain in epilepsy, with particular reference to the temporal lobes.Brain1966;89:499 –530 38. Hogan RE, Wang L, Bertrand ME, et al.MRI-based high-dimensional