ORIGINAL RESEARCH
Anisotropic Diffusion Properties in Infants with
Hydrocephalus: A Diffusion Tensor Imaging Study
W. Yuan F.T. Mangano E.L. Air S.K. Holland B.V. Jones M. Altaye K. Bierbrauer
BACKGROUND AND PURPOSE: Diffusion tensor imaging (DTI) can noninvasively detect in vivo white matter (WM) abnormalities on the basis of anisotropic diffusion properties. We analyzed DTI data retrospectively to quantify the abnormalities in different WM regions in children with hydrocephalus during early infancy.
MATERIALS AND METHODS:Seventeen infants diagnosed with hydrocephalus (age range, 0.13–16.14 months) were evaluated with DTI and compared with 17 closely age-matched healthy children (age range, 0.20 –16.11 months). Fractional anisotropy (FA), mean diffusivity (MD), axial diffusivity, and radial diffusivity values in 5 regions of interest (ROIs) in the corpus callosum and internal capsule were measured and compared. The correlation between FA and age was also studied and compared by ROI between the 2 study groups.
RESULTS: Infants with hydrocephalus had significantly lower FA, higher MD, and higher radial diffu-sivity values for all 3 ROIs in the corpus callosum, but not for the 2 ROIs in the internal capsule. In infants with hydrocephalus, the increase of FA with age during normal development was absent in the corpus callosum but was still preserved in the internal capsule. There was also a significant difference in the frequency of occurrence of abnormal FA values in the corpus callosum and internal capsule.
CONCLUSIONS:This retrospective DTI study demonstrated significant WM abnormalities in infants with hydrocephalus in both the corpus callosum and internal capsule. The results also showed evidence that the impact of hydrocephalus on WM was different in the corpus callosum and internal capsule.
H
ydrocephalus is a pathologic condition in which excessive CSF accumulates in the ventricular system because of ei-ther obstruction along the CSF pathways or an imbalance be-tween CSF production and reabsorption.1The enlarged ven-tricles and the associated increased intracranial pressure (ICP) can cause significant damage to various regions of brain, espe-cially to the adjacent white matter (WM) tissue.1-4The main-stay of treatment for most hydrocephalic patients has been surgical diversion of the excess CSF to a distant location in the body. Although surgical outcomes are generally good, some patients are still at risk for cognitive, motor, and physical de-velopmental delays.5-10The variability of outcomes in hydro-cephalus treated in infancy may reflect the wide spectrum of injury to specific regions of the brain and the variety of recov-ery mechanisms in the pathophysiology in these locations.Ventricular size, CSF flow, and ICP are routinely used to guide the treatment of hydrocephalus and have been the basis for diagnostic standards and attempts to predict prognosis. However, neither these nor conventional imaging modalities have been found to be completely accurate. The pathophysio-logic mechanism of brain injury has not been clearly eluci-dated, but measurement of diffusion parameters may provide insight into the mechanisms and/or reversibility of WM injury in childhood hydrocephalus.
Diffusion tensor imaging (DTI) provides quantitative in-formation about anisotropic diffusion properties in WM and has been applied to investigate in vivo WM damage and pos-sible recovery in various neurologic and pathologic disor-ders.11-13However, to our knowledge, there are very few pub-lished articles on the use of DTI in childhood hydrocephalus. Although Assaf et al14studied abnormal anisotropic diffusion properties in various WM regions before and after CSF shunt surgery, they did not include patients in early childhood, the common age of hydrocephalus presentation and treatment. In a similar fashion, in a recent DTI study by Hasan et al15of children with spina bifida and hydrocephalus, the average age of participants was 12.3⫾2.1 years, well beyond the usual age of diagnosis and treatment of childhood hydrocephalus.
In our study, we used DTI to study WM integrity in infants with hydrocephalus to assess the anisotropic diffusion prop-erties in the corpus callosum and internal capsule preopera-tively. We hypothesized that 1) these WM structures would demonstrate abnormal anisotropic diffusion values (FA, MD, axial and radial diffusivity) compared with age-matched healthy children, and 2) the abnormality would be region-specific in the direction and the degree of abnormality.
Materials and Methods
Patient Population
We retrospectively reviewed existing clinical DTI datasets and iden-tified 2 groups of participants for our study: a preshunt hydrocepha-lus group and an age-matched control group. The Institutional Re-view Board of Cincinnati Children’s Hospital Medical Center approved the study.
The preshunt hydrocephalus group consisted of 17 infants (age range, 0.03–16.14 months; age mean⫾SD, 4.65⫾4.27 months; sex ratio, 7 girls/10 boys) who were diagnosed with hydrocephalus and
Received February 23, 2009; accepted after revision on April 5.
From the Departments of Radiology (W.Y., S.K.H., B.V.J.), Neurosurgery (F.T.M., E.L.A., K.B.), and Biostatistics and Epidemiology (M.A.); Cincinnati Children’s Hospital Medical Center and University of Cincinnati College of Medicine, Cincinnati, Ohio.
had MR imaging and DTI performed before shunt surgery as part of their standard clinical care. Demographics and clinical information for these patients are summarized in Table 1. Fifteen of these patients were described as initially presenting with symptoms of accelerated head growth, macrocephaly, enlarged ventricle, or ventriculomegaly. All of the patients demonstrated clinical improvement when evalu-ated postsurgically: all demonstrevalu-ated neurologically stable examina-tion or had normal development.
The control group consisted of 17 closely age-matched children (age range, 0.20 –16.11 months; age mean⫾SD, 4.71⫾4.17 months; sex ratio, 6 girls/11 boys). These children were selected from a cohort of an ongoing project that aims to establish a frame of reference for the anisotropic diffusion properties throughout development (total
nis approximately 250, 0 –18 years old;n⫽45 for age range 0 –16 months). All of the children in the control group met the following criteria: 1) they were scanned for non-central nervous system (CNS)– related problems, 2) they had no previous record of neurologic
dis-order, 3) they had normal MR imaging results, and 4) they had no record of neurologic disorder for at least 4 months after the MR im-aging/DTI scan. Because DTI parameters usually change with age during early childhood, 3 weeks were used as the criteria for the max-imal age difference in searching for matching healthy children from the data base. We were only able to find 1 match for each child in the patient group. The age difference in these 17 pairs of children ranges from 0 to 16 days (mean⫾SD, 5.35⫾4.57 days). The 2 groups were not significantly different in age (2-tailed pairedttest;P⫽.32) or sex ratio (Fisher exact test;P⫽1).
The fronto-occipital horn ratio (FOHR) was used to assess ven-tricular size for participants in both groups. This index measures the ratio between the mean of the frontal and occipital horn width to the width of parietal lobe and has been found to correlate well with rela-tive ventricular size.16Figure 1Ashows the methodology for the
mea-surement of FOHR.
[image:2.594.53.540.59.302.2]Periventricular interstitial edema may be used as a radiologic sign
Table 1: Demographic and clinical information for pediatric patients with HCP
Pt.
No. Sex
Age Preop DTI (mo)
Age Surg
(mo) Clinical Signs/Symptoms
HCP Diagnosis
(Type/Cause) Clinical Outcome
1 M 0.03 0.13 Macrocephaly, accelerated head growth Congenital Developmentally appropriate for
age
2 F 1.81 3.04 Macrocephaly, accelerated head growth Congenital Stable with developmental delay
3 F 16.14 17.28 Accelerated head growth after repair of
myelomeningocele
Myelomeningocele Stable with decreased lower extremity movement
4 M 6.25 6.75 Accelerated head growth Peter plus syndrome Stable with developmental delay
5 M 9.60 10.30 Progressive ventriculomegaly Posttraumatic Stable with hemiparesis
6 F 4.90 5.10 Accelerated head growth after repair of
myelomeningocele
Myelomeningocele Stable with decreased lower extremity movement
7 M 1.71 2.61 Macrocephaly, accelerated head growth Communicating Stable with developmental delay
8 M 0.07 0.70 Accelerated head growth Communicating Normal development
9 M 8.02 8.96 Accelerated head growth Postmeningitis Stable with developmental delay
10 M 6.84 6.94 Accelerated head growth Dandy-Walker variant Stable neurologically
11 M 1.61 2.38 Accelerated head growth Aqueduct stenosis Stable neurologically
12 M 3.32 5.85 Downward gaze Aqueduct stenosis Stable neurologically
13 F 6.12 6.18 Accelerated head growth Quadrigeminal plate
arachnoid cyst
Normal development
14 F 3.16 3.25 Accelerated head growth Prematurity,
meningitis
Stable neurologically
15 M 0.69 1.61 Accelerated head growth Prematurity, IVH Stable neurologically
16 F 0.79 0.99 Apnea/brady, bulging fontanel Prematurity, IVH Stable neurologically
17 F 8.05 8.94 Papilledema, enlarged ventricles Achondroplasia Resolved papilledema, stable
Note:—HCP indicates hydrocephalus; DTI, diffusion tensor imaging; IVH, intraventricular hemorrhage; Preop, preoperative; Surg, surgery.
Fig 1.A, The measurement and calculation of the FOHR are demonstrated on an axial section of T1-weighted MR imaging study from a child with hydrocephalus in the preshunt group. B, Histogram showing that children in the control group demonstrate a narrow range (0.29⬃0.37) in the FOHR, whereas children in the patient group have a distinct range of distribution of the ratio (0.40⬃0.65).
PEDIATRICS
ORIGINAL
[image:2.594.135.450.328.485.2]of acute and severe hydrocephalus in children. In our study, only 3 infants with hydrocephalus were found to have abnormal periven-tricular T2 or fluid-attenuated inversion recovery signals. The num-ber was not sufficient to conduct any statistical comparison and was therefore not examined further. The relative higher water content in young infants may contribute to the low incidence of detectable in-terstitial edema in periventricular WM in our patient population.
MR Imaging/DTI Scan
All of the MR imaging/DTI scans were performed at Cincinnati Chil-dren’s Hospital Medical Center between October 2003 and May 2008. Images were acquired clinically either on a 3T Magnetom Trio ner (Siemens, Erlangen, Germany) or a 1.5T Signa Horizon LX scan-ner (GE Healthcare, Milwaukee, Wis). All of the DTI images were acquired with diffusion-weighted, spin-echo echo-planar imaging in the axial plane with a b-value of 1000 s/mm2. In the 17 infants with
hydrocephalus, 3 infants were scanned on the 3T Siemens scanner with a 12-direction DTI protocol: TR, 6000 ms; TE, 87 ms; resolution, 2⫻2 mm; and section thickness, 2 mm. The other 14 patients were scanned on a 1.5T GE scanner with a 15-direction DTI protocol: TR, 12,000 ms; TE, 81 to 101ms; and resolution, 3⫻3 mm (n⫽11) or 1.88⫻1.88 mm (n⫽3). In the 17 age-matched control subjects, the parameters were even more inhomogeneous, perhaps because of the variety of protocols used for these children who were referred for MR imaging scanning for more diverse reasons. Of the 17 healthy chil-dren, 9 were scanned on the 3T Siemens scanner. Among them, 6 were scanned with a 12-direction DTI protocol: TR, 6000 ms; TE, 87 ms; resolution, 2⫻2 mm; and section thickness⫽2 mm. The other 3 healthy children were scanned on the 3T scanner with a 6-direction DTI protocol: TR, 4100 or 5300 ms; TE, 84 ms; resolution, 1.56⫻1.56 mm (n⫽1) or 1.72⫻1.72 (n⫽2); and section thickness, 4 mm (n⫽
2) or 3 mm (n⫽1). Of the 17 healthy children, 8 were scanned on a 1.5T GE scanner: gradient directions, 15; TR, 12,000 ms; TE, 66 to 97 ms; resolution, between 2.5⫻2.5 and 3⫻3 mm; and section thick-ness, 3 mm. A matrix of 128⫻128 was used for all patients. The differences in the DTI scan protocols were because of the occasional adjustment in clinical scanning for image quality optimization.
We also conducted a variance ratio test for each pair on the basis of
the observed SD and corresponding degree of freedom, with the goal to examine whether there was a systemic image quality bias for the FA value measurement. The number of pairs that demonstrate signifi-cant difference at aPlevel of .05 was found to be small (2/16, 1/7, 1/14, 0/17, and 2/17 for the 5 respective ROIs, respectively). An additional analysis of the effect of field strength and protocol variations on the measured diffusion values found no statistically significant differ-ences for any of the ROIs tested and did not affect the results and conclusion of this study. This issue has been elaborated and discussed elsewhere.17
Data Processing
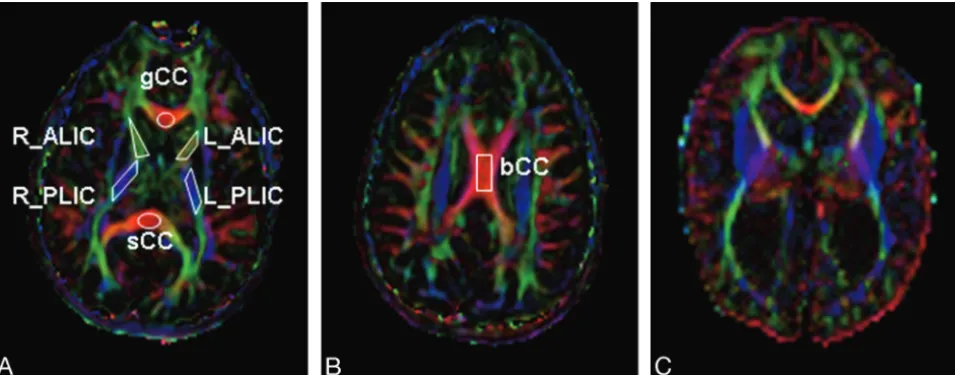
Image reconstruction, postprocessing, and ROI-based DTI parameter calculations were performed with the software DTIStudio 2.4 soft-ware.18On a pixel-by-pixel basis, the 6 elements (Dxx, Dyy, Dzz, Dxy,
Dxz, and Dyz) were calculated and diagonalized to calculate the 3 eigenvalues (1,2,3) corresponding to the 3 eigenvectors in the
diffusion tensor matrix. We calculated the FA map using the follow-ing formula19,20:
The mean diffusivity (MD) was calculated as the mean of the 3 eigenvalues (MD⫽(1⫹2⫹3)/3). Two specific eigenvalue
indi-ces,储(⫽1) and⬜(⫽(2⫹3)/2) that represent diffusion proper-ties along axial and radial directions, respectively, are also studied.
[image:3.594.58.536.43.230.2]in our previous work.22In both ALIC and PLIC, because we did not
find statistically significant differences between the left and the right side, we used the average DTI value in the analysis. Anatomic distor-tion caused by hydrocephalus made some ROIs undefinable in some patients. The corpus callosum is expected to be thinner in hydroceph-alus. Because the ROIs were all defined on axial images, partial vol-ume effect is likely to occur when CSF is included in the delineation of a very thin bCC. To minimize the potential impact, we determined that the bCC of a patient would be excluded from analysis if the corpus callosum (measured on sagittal T1 images) was thinner than the section thickness (mean⫾SD, 3.6⫾0.65 mm after excluding bCC measurements in 7 patients with hydrocephalus).
Statistical Analysis
We performed statistical analysis using SPSS, version 15 (SPSS, Chi-cago, Ill). The statistical differences between the 17 children with hy-drocephalus and their age-matched control subjects were tested with the pairedttest on all the DTI parameters in various ROIs. To control for the expected proportion of incorrectly rejected null hypotheses (type I error rate) in multiple comparison, we made a correction for multiple comparisons using the false discovery rate method.23
As reported in the literature,21,24,25the developmental trajectory
of FA in healthy children can often be modeled by a monoexponential or a biexponential curve. The most drastic increase in values occurs in the first 24 months of life, with the values leveling off and stabilizing before 36 months. The maximal age in our study group was 16 months, and the full age-range over which the normal curve occurs was not represented in this cohort and curve fitting with use of an exponential model was not appropriate. Therefore, the increase of FA with age was fitted with a linear model. The 95% prediction interval was also calculated.
For each ROI, the value of FA was objectively determined to be abnormally high, normal, or abnormally low on the basis of whether the DTI index was above, within, or below the prediction interval at 95% confidence level as derived from the regression analysis in the normal group. The termfrequency of occurrenceis used to reflect how
often the abnormal DTI measurement occurs in a certain cohort. It is equivalent to the percentage of individuals who can be categorized to a certain subgroup. The Freeman-Halton extension26for the Fisher
exact test was used to evaluate the 2⫻3 contingency table and to assess the statistical significance (at a level ofP⫽.05) of the different frequency of occurrence in abnormal FA either across ROIs or across subject groups.
Results
Comparing FOHR between Infants with Hydrocephalus and Age-Matched Control Subjects
The FOHR for the control group followed a normal distribu-tion, with a range from 0.285 to 0.374 (mean⫾SD, 0.336⫾ 0.023, Fig 1B). The FOHR of the patients with hydrocephalus (range, 0.395– 0.648; mean ⫾SD, 0.530 ⫾0.065) demon-strated a wider range of values, with the minimum close to the maximum ratio seen in the control group (pairedttest,P⬍ .0001). No statistically significant correlation was found be-tween FOHR and DTI parameters in any of the 5 ROIs examined.
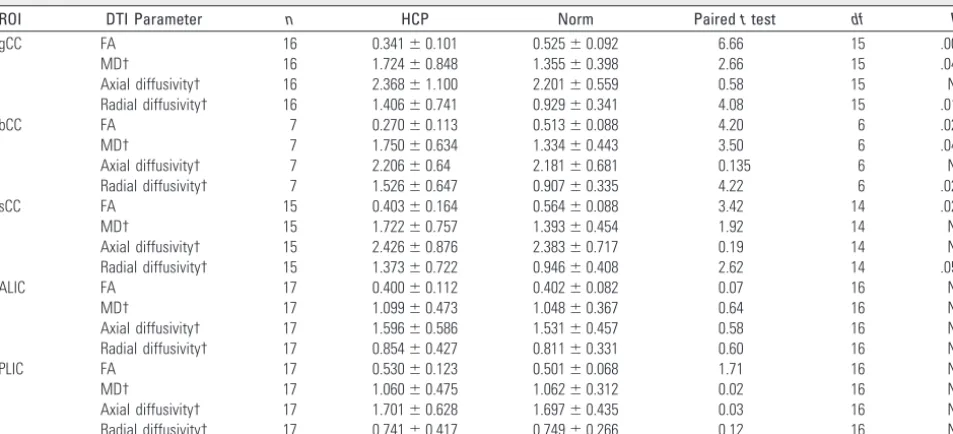
Comparison of DTI Parameters between Infants with Hydrocephalus and Age-Matched Control Subjects FA, MD, axial diffusivity, and radial diffusivity values for the 2 study groups are presented in Table 2.
[image:4.594.55.532.56.273.2]FA values in the corpus callosum in children with hydro-cephalus were significantly lower than that in age-matched control subjects in all 3 ROIs (2-tailed pairedttest controlled for multiple comparison,P⬍.003,P⬍.03, andP⬍.03 for gCC, bCC, and sCC, respectively). MD values in the 3 ROIs in children with hydrocephalus were all higher than those in age-matched control subject. This difference was statistically sig-nificant in the gCC (P⬍.05) and bCC (P⬍.05); the difference in the splenium showed a trend but did not reach statistical significance (P⫽.17). No statistically significant differences in Table 2: Comparison of DTI parameters between children with HCP and age-matched control subjects
ROI DTI Parameter n HCP Norm Pairedttest df P
gCC FA 16 0.341⫾0.101 0.525⫾0.092 6.66 15 .002*
MD† 16 1.724⫾0.848 1.355⫾0.398 2.66 15 .049*
Axial diffusivity† 16 2.368⫾1.100 2.201⫾0.559 0.58 15 NS
Radial diffusivity† 16 1.406⫾0.741 0.929⫾0.341 4.08 15 .010*
bCC FA 7 0.270⫾0.113 0.513⫾0.088 4.20 6 .023*
MD† 7 1.750⫾0.634 1.334⫾0.443 3.50 6 .043*
Axial diffusivity† 7 2.206⫾0.64 2.181⫾0.681 0.135 6 NS
Radial diffusivity† 7 1.526⫾0.647 0.907⫾0.335 4.22 6 .028*
sCC FA 15 0.403⫾0.164 0.564⫾0.088 3.42 14 .027*
MD† 15 1.722⫾0.757 1.393⫾0.454 1.92 14 NS
Axial diffusivity† 15 2.426⫾0.876 2.383⫾0.717 0.19 14 NS
Radial diffusivity† 15 1.373⫾0.722 0.946⫾0.408 2.62 14 .050*
ALIC FA 17 0.400⫾0.112 0.402⫾0.082 0.07 16 NS
MD† 17 1.099⫾0.473 1.048⫾0.367 0.64 16 NS
Axial diffusivity† 17 1.596⫾0.586 1.531⫾0.457 0.58 16 NS
Radial diffusivity† 17 0.854⫾0.427 0.811⫾0.331 0.60 16 NS
PLIC FA 17 0.530⫾0.123 0.501⫾0.068 1.71 16 NS
MD† 17 1.060⫾0.475 1.062⫾0.312 0.02 16 NS
Axial diffusivity† 17 1.701⫾0.628 1.697⫾0.435 0.03 16 NS
Radial diffusivity† 17 0.741⫾0.417 0.749⫾0.266 0.12 16 NS
Note:—ROI indicates region of interest;df, degrees of freedom; gCC, genu of the corpus callosum; FA, fractional anisotropy; MD, mean diffusivity; bCC, body of the corpus callosum; sCC, splenium of the corpus callosum; ALIC, anterior limb of the internal capsule; PLIC, posterior limb of the internal capsule; NS, not significant.
axial diffusivity were demonstrated for any ROI in the corpus callosum between the 2 groups. In contrast, all 3 ROIs in the corpus callosum showed significantly higher radial diffusivity in patients compared with age-matched control subjects (P⬍ .03,P⬍.03, andP⫽.05 for gCC, bCC, and sCC, respectively). No statistical difference in mean DTI parameters was found between the 2 groups for either the ALIC or PLIC.
Correlation between FA and Age
Figure 3 shows the linear regression between FA and age for sCC (Fig 3A) and PLIC (Fig 3B). In general, FA values of chil-dren in the control group increased with age in all 5 ROIs, consistent with the published literature.21,24,25Within the age range in our study, this increase followed a linear pattern with statistical significance in healthy children for all ROIs (P⬍ .001). The curve-fitting coefficients and the other statistical results are listed in Table 3.
This significant linear correlation between FA and age was not observed in children with hydrocephalus in any of the 3 ROIs in the corpus callosum (Table 3). However, FA and age still correlated highly in children with hydrocephalus in both the ALIC and PLIC. For example, FA values of patients in PLIC (Fig 3B) correlated significantly with age (R2⫽0.549;P⫽ .002). Comparison of residuals from the linear regression found that both groups were unbiased, with a mean value of zero. No increasing or decreasing spread about the regression line was observed as the age increased for any of the ROIs.
The Frequency of Occurrence of Abnormal FA Values in Children with Hydrocephalus
In the corpus callosum, most patients had abnormally low FA values (13/16, 8/10, and 9/15, for gCC, bCC, and sCC, respec-tively). No child with hydrocephalus was found to have an abnormally high FA value. In the internal capsule, however, only a small portion of the group had abnormally low FA values (2/17 for both ALIC and PLIC), and some had abnor-mally high FA values (2/13 and 6/17 for ALIC and PLIC, re-spectively), which was not observed in the corpus callosum. Figure 4 demonstrates the regional difference of the frequency of abnormal FA between the corpus callosum and the internal capsule. The difference is statistically significant (P⬍.01, with control for multiple comparison) when comparing a ROI in the corpus callosum (gCC, bCC, or sCC) with any ROI in the internal capsule (ALIC or PLIC). On the other hand, no sta-tistical significance was observed between any 2 ROIs within either the corpus callosum or the internal capsule.
Discussion
[image:5.594.62.524.45.190.2]This is the first DTI study of WM abnormalities in children with hydrocephalus during early infancy. Previously pub-lished reports have used DTI to examine the effects of hydro-cephalus on WM in older children or in young adults.14,15In our study, the study population ranged from ages 1 day to 16 months at the time of the pretreatment MR imaging/DTI study. Thus, it fills a knowledge gap and provides a radio-graphic reflection of the understanding for the effects of hy-Fig 3.A, sCC.B, PLIC. Scatterplots of FA fitted to a linear model (solid line) in healthy children and in children with hydrocephalus (regression line not shown). The 95% prediction intervals are shown in dashed lines representing age-specific range in which a normal value is supposed to be at 95% certainty.
Table 3: Results of linear regression between the value of DTI parameters and age
ROI Group Linear Regression R2 P
Error Mean
Error SD
gCC Norm Y⫽0.019X⫹0.438 0.79 .0010* 0 0.04
HCP Y⫽0.010X⫹0.294 0.21 NS 0 0.09
bCC Norm Y⫽0.016X⫹0.446 0.67 .0005* 0 0.05
HCP Y⫽0.005X⫹0.310 0.03 NS 0 0.15
sCC Norm Y⫽0.017X⫹0.486 0.69 .0003* 0 0.05
HCP Y⫽0.008X⫹0.365 0.05 NS 0 0.16
ALIC Norm Y⫽0.016X⫹0.326 0.66 .0003* 0 0.05
HCP Y⫽0.014X⫹0.333 0.30 .0314* 0 0.09
PLIC Norm Y⫽0.014X⫹0.437 0.72 .0002* 0 0.04
HCP Y⫽0.021X⫹0.431 0.55 .0017* 0 0.08
*Pvalue is adjusted for multiple testing with the false discovery rate method.
[image:5.594.303.534.231.355.2] [image:5.594.51.285.248.377.2]drocephalus on developing WM. The sensitivity of DTI to as-sess WM diffusion properties in patients with hydrocephalus as demonstrated in our study potentially may help determine whether shunt surgery would be of benefit in borderline ven-triculomegaly and benign external hydrocephalus or augment the fetal counseling process for parents. It may also aid in the management of shunted hydrocephalus used at present, al-lowing a more accurate assessment of structural integrity than the volume measurements used at present.
We included a closely age-matched healthy control group to establish a frame of reference for determining the normality of diffusion properties in patient group. The age difference between the 17 pairs of children ranged from 0 to 16 days. Such a close matching was intended to eliminate the con-founding factor of age because DTI parameters have been found to change dramatically during early childhood.24,25,27 Any study of WM in pediatric patients must account for this dramatic change occurring during development, especially the first 36 months of life, to reach any conclusion about patho-logic alterations.
Our results demonstrate that the DTI parameters in the corpus callosum in infants with hydrocephalus are abnormal, and this deviation from normal range is region specific. Sim-ilar to previous studies in older subjects,14 we found that the corpus callosum in the patients had lower FA and higher MD values. We also found that radial diffusivity in all of the ROIs in the corpus callosum increased significantly, which can explain the above 2 changes. In addition, the correlation of FA with age during normal development seen in our control group and in other studies24,25,27 was absent in the corpus callosum in children with hydrocephalus. Furthermore, no increasing or decreasing spread about the regression line was observed as the age increased for any of the ROIs, sug-gesting that WM development does not follow a normal tra-jectory in children with hydrocephalus in regions closest to the ventricles.
In the internal capsule, the mean FA value or other DTI parameters for children with hydrocephalus was not found to be abnormal in either ALIC or PLIC. The trend of linearly increasing of FA with age was also preserved, which may indi-cate a normal developmental pattern in this brain area. How-ever, further examination demonstrated that, though FA in most patients with hydrocephalus fell within the age-appro-priate normal range, there was a greater degree of variability of values in the patient group, with some patients exhibiting ab-normally higher FA values and some others having abnor-mally low FA values. In PLIC, the abnorabnor-mally high FA values are found mostly in infants older than 3 months, which is in line with the study by Assaf14of older children with hydro-cephalus. Extrapolating from the observations presented in Fig 4, we found that the frequency of occurrence of abnormal-ities was region specific (ie, FA in patients with hydrocephalus is more often low in the corpus callosum but high in the inter-nal capsule). We can hypothesize that the impact of hydro-cephalus is region specific and is likely related to the proximity to the enlarged ventricles. WM structures located farther away from the ventricles, such as the internal capsule, will exhibit less severe damage because the effect is dampened by the in-tervening compressible deep gray matter and WM structures. No statistically significant correlation was found between
FA and ventricle size. It is believed that there is a wide range of variability in the association between ventricle size and out-comes. Different underlying injury mechanisms may contrib-ute to different FA measurements. The increase of FA as seen in the internal capsules of some patients has been sometimes suggested to be the result of the mechanical compression that leads to increased homogeneity in fiber orientation. The de-crease of FA in the corpus callosum, on the other hand, is often regarded as a reflection of permanent WM damage (eg, myelin sheath and axonal cell membrane damage, or demyelination). This latter hypothesis correlates with our observation of in-creased radial diffusivity in the corpus callosum. However, without knowing the exact underlying mechanism of injury, it is difficult to predict whether ventricle size and FA are in-versely or positively correlated.
Discrepancy between the results from our study and pub-lished literature exists in various parameters and in various ROIs. For example, increased diffusion coefficient in patients with hydrocephalus has been identified with previous DWI and DTI studies.14,28-30 Our study demonstrates a similar trend of MD change in the corpus callosum but not in the internal capsule. The variability in the FA value in the internal capsule seen in our study is also different from other results.14 These differences may be the result of variations in ROI selec-tion. For example, the study by Ulug˘ et al28defined ROIs ad-jacent to the ventricular horns, which does not correlate with the ROIs in our study. In addition, our cohort included ex-tremely young patients, with rapidly changing WM water con-tent, myelination, and axonal membrane growth in the brain. The difference one may expect during this time of WM devel-opment, compared with older children and adolescents, bears significant importance because it may demonstrate the diverse nature of the mechanism of injury seen in hydrocephalus de-pending on the time during development when this insult has occurred.
Conclusions
This study demonstrated the sensitivity of DTI techniques to investigate WM integrity in pediatric patients with hydro-cephalus in infancy. We found significant alterations in diffu-sion values throughout the corpus callosum in infants with hydrocephalus. In the internal capsule, there was a greater degree of variability in FA values, though FA in most patients fell within the age-appropriate normal range. It is anticipated that DTI may be of value in the management of hydrocepha-lus, possibly helping to predict long-term outcome on the ba-sis of pretreatment WM diffusion properties.
References
1. Del Bigio MR.Neuropathological changes caused by hydrocephalus.Acta Neuropathologica1993;85:573– 85
2. Del Bigio MR, da Silva MC, Drake JM, et al.Acute and chronic cerebral white matter damage in neonatal hydrocephalus.Can J Neurol Sci1994;21:299 –305 3. Del Bigio MR, Wilson MJ, Enno T.Chronic hydrocephalus in rats and humans: white matter loss and behavior changes.Ann Neurol2003;53:337– 46 4. Khan OH, Enno TL, Del Bigio MR.Brain damage in neonatal rats following
kaolin induction of hydrocephalus.Exp Neurol2006;200:311–20
5. Hirsch JF.Surgery of hydrocephalus: Past, present and future.Acta Neuro-chirurgica1992;116:155– 60
6. Baron IS, Goldberger E.Neuropsychological disturbances of hydrocephalic children with implications for special education and rehabilitation. Neuro-psychol Rehab1993;3:389 – 410
7. Dennis M, Fitz CR, Netley CT, et al.The intelligence of hydrocephalic children.
Arch Neurol1981;38:607–15
8. Donders J, Rourke BP, Canady AI.Neuropsychological functioning of hydro-cephalic children.J Clin Exp Neuropsychol1991;13:607–13
9. Fernell E, Gillberg C, vonWendt L.Behavioural problems in children with infantile hydrocephalus.Dev Med Child Neurol1991;33:388 –95
10. Fletcher JM, Bohan TP, Brandt ME, et al.Cerebral white matter and cognition in hydrocephalic children.Arch Neurol1992;49:818 –24
11. Werring DJ, Clark CA, Barker GJ, et al.Diffusion tensor imaging of lesions and normal-appearing white matter in multiple sclerosis.Neurology1999;52: 1626 –32
12. Zelaya F, Flood N, Chalk JB, et al.An evaluation of the time dependence of the anisotropy of the water diffusion tensor in acute human stroke.Magn Reson lmag1999;17:331– 48
13. Lim KO, Hedehus M, Moseley M, et al.Compromised white matter tract in-tegrity in schizophrenia inferred from diffusion tensor imaging.Arch Gen Psychiat1999;56:367–74
14. Assaf Y, Ben-Sira L, Constantini S, et al. Diffusion tensor imaging in hydrocephalus: initial experience.AJNR Am J Neuroradiol2006;27:1717–24 15. Hasan KM, Eluvathingal TJ, Kramer LA, et al.White matter microstructural
abnormalities in children with spina bifida myelomeningocele and hydro-cephalus: A diffusion tensor tractography study of the association pathways.J Magn Reson Imaging2008;27:700 – 09
16. O’Hayon BB, Drake JM, Ossip MG, et al.Frontal and occipital horn ratio: A linear estimate of ventricular size for multiple imaging modalities in pediatric hydrocephalus.Pediatr Neurosurg1998;29:245– 49
17. Yuan W, Holland SK, Jones BV, et al.Characterization of abnormal diffusion properties of supratentorial brain tumors: a preliminary diffusion tensor im-aging study.J Neurosurg Pediatr2008;1:263– 69
18. Jiang H, van Zijl PC, Kim J, et al.DTIStudio: resource program for diffusion tensor computation and fiber bundle tracking.Comput Methods Programs Biomed2006;81:106 –16
19. Basser PJ, Pierpaoli C.Microstructural and physiological features of tissues elucidated by quantitative-diffusion-tensor MRI.J Magn Reson B1996;111: 209 –19
20. Pierpaoli C, and Basser PJ.Toward a quantitative assessment of diffusion an-isotropy.Magn Reson Med1996;36:893–906
21. Hermoye L, Saint-Martin C, Cosnard G, et al.Pediatric diffusion tensor imaging: normal database and observation of the white matter maturation in early childhood.Neuroimage2006;29:493–504
22. Yuan W, Holland SK, Schmithorst VJ, et al.Diffusion tensor MR imaging re-veals persistent white matter alteration after traumatic brain injury experi-enced during early childhood.AJNR Am J Neuroradiol2007;28:1919 –25 23. Benjamini Y, Hochberg Y.Controlling the false discovery rate: a practical and
powerful approach to multiple testing.J Roy Statist Soc Ser. B1995;57:289 –300 24. Mukherjee P, Miller JH, Shimony JS, et al.Normal brain maturation during childhood: developmental trends characterized with diffusion-tensor MR im-aging.Radiology2001;221:349 –58
25. Neil J, Miller J, Mukherjee P, et al.Diffusion tensor imaging of normal and injured developing human brain—a technical review.NMR Biomed2002;15: 543–52
26. Freeman GH, Halton JH.Note on exact treatment of contingency, goodness of fit and other problems of significance.Biometrika1951;38:141– 49 27. Mukherjee P, Miller JH, Shimony JS, et al.Diffusion-tensor MR imaging of
gray and white matter development during normal human brain maturation.
AJNR Am J Neuroradiol2002;23:1445–56
28. Ulug˘ AM, Truong TN, Filippi CG, et al.Diffusion imaging in obstructive hy-drocephalus.AJNR Am J Neuroradiol2003;24:1171–76
29. Corkill RG, Garnett MR, Blamire AM, et al.Multi-modal MRI in normal pres-sure hydrocephalus identifies pre-operative haemodynamic and diffusion co-efficient changes in normal appearing white matter correlating with surgical outcome.Clin Neurol Neurosurg2003;105:193–202