ORIGINAL RESEARCH
Association of White Matter Hyperintensity
Measurements on Brain MR Imaging with
Cognitive Status, Medial Temporal Atrophy,
and Cardiovascular Risk Factors
J. Appel E. Potter N. Bhatia Q. Shen W. Zhao M.T. Greig A. Raj W.W. Barker H. Potter E. Schofield Y. Wu D.A. Loewenstein R. Duara
BACKGROUND AND PURPOSE: White matter hyperintensities (WMHs) are frequently characterized as markers of cerebrovascular disease, whereas medial temporal atrophy (MTA) is a recognized marker of Alzheimer disease (AD). Our purpose was to test the reliability of a visual rating system (VRS) in evaluating WMHs and MTA and in distinguishing healthy from cognitively impaired subjects. MATERIALS AND METHODS: Subjects (n⫽192) enrolled in the Florida Alzheimer’s Disease Research Center were diagnosed with no cognitive impairment, nonamnestic mild cognitive impairment (na-MCI), amnestic MCI (a-(na-MCI), or probable AD. The severity of WMHs was assessed on T2-weighted fluid-attenuated inversion recovery axial MR images, and the severity of MTA was evaluated on 1.5-mm-thick coronal MR images by using a computer-based visual rating system. Cardiovascular risk factor scores were calculated as the sum of 10 independent cardiovascular risk factors.
RESULTS: WMH and MTA scores were greater in subjects with probable AD, relative to those with no cognitive impairment and na-MCI. MTA scores differentiated subjects with a-MCI from those with no cognitive impairment and na-MCI. The total WMH score was significantly related to MTA (r⫽0.39;P⬍ .001) but not to cardiovascular risk factor scores (r⫽0.07;P⫽not significant). The overall correct classification rate of probable AD versus no cognitive impairment by using MTA scores was 81.8%, improving to 86.5% when combined with WMH scores.
CONCLUSIONS:Both MTA and WMH scores distinguished subjects with no cognitive impairment and probable AD. Combining MTA and WMH scores improved the correct classification rate, whereas WMH scores were significantly related to MTA scores, but not to cardiovascular risk factor scores. This finding suggests that among subjects with a-MCI and probable AD, WMHs on MR images are primarily associated with neurodegenerative disease.
T
he presence of white matter hyperintensities (WMHs), ob-served as bright foci on T2-weighted MR images,1occurs commonly among elderly cognitively healthy subjects and in those with mild cognitive impairment (MCI) and a variety of dementias, including Alzheimer disease (AD).2-6The etiology of these WMHs has most frequently been ascribed to normal aging and cerebrovascular disease, even among subjects with dementia diagnosed with probable Alzheimer disease.6,7 There is growing evidence, however, that neurodegeneration or associated processes, such as gliosis, microglial infiltration, inflammation, and amyloid angiopathy, may also result in WMHs.8-13The pathologic process characteristic of AD begins in the medial temporal structures, and the attenuation of this pa-thology has a proportional effect on the degree of atrophy in these structures (especially the hippocampus and entorhinal cortex).14Medial temporal atrophy (MTA) can be identified accurately from MR images and correlates with the severity of AD-related neuropathologic changes at autopsy.15The sever-ity of MTA can serve as a substitute for the seversever-ity of AD and other degenerative pathology in the medial temporal lobe.16-18 We have developed a computer-assisted visual rating sys-tem (VRS) that uses drop-down reference images to illus-trate the anatomy and demonsillus-trate different levels of atrophy of medial temporal structures.19,20This system has high inter-rater and intrainter-rater reliability and distinguishes subjects with no cognitive impairment from those with amnestic MCI (a-MCI) and probable AD purely on the basis of measure-ments of MTA.19,20We have now adjusted the VRS so that procedures analogous to those used for MTA measurements can be used to rate WMHs in the periventricular and centrum semiovale regions of the brain.
In this study, we tested inter- and intrarater reliability of the VRS in evaluating WMHs in the periventricular and cen-trum semiovale regions. We also examined the ability of VRS-WMH ratings to distinguish subjects diagnosed with no cognitive impairment, nonamnestic mild cognitive impair-ment (na-MCI), a-MCI, and probable AD, among 192 sub-jects enrolled in the Florida Alzheimer’s Disease Research Center. Recent studies have linked cerebrovascular risk factors such as diabetes,21coronary heart disease,22and stroke23with
Received January 26, 2009; accepted after revision May 4.
From the Wien Center for Alzheimer’s Disease and Memory Disorders (J.A., E.P., N.B., Q.S., M.T.G., W.W.B., D.A.L., R.D.) and Department of Radiology (J.A.), Mount Sinai Medical Center, Miami Beach, Fla; Department of Biomedical Engineering (Q.S., W.Z.), University of Miami, Miami, Fla; Departments of Psychiatry and Behavioral Sciences (D.A.L., R.D.) and Medicine and Neurology (R.D.), Miller School of Medicine, University of Miami, Miami, Fla; Johnnie B. Byrd, Sr. Alzheimer’s Center and Research Institute (A.R., H.P., E.S., Y.W., D.A.L., R.D.), Departments of Molecular Medicine (H.P.) and Neurology (A.R., R.D.), and College of Arts and Sciences (E.S., Y.W.), University of South Florida, Tampa, Fla. This research was supported the National Institute on Aging, National Institutes of Health, Bethesda, Md (1P50 AG025711-01), and a grant from the Johnnie B. Byrd, Sr. Alzheimer’s Center and Research Institute, Tampa, Fla. Mount Sinai Medical Center, Miami Beach, Fla., provided financial support for this study.
Please address correspondence to Ranjan Duara, MD, Wien Center for Alzheimer’s Disease and Memory Disorders, Mount Sinai Medical Center, 4300 Alton Rd, Miami Beach, FL 33140; e-mail: [email protected]
a-MCI, which is a known precursor of AD.24We assessed the associations between WMHs, MTA, and cardiovascular risk factor so as to obtain clues about the possible etiology of WMHs.4We also assessed whether WMHs were additive with MTA ratings in correctly classifying diagnostic groups, such as healthy patients and those with a-MCI and probable AD. The purpose of this study was to test the reliability of the VRS in evaluating WMHs and to test the ability of combined MTA and WMHs assessed by the VRS in distinguishing healthy and cognitively impaired subjects.
Materials and Methods
Subject Recruitment.Subjects (N⫽192) were recruited during a period of 3 years into the Florida Alzheimer’s Disease Research Center Clinical Core in Miami and Tampa, Fla, through advertisements, health fairs, community memory screening programs, and memory disorder clinics. The Mount Sinai Medical Center and the University of South Florida Institutional Review Boards approved this study, and all subjects or a legal representative gave informed consent.
Subject Evaluation.All subjects in this study received the follow-ing evaluations: 1) full clinical history; 2) neurologic assessment; and 3) the Mini-Mental State Examination (MMSE)25(an MMSE score of ⱖ18 was required for eligibility4); a neuropsychological test battery,26 which included the Clinical Dementia Rating scale27according to National Alzheimer’s Coordinating Center (NACC) protocol (http:// www.alz.washington.edu/); the Three Trial Fuld Object-Memory Evaluation28; the Hopkins Verbal Learning Test29; and the Stroop Color and Word Test.30
Diagnostic Classification.The Florida Alzheimer’s Disease Re-search Center consensus diagnosis followed the NACC protocols. The probable AD diagnosis was made according to National Institute of Neurological and Communicative Disorders and Stroke and the Alz-heimer’s Disease and Related Disorders Association (NINCDS-ADRDA) criteria for Alzheimer disease.31The a-MCI diagnosis was made according to the criteria of Petersen et al.32The diagnosis of no cognitive impairment required that informants report “no significant decline in cognition” and that no cognitive test scores were more than 1.5 SD below age- and education-corrected means. The na-MCI di-agnosis required that no memory test score be more than 1.5 SD below education-corrected normative values but that 1 or more non-memory test score be greater than 1.5 SD below normative values.
MR Imaging Procedures
Siemens Symphony 1.5T.Brain MR imaging scans were obtained on a Symphony 1.5T scanner (Siemens, Erlangen, Germany) by using a proprietary 3D magnetization-prepared rapid acquisition of gradi-ent echo (3D MPRAGE) protocol. Images were obtained from the vertex of the skull to the foramen magnum and from the occipital poles to the temporal poles. Specifications for 3D MPRAGE were the following: 120 contiguous coronal sections with a 1.5-mm gap in thickness; section interval, 0.75 mm; TR, 2190 ms; TE, 4.38 ms; TI, 1100 ms; FA, 15°; NEX, 1; matrix, 256⫻256; FOV, 260 mm; band-width, 130 Hz/pixel; acquisition time, 9 minutes; phase-encoding direction, right to left. MTA was evaluated by atrophy rating of the hippocampus, entorhinal cortex, and the perirhinal cortex on a coro-nal section intersecting the mamillary bodies.
For WMH assessment, images were obtained by using a fluid-attenuated inversion recovery (FLAIR) turbo spin-echo protocol. Images were obtained from the vertex of the skull to the foramen magnum. Specifications for FLAIR sequences were the following: 20
contiguous axial sections of 5.5-mm thickness; section interval, 1.9 mm; TR, 9000 ms; TE, 109 ms; TI, 2500 ms; flip of preparation pulse, 150°; echo-train length, 19; NEX, 1; matrix, 144⫻256; FOV, 230 mm; phase FOV, 75%; distance factor, 35%; bandwidth, 130 Hz/ pixel; acquisition time, 2–3 minutes; phase-encoding direction, right to left.
GE 3T Signa HDX.Brain MR images were obtained on a 3T Signa HDX (GE Healthcare, Milwaukee, Wis) by using a proprietary 3D fast-spoiled gradient (FSPGR) magnetization-prepared protocol. Images were obtained from the vertex of the skull to the foramen magnum and from the occipital poles to the temporal poles. Specifi-cations for 3D FSPGR were the following: 140 contiguous coronal sections of 1.2-mm thickness; contiguous images with no section in-terval; TR, 7.8 ms; TE, 3.0 ms; inversion recovery preparation time, 450 ms; flip angle, 12°; NEX, 1; matrix, 256⫻256; FOV, 240 mm; bandwidth, 31.25 Hz/pixel; acquisition time, 6 –7 minutes; phase-encoding direction, right to left.
For WMH assessment, images were obtained by using an axial T2-weighted FLAIR fast spin-echo protocol. Images were obtained from the vertex of the skull to the foramen magnum. Specifications for FLAIR sequences were the following: 20 contiguous axial sections of 5.0-mm thickness; section interval, 1.0 mm; TR, 9500 ms; TE, 120 ms; TI, 2250 ms; flip to projection pulse, 90°; NEX, 1; matrix, 352⫻224; FOV, 240 mm; phase FOV, 75%; bandwidth, 130 Hz/pixel; acquisition time, 3 minutes; phase-encoding direction, right to left.
VRS in Assessing MTA.We developed the VRS to promote stan-dardization, increase reliability, and prevent reliability drift among raters for a semiquantitative visual rating of various radiologic fea-tures of interest on brain MR images.19VRS uses a 0 – 4 scale to rate atrophy of the medial temporal lobe structures, including the hip-pocampus, entorhinal cortex, and perirhinal cortex as follows: 0⫽no atrophy, 1⫽minimal atrophy, 2⫽mild atrophy, 3⫽moderate atrophy, 4⫽severe atrophy. The VRS program includes drop-down menus linked to reference images that visualize the anatomy of the brain structures and provide examples of different levels of atrophy or abnormality of radiologic features based on a scale of 0 – 4. After the rater determines ratings by comparing MR images to VRS reference images, the program provides a data base in which VRS ratings are catalogued and stored. VRS also provides a training module that con-tains a series of normal and abnormal findings on scans, which can be rated and compared with the reference ratings. This feature provides feedback to the rater and improves the accuracy and reliability of VRS data.19We have previously reported that MTA ratings distinguish subjects with probable AD from those with a-MCI and those with a-MCI from those with no cognitive impairment.19,20
VRS Assessment of WMHs
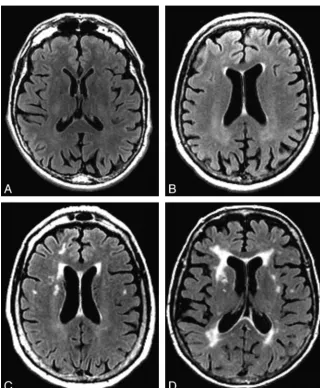
VRS was used to evaluate WMHs on FLAIR sequences in 4 periven-tricular WMH regions (frontal, parietal, occipital, and temporal), and the centrum semiovale WMH region, by using a 0 – 4 severity scale (Figs 1 and 2). Criteria for periventricular WMH ratings were based on extension of WMHs from the lateral ventricle to the cerebral cor-tex as follows: 0⫽no detectable WMH, 1⫽thin rim (pencil edge) of hyperintensity adjacent to the ventricle, 2⫽extension of WMHs to one third of the distance to the cerebral cortex, 3⫽extension of WMHs to two thirds of the distance to the cerebral cortex, 4⫽ exten-sion of WMHs to the cerebral cortex. Criteria for centrum semiovale WMHs were based on the anteroposterior extent of WMHs in the centrum semiovale as follows: 0⫽no centrum semiovale WMHs, 1⫽ at least 1 centrum semiovale WMHⱕ1 cm in greatest dimension, 2⫽
BRAIN
ORIGINAL
at least 1 centrum semiovale WMH⬎1 cm in dimension, 3⫽ multi-ple coalescing centrum semiovale WMHs occupying less than two thirds of the anteroposterior extent of WMHs in the centrum semi-ovale, 4⫽multiple coalescing centrum semiovale WMHs occupying more than two thirds of the anteroposterior extent of WMHs in the centrum semiovale.
Justification for the use of severity ratings to judge WMHs, rather than using terminology such as “punctuate” or “confluent,” is that this a simple and direct measure of the extent of abnormal hyperin-tensity and, therefore, very likely pathologic white matter on the brain MR imaging. There is no evidence that terms such as “punctuate” or “confluent” have specific biologic significance or are superior to se-verity measures. In fact, automated procedures have been developed to measure the area or volume of white matter that reaches a specific threshold of hyperintensity on MR imaging. These measures, which are more quantitative than our measures but are essentially severity measures, have been shown to be related to cognitive status.33,34
Cardiovascular Risk Factor Assessment
The cardiovascular risk factor score was calculated as a sum of 10 independent risk factors selected from the NACC/Uniform Data Set assessment protocol (Form A5: “Subject Health History”; www.alz. washington.edu/MOVIES/UDSdemoforms.pdf). These factors were rated as “present” or “absent” and included the following: 1) “Heart attack/cardiac arrest,” 2) “Atrial fibrillation,” 3)
“Angioplasty/endar-terectomy/coronary artery bypass surgery,” 4) “Congestive Heart fail-ure,” 5) “Stroke/TIA” (transient ischemic attack), 6) “Hypertension,” 7) “Hypercholesterolemia,” 8) “Diabetes,” 9) “Smoked within last 30 days,” and 10) “Smoked more than 100 cigarettes in his/her life.”
Statistical Methods
Statistical Analyses.To test interrater reliability of the VRS in evaluating WMHs, 2 raters evaluated axial FLAIR brain MR images of 30 subjects diagnosed with no cognitive impairment (n⫽10), MCI (n⫽10), or AD (n⫽10). WMHs were assessed in the periventricular frontal, parietal, occipital, and temporal regions and in the centrum semiovale region. VRS raters were blinded to the identity and diag-nosis of the subjects. To test intrarater reliability of the VRS, a single rater re-evaluated axial FLAIR brain MR images in 21 of the original 30 subjects after an interval of approximately 3 weeks. Group com-parisons of atrophy and WMH scores were analyzed by using a series of 1-way analyses of variance (ANOVA). The Scheffe post hoc proce-dure was used to examine differences between means. Logistic regres-sion was used to determine the correct classification of specific subject groups on the basis of WMH scores.
Results
Weightedexhibited a high degree of correspondence with respect to interrater and intrarater reliability for bilateral fron-tal, pariefron-tal, occipifron-tal, and centrum semiovale brain regions
Fig 1. WMHs in prodromal regions.A⫺D, Examples of
[image:3.594.53.374.39.427.2]and a moderate degree of correspondence for temporal re-gions (Table 1). For all brain rere-gions, intrarater reliabilities were achieved in the good-to-excellent range. There were group differences (Table 2) with regard to age, F[(3,171)⫽ 4.17;P⬍.008]; years of education, F[(3,167)⫽5.47;P⬍ .002]; and average MMSE score, F[(3,171)⫽49.15;P⬍.001]. Scheffe post hoc procedure tests indicated that subjects with no cognitive impairment were younger than patients with a-MCI and dementia. Subjects classified as having no cognitive impair-ment were also more highly educated than subjects in the na-MCI group. Subjects with no cognitive impairment had the highest mean MMSE scores, followed by a-MCI and na-MCI groups. The lowest average MMSE scores were obtained by the probable AD group. There were no group differences with regard to sex distribution [X2(df⫽3)⫽4.89;P⬎.18].
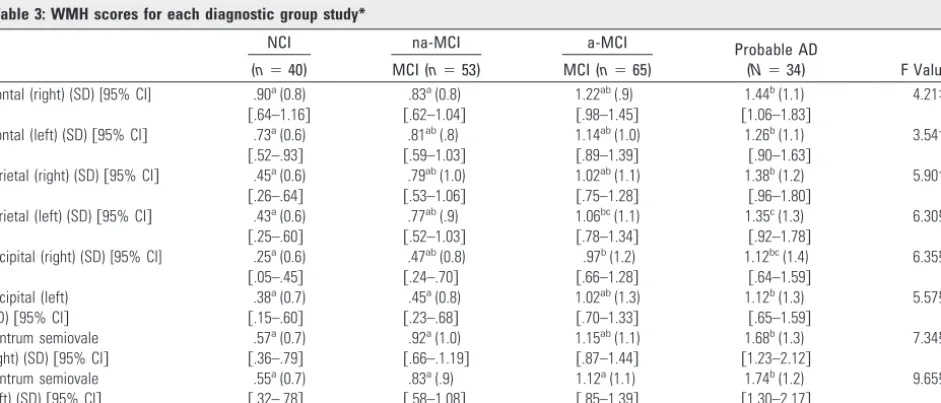
Although there were differences in age between the groups, we chose not to covary by age in the ANOVA mod-els. Because age is a risk factor for both AD and a-MCI, whereas AD and MCI are associated with increased MTA, covarying for age can obscure a true effect of the disease state on outcome measures. Miller and Chapman35 con-cluded that ANOVA was not designed to correct for system-atic differences in natural unrandomized groups and can lead to spurious findings. Subjects with probable AD had higher average WMH scores in all brain regions relative to subjects with no cognitive impairment (Table 3). In
addi-tion, subjects with probable AD had higher WMH scores in all regions, relative to subjects with na-MCI, except in the right frontal and right occipital lobes. Although subjects with probable AD had higher mean WMH scores than sub-jects with a-MCI in the left centrum semiovale, they did not differ with respect to WMH scores in other brain regions.
Average MTA scores differentiated subjects with no cogni-tive impairment and those with nMCI from those with a-MCI (Table 4). Furthermore, those subjects with probable AD had higher average MTA scores in comparison with subjects in other diagnostic groups. Subjects with probable AD were dif-ferentiated from those with na-MCI and MCI on the basis of total WMH scores but did not differ from subjects with a-MCI. Average cardiovascular risk factor scores did not differ across the diagnostic groups. MTA ratings generated by the VRS did correlate with total WMH (r⫽0.39;P⬍.001) ratings because WMHs in all regions were significantly associated with MTA scores (Table 5). There were no significant associ-ations between total WMH scores and total cardiovascular risk factor scores (r⫽0.07,P⫽ns). Although a weak association was noted between cardiovascular risk factor scores and periventricular WMH ratings in the left occipital region (r⫽ 0.15;P⬍.05), it is very likely that this represented a spurious finding associated with multiple comparisons.
With logistic regression, correct classification rates for no cognitive impairment versus a-MCI were 62% for cen-trum semiovale WMHs, 60% for periventricular WMHs, and 62% for total WMHs, respectively. When classification accuracy of no cognitive impairment versus AD subjects was computed, ratings for centrum semiovale WMH, periventricular WMH, and total WMH yielded correct clas-sification of 70%, 70%, and 69% of subjects, respectively.
Stepwise logistic regression was used to determine the ex-tent that cardiovascular risk factors, MTA, centrum semiovale WMHs, and age discriminated between subjects with probable AD versus no cognitive impairment and those with a-MCI versus no cognitive impairment. Results indicated that the overall MTA score distinguished subjects with probable AD from those with no cognitive impairment with a 75.9% sensitivity and 86.5% specificity, with an overall correct
Fig 2.WMHs in occipital and centrum semiovale regions.A, WMHs in the occipital bilateral regions would be visually rated at a level of 4.BandC, WMHs in the centrum semiovale
[image:4.594.54.534.43.232.2]regions would be rated at a level of 2 (B, right), 1 (B, left), and 3 (C, right and left).
Table 1. Inter-rater and intrarater reliability of WMH ratings
Brain Structure
Interrater
Values
Intrarater
Values
Frontal (right) .72 .77
Frontal (left) .73 .66
Parietal (right) .73 .70
Parietal (left) .70 .80
Temporal (right) .57 .70
Temporal (left) .57 .73
Occipital (right) .75 .69
Occipital (left) .82 .77
Centrum semiovale (right) .71 .77 Centrum semiovale (left) .73 .74
[image:4.594.53.286.595.719.2]classification rate of 81.8%. Addition of centrum semiovale WMHs averaged over the left and right cerebral hemi-spheres resulted in a significant increase in a correct
[image:5.594.54.537.60.124.2]classi-fication rate to 84.8%, with an 82.8% sensitivity and 86.5% specificity. If the total WMH score was substituted for cen-trum semiovale WMHs, a combination of MTA and WMH scores yielded an 86.2% sensitivity and 86.5% specificity, with an overall correct classification rate of 86.4%. Age and cardiovascular risk factor score did not enter into the logis-tic regression model. For subjects with no cognitive impair-ment versus those with a-MCI, MTA first entered into the model with an overall classification rate of 65.7%, with a 76.3% sensitivity and 50.0% specificity. The only other variable that entered into the regression model was total WMHs, which resulted in a significant increase in the clas-sification rate to 71.7%, with a 76.3% sensitivity and 65.0% specificity.
Table 2. Demographics: samples of subjects with NCI, na-MCI, a-MCI, and probable AD*
NCI na-MCI a-MCI Probable AD
Sample size n⫽40 n⫽53 n⫽65 n⫽34
Age (SD) 71.0a(5.6) 74.2ab(6.1) 75.3b(6.6) 76.6b(6.5)
Years of education (SD) 14.6b(3.9) 11.7a(3.4) 13.8ab(3.0) 13.1ab(3.7)
% Female 67.5% 40.7% 46.7% 53.3%
MMSE (SD) 29.3c(.9) 27.0b(2.4) 26.8b(2.3) 22.7a(2.8)
Note:—NCI indicates no cognitive impairment; na-MCI, nonamnestic mild cognitive impairment; a-MCI, amnestic mild cognitive impairment; AD, Alzheimer disease; MMSE, Mini-Mental
State Examination.
[image:5.594.62.533.163.365.2]* Means with different alphabetic superscripts (a,b,c) are significantly different atP⬍.05 by the Scheffe post hoc procedure.
Table 3: WMH scores for each diagnostic group study*
NCI na-MCI a-MCI Probable AD
(N⫽34) F Values (n⫽40) MCI (n⫽53) MCI (n⫽65)
Frontal (right) (SD) [95% CI] .90a(0.8) .83a(0.8) 1.22ab(.9) 1.44b(1.1) 4.21‡ 关.64–1.16兴 关.62–1.04兴 关.98–1.45兴 关1.06–1.83兴
Frontal (left) (SD)关95% CI兴 .73a(0.6) .81ab(.8) 1.14ab(1.0) 1.26b(1.1) 3.54† 关.52–.93兴 关.59–1.03兴 关.89–1.39兴 关.90–1.63兴
Parietal (right) (SD)关95% CI兴 .45a(0.6) .79ab(1.0) 1.02ab(1.1) 1.38b(1.2) 5.90† 关.26–.64兴 关.53–1.06兴 关.75–1.28兴 关.96–1.80兴
Parietal (left) (SD)关95% CI兴 .43a(0.6) .77ab(.9) 1.06bc(1.1) 1.35c(1.3) 6.30§ 关.25–.60兴 关.52–1.03兴 关.78–1.34兴 关.92–1.78兴
Occipital (right) (SD) [95% CI] .25a(0.6) .47ab(0.8) .97b(1.2) 1.12bc(1.4) 6.35§ 关.05–.45兴 关.24–.70兴 关.66–1.28兴 关.64–1.59兴
Occipital (left) .38a(0.7) .45a(0.8) 1.02ab(1.3) 1.12b(1.3) 5.57§ (SD)关95% CI兴 关.15–.60兴 关.23–.68兴 关.70–1.33兴 关.65–1.59兴
Centrum semiovale .57a(0.7) .92a(1.0) 1.15ab(1.1) 1.68b(1.3) 7.34§ (right) (SD)关95% CI兴 关.36–.79兴 关.66–.1.19兴 关.87–1.44兴 关1.23–2.12兴
Centrum semiovale .55a(0.7) .83a(.9) 1.12a(1.1) 1.74b(1.2) 9.65§ (left) (SD)关95% CI兴 关.32–.78兴 关.58–1.08兴 关.85–1.39兴 关1.30–2.17兴
Note:—95% CI refers to the 95th confidence interval for the mean.
* Means with different alphabetic superscripts (a, b, c) are significantly different atP⬍.05 by the Scheffe post hoc procedure. †P⬍.05.
‡P⬍.01. §P⬍.001.
Table 4: MTA, total WMH score, and CVRF score for each diagnostic group*
NCI na-MCI a-MCI Probable AD F Values
MTA score .54a(0.5) .50a(0.5) 1.18b(1.0) 1.98c(1.1) 28.46‡
关.37–.71兴 关.35–.64兴 关.93–1.44兴 关1.59–2.35兴
CVRF score 2.16 (1.5) 2.85 (1.7) 2.75 (1.4) 2.44 (1.7) 1.68
关1.67–2.65兴 关2.3–3.33兴 关2.40–3.10兴 关1.83–3.05兴
Total WMH score 4.25a(3.7) 5.89ab(5.6) 8.69bc(7.6) 11.09c(8.7) 8.21† 关3.07–5.43兴 关4.34–7.42兴 关6.81–10.57兴 关8.06–14.11兴
Note:—MTA indicates medial temporal atrophy; CVRF, cardiovascular risk factor.
* Means with different alphabetic superscripts (a,b,c) are significantly different atP⬍.05 by the Scheffe post hoc procedure. †Pⱕ.01.
‡P⬍.001.
Table 5: Correlation between WMH scores and MTA ratings
MTA (r)
Frontal (right) 0.36 (P⬍.001)
Frontal (left) 0.29 (P⬍.001)
Parietal (right) 0.36 (P⬍.001)
Parietal (left) 0.35 (P⬍.001)
[image:5.594.54.535.434.512.2] [image:5.594.53.286.585.678.2]Discussion
In clinical neurologic and radiologic practice, “WMHs on MR images” and “ischemic microvascular lesions” are frequently considered to be overlapping terms.8,9,34As a consequence, many clinicians diagnose vascular dementia8or exclude a di-agnosis of AD on the basis of evidence of widespread WMHs on MR images. However, among elderly individuals with cog-nitive impairment and dementia, neuropathologic studies provide a much different etiologic perspective for WMHs, demonstrating the heterogeneity of these lesions.10-13Among patients with AD, the most representative neuropathologic correlates of WMHs on MR imaging are microglial activation, gliosis, rarefaction of white matter, wallerian degeneration, nonamyloid sclerosis, and reduced attenuation of blood ves-sels.10-13The results of the current study also suggest that de-generative disease or conditions associated with dede-generative disease are the principal etiologic factors related to WMHs, rather than vascular disease.
In our study, both periventricular WMHs and centrum semiovale WMHs were consistently associated with MTA scores, which, in turn, were strongly correlated with the sever-ity of cognitive impairment. MTA scores are a substitute for the severity of pathology in medial temporal regions14-17and can be used to assist in the diagnosis of AD, even in a prede-mentia stage.20 MR imaging⫺based measurements of hip-pocampal volume loss are highly correlated with the rate of progression of MCI to AD.36,37In our study, WMH and MTA scores did not distinguish subjects with no cognitive impair-ment and those with na-MCI but did distinguish subjects with probable AD, who had higher WMH and MTA scores, from those with no cognitive impairment and those with na-MCI. Similarly, subjects with a-MCI had higher centrum semiovale WMHs and MTA scores than those with no cognitive impair-ment, but subjects with probable AD and a-MCI were indis-tinguishable by MTA and WMH scores.
Although the severity of WMHs was independently related to MTA scores, WMH scores had no correlation to cardiovas-cular risk factor scores, other than very weak correlations to single periventricular WMH and centrum semiovale WMH regions. Studies that have examined the relationship of WMHs on brain MR imaging to MR imaging diffusion char-acteristics among patients diagnosed with AD show that an increase in the apparent diffusion coefficient in water appears to be the underlying cause of the signal-intensity hyperinten-sity in these subjects.38The underlying neuropathologic cor-relate that is specific to WMHs among patients with a patho-logic diagnosis of AD is microglial activation. Changes in myelin and axonal attenuation seen in areas involved with WMHs may be related to this inflammatory process.10
The association of WMHs to cardiovascular risk factors in unselected generally cognitively healthy elderly individuals without dementia is well known. However, among individuals with dementia, the vast majority of whom have underlying AD and WMHs, it would seem that there is very little evidence to support a vascular etiology as a cause for the greater severity of WMHs on MR imaging in these individuals. The notion that WMHs are usually related to microvascular disease may not apply to patients with MCI and dementia but may apply to individuals with vascular dementia or with no cognitive im-pairment at the time of death.11,12,37Similarly, it would seem
that in the absence of any clinical evidence of cerebrovascular disease, clinical logic should argue that in patients who are diagnosed with AD, the presence of WMHs would suggest a white matter pathology caused by the underlying disease that we know is present, rather than by a disease that we speculate might be present. The relatively limited pathologic studies that have been performed to investigate the etiology of WMHs in patients with AD suggest that inflammation with microglial activation may be the underlying etiology of these WMHs, rather than cerebrovascular disease. Similar to the findings of authors from other studies, we did not find a particular loca-tion of the WMHs to be specifically associated with degener-ative or vascular markers.39,40
In this cross-sectional study, we found that the severity of periventricular WMHs, centrum semiovale WMHs, and MTA generally increased with the severity of cognitive impairment, from no cognitive impairment to probable AD. However, we were unable to show any independent relationship of the se-verity of WMHs to cognitive function in this study. Other cross-sectional studies have also not found an independent association of WMHs to cognitive function.41,42Nevertheless, several longitudinal studies do show that the severity of WMHs at baseline is associated with the rate of progression of cognitive impairment,43-45and at least 1 study has demonstrated that this association is independent of the effects of MTA.43 How-ever, it is not possible to conclude from these results, as has been done previously,43that the faster rate of progression associated with WMHs is related to the synergistic combination of vascular disease, represented by the WMHs, and degenerative disease. In fact, the propensity of subjects who progress faster to have more WMHs may merely indicate that these subjects have more severe and complicated disease, with multiple factors associated with degeneration.10-13
Conclusions
same subjects. Furthermore, the inclusion of subjects with both a-MCI and na-MCI provided the opportunity to evaluate WMH and MTA scores in the earliest stages of dementia, pre-sumably caused by both AD (a-MCI) and non-AD (na-MCI) pathology. Limitations of this study include the lack of lon-gitudinal data, which would have added another dimension to interpretation of the results, and lack of clinicopathologic correlations between WMHs and pathologic findings. Never-theless, the current study does provide important support for the hypothesis that WMHs are most likely related to degener-ative rather than vascular pathology among subjects diag-nosed with na-MCI, a-MCI, and probable AD.
Acknowledgments
We are grateful to Christopher Woodhouse, MD, at Mount Sinai Medical Center, Department of Radiology, for providing detailed information on the protocols for MR images used in this study.
References
1. Kapeller P, Barber R, Vermeulen RJ, et al.Visual rating of age-related white matter changes on magnetic resonance imaging.Stroke2003;34:441– 45 2. Fazekas F, Kapeller P, Schmidt R, et al.The relation of cerebral magnetic
reso-nance signal hyperintensities to Alzheimer’s disease. J Neurolog Sci
1996;142:121–25
3. Wahlund LO, Barkhof F, Fazekas F, et al.A new scale for age-related white matter changes applicable to MRI and CT.Stroke2001;32:1318 –22 4. Flier WM, Barkhof F, Scheltens P.Shifting paradigms in dementia.Ann NY
Acad Sci2007;1097:215–24
5. Rosano C, Alzenstein H, Wu M, et al.Focal atrophy and cerebrovascular dis-ease incrdis-ease dementia risk among cognitively normal older adults.J Neuro-imaging2007;17:148 –55
6. Golomb, J, Kluger, A, Gionutsos, et al.Nonspecific leukoencephalopathy as-sociated with aging.Neuroimaging Clin N Am1995;5:33– 44
7. Stolp H, Dziegielewska K.Role of developmental inflammation and blood-brain barrier dysfunction in neurodevelopmental and neurodegenerative dis-eases.Neuropathol Appl Neurobiol2009;35:132– 46
8. Black S, Gao FQ, Bilbao J.Understanding white matter disease. Imaging-pathological correlations in vascular cognitive impairment. Stroke 2008; 40:S48 –52
9. Du AT, Schuff N, Chao LL, et al.White matter lesions are associated with cortical atrophy more than entorhinal and hippocampal atrophy.Neurobiol Aging2005;26:553–59
10. Gouw A, Seewann H, Vrenken WM, et al.Heterogeneity of white matter hy-perintensities in Alzheimer’s disease: post-mortem quantitative MRI and neuropathology.Brain2008;131:3286 –98
11. Englund E.Neuropathology of white matter changes in Alzheimer’s disease and vascular dementia.Dement Geriatr Cogn Disord1998;9:6 –12
12. Young VG, Halliday GM, Kril JJ.Neuropathologic correlates of white matter hyperintensities.Neurology2008;71:804 –11
13. Bronge L, Bogdanovic N, Wahlund L-O.Postmortem MRI and histopathology of white matter changes in Alzheimer brains: a quantitative, comparative study.Dement Geriatr Cogn Disord2002;13:205–12
14. Jack CR, Dickson DW, Parisi JE, et al.Antemortem MRI findings correlate with hippocampal neuropathology in typical aging and dementia.Neurology
2002;58:750 –57
15. Bobinski M, de Leon MJ, Wegiel J, et al.The histological validation of post mortem magnetic resonance imaging-determined hippocampal volume in Alzheimer’s disease.Neuroscience2000;95:721–25
16. Gosche KM, Mortimer JA, Smith CD, et al.Hippocampal volume as an index of Alzheimer neuropathology: findings from the Nun Study. Neurology
2002;58:1476 – 82
17. Likeman M, Anderson VM, Stevens JM, et al.Visual assessment of atrophy on magnetic resonance imaging in the diagnosis of pathologically confirmed young-onset dementias.Arch Neurol2005;62:1410 –15
18. Barkhof F, Polvikoski TM, van Straaten EC, et al.The significance of medial temporal lobe atrophy: a postmortem MRI study in the very old.Neurology
2007;69:1521–27
19. Urs R, Potter E, Barker W, et al.Visual rating system for assessing magnetic resonance images: a tool in the diagnosis of mild cognitive impairment and Alzheimer Disease.J Comput Assist Tomogr2009;33:73–78
20. Duara R, Loewenstein DA, Potter E, et al.Medial temporal lobe atrophy on MRI scans and the diagnosis of Alzheimer’s disease. Neurology 2008; 71:1986 –92
21. Roberts RO, Geda YE, Knopman DS, et al.Association of duration and severity of diabetes mellitus with mild cognitive impairment.Arch Neurol2008; 65:1066 –73
22. Roberts RO, Knopman DS, Geda YE, et al.Coronary heart disease is associated with non-amnestic mild cognitive impairment.Neurobiol AgingDec 15. [Epub ahead of print]
23. Knopman DS, Roberts RO, Geda YE, et al. Association of prior stroke with cognitive function and cognitive impairment: a population-based study.Arch Neurol2009;66:614 –19
24. Petersen RD, Doody R, Kurz A, et al.Current concepts in mild cognitive im-pairment.Arch Neurol2001;58:1985–92
25. Folstein M, Folstein S, McHugh P.Mini-mental state: a practical method for grading the cognitive state of patients for the clinician.J Psychiatr Res
1975;12:189 –98
26. Loewenstein DA, Barker WW, Harwood DG, et al.Utility of a modified Mini-Mental State Examination with extended delayed recall in screening for mild cognitive impairment and dementia among community dwelling elders.Int J Geriatr Psychiatry2000;15:434 – 40
27. Morris JC.The Clinical Dementia Rating (CDR): current version and scoring rules.Neurology1993;43:2412–14
28. Fuld PA.Fuld Object-Memory Evaluation. Wood Dale, Ill: Stoelting Co; 1981 29. Lacritz LH, Cullum CM, Weiner, M., et al.Comparison of the Hopkins Verbal
Learning Test Revised to the California Verbal Learning Test in Alzheimer’s Disease.Appl Neuropsychol2001;8:180 – 84
30. Golden, JC.Stroop Color and Word Test.Chicago: Stoelting Co; 1978 31. McKhann G, Drachman DA, Folstein MF, et al.Clinical diagnosis of
Alz-heimer’s disease: report of the NINCDS-ADRDA Work Group under the auspices of the Department of Health and Human Services Task Force on Alzheimer’s disease.Neurology1984;34:939 – 44
32. Petersen RC, Smith GE, Waring SC, et al.Mild cognitive impairment: clinical characterization and outcome.Arch Neurol1999;56:303– 08
33. de Carli C, Murphy DG, Tranh M, et al.The effect of white matter hyper-intensity volume on brain structure, cognitive performance, and cerebral metabolism of glucose in 51 healthy adults.Neurology1995;45:2077– 84 34. Bombois S, Debette S, Delbeuck X, et al.Prevalence of subcortical vascular
lesions and association with executive function in mild cognitive impairment subtypes.Stroke2007;38:2595–97
35. Miller GA, Chapman JP.Misunderstanding analysis of covariance.J Abnorm Psychol2001;110:40 – 48
36. de Leon MJ, GolombJ, George AE, et al.The radiologic prediction of Alzheimer disease: the atrophic hippocampal formation.AJNR Am J Neuroradiol
1993;14:897–906
37. de Leon MJ, George AE, Golomb J, et al.Frequency of hippocampal formation atrophy in normal aging and Alzheimer’s disease.Neurobiol Aging1997; 18:1–11
38. Kantarci K, Jack CR, Xu YC, et al.Mild cognitive impairment and Alzheimer disease: regional diffusivity of water.Radiology2001;219:101– 07
39. van den Heuvel DM, ten Dam VH, de Craen AJ, et al.Increase in periventricu-lar white matter hyperintensities parallels decline in mental processing speed in a non-demented elderly population. J Neurol Neurosurg Psychiatry
2006;77:149 –53
40. Wright CB, Festa JR, Paik MC, et al.White matter hyperintensities and sub-clinical infarction: associations with psychomotor speed and cognitive flexibility.Stroke2008;39:800
41. Firbank MJ, Burton EJ, Barber R, et al.Medial temporal atrophy rather than white matter hyperintensities predict cognitive decline in stroke survivors.
Neurobiol Aging2007;11:1664 – 69
42. van de Pol LA, Korf ES, van der Flier WM, et al.Magnetic resonance imaging predictors of cognition in mild cognitive impairment. Arch Neurol
2007;64:1023–28
43. van Straaten EC, Harvey D, Scheltens P, et al.Alzheimer’s Disease Cooperative Study Group: periventricular white matter hyperintensities increase the likelihood of progression from amnestic mild cognitive impairment to de-mentia.J Neurol2008;255:1302– 08
44. Modrego PJ, Rios C, Pe´rez Trullen JM, et al.The cerebrovascular pathology in Alzheimer’s disease and its influence on clinical variables.Am J Alzheimers Dis Other Demen2008;23:91–96
45. Debette S, Bombois S, Bruandet A, et al.Subcortical hyperintensities are asso-ciated with cognitive decline in patients with mild cognitive impairment.
Stroke2007;38:2924 –30
46. Schneider JA, Arvanitakis Z, Bang W, et al.Mixed brain pathologies account for most dementia cases in community-dwelling older persons. Neurology
2007;69:2197–204