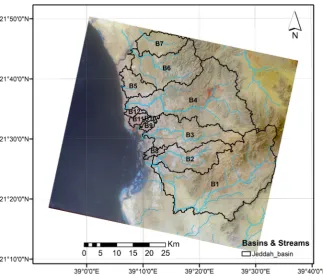
Determination of Potential Runoff Coefficient Using GIS and Remote Sensing
Full text
Figure

Related documents
For Average weight determination of each tablet, twenty tablets were used. A 2 mg of ofloxacin and 5 mg of ornidazole powder blend was weighted accurately. of ornidazole
In this review, we discuss the different assay methods, their findings on the mutation rates of HIV-1 and how the location of these mutations can be further analyzed for
These devices typically switch such traffic as Frame Relay, X.25, and SMDS, and operate at the data link layer of the OSI reference model.. Figure 3-5 illustrates two routers
CpGs whose modi fi cation levels negatively correlated with gene expression levels were signi fi cantly enriched in 5 9 ends of transcripts (Figure 3C, Figure S2 C, and Table S3
Methods: This was a cross sectional study in which we determined foetal haemoglobin levels and examined the relationship between HbF levels and disease severity in SCA patients
Here, the Thanlwin River opens into the Gulf of Martaban and Bilukyun (Giant Island) lies at its mouth. Mon coastal water is rich in many economically important species
Chapter 2 Covalent labeling of amine groups in peptides and proteins with N- Hydroxysuccinimidyl ester modified Fe 3 O 4 @SiO 2 nanoparticles containing cleavable disulfide-
In our aim to assist the analyst, we focus on the improvement of the visual search effectiveness (e.g. performance) by a semantic query-to-concept mapping: the map- ping from the
