A COMPUTERISED PRODUCTl;ON PlANNING AND CONTROL SYSTEM FOR A SMALL MANUFACTURIN~ COMPANY
A thesis
submitted in fulfilment
of the requirements for the Degree of
Master of Engineering in the
University of Canterbury by'
w.
Y. CheeUniversity of Canterbury
ABSTRACT
In this project a personal co~puter-based Oracle software package was used as a development tool for a material requirements planning (MRP) system for a small company. The main objective was to find the right approach and techniques to use in developing such a system.
The system and structured design approaches were
followed. The emphasis was on the use of graphic tools for designing. Three diagramming tools were used at the system design stage: decomposition, entity-relationship and data flow diagrams.
A relational database approach was used for data organisation. It was necessary to use the normalisation process to design the tables in'the database.
ACKNOWLEDGEMENTS
I wish to thank my supervisor, Dr. Graeme Britton, for getting the project started and for his guidance,
encouragement and help. He introduced and taught me the right approaches to system development. His dynamic approach to his work, is an inspiration to me.
I would like to thank Professor McCallion for editing my final draft.
To my friends: I owe much to Dr. T. L. Tai for spending many nights in editing and proof-reading all the chapters. I sincerely thank Soh Tan and Boon Wah for their much needed support. Much thanks to Quak Yoong for his help in getting the thesis printed. And to the many other friends who have helped me, I thank you.
CHAPTER
I
TABLE OF CONTENTS
ABSTRACT
ACKNOWLEDGEMENTS
LIST OF FIGURES
INTRODUCTION
1.1
1.2
1.3
1.4
Project's Origin
stages in the System Development Structured Design
The System Approach
II ANALYSIS OF THE BUSINESS AND ITS PROBLEMS
2.1 A General Description of the Business
2.2 organisation Structure
2.3 Factory Layout and Material Flow
2.4 Information Flow
2.5 Deficiencies in the organisation
PAGE
III
IV
IX
1 3
4 6
8
9
11
13
III ESSENTIAL FEATURES OF AN MRP SYSTEM
3.1
3.2
Types of MRP System Essential Features
3.2.1
3.2.2
3.2.3
3.2.4
Master production schedule Bills of materials
capacity planning
Computation of material Requirement
IV MODELLING THE SYSTEM
v
4.1
4.2
4.3
Decomposition Diagrams
Entity-relationship Diagrams Data Flow Diagrams
INTRODUCTION TO RELATIONAL DAT.ABASE, 4GL AND ORACLE SOFTWARES
5.1
5.2
5.3
Relational Database
Fourth Generation Language (4GL) Oracle Products
VI BUILDING THE SYSTEM
6.1 Building the Database
6.1.1 6.1. 2
primary and foreign keys Flat table
6.2
6.1. 3
6.1. 4
6.1. 5
Duplicated data
Normalisation processes SQL*plus
Building the User Interface.
6.2.1
6.2.2
Building the forms Building the menu
VII EVALUATION
7.1 System Capability
7.2 Approaches to the System Development
7.3 Diagramming Techniques
7.4 Oracle Software Package
7.4.1 Oracle Flexibility
7.4.2 Ease of Use and Learning
7.4.3 Processing Speed
7.5 End User Development
7.6 Conclusion
REFERENCES
BIBLIOGRAPHY
53
54
57
56
56
76
78
78
79
80
80
81
82
82
83
86
APPENDICES
A. B.
C.
D. E.
F.
G.
H.
I. J. K
Entity-relationship Diagram Keys Detail Data Flow Diagrams
Ship Schedules
4GL Report Generators comparison oracle Hardware Requirements SQL*Forms Terminology
First, Second and Third Normal Forms
Tables in the Database SQL*Menu Documentation
Detail Description of Forms SQL*Forms Triggers
88
90
96
97
98
99
100
103
106
114
LIST OF FIGURES FIGURE 1 2 3 4 5 6 7 8 9 10 11 12 13 14 15 16 17 18 19 20 21 22
Stages in the system development organisation structure
Factory plan
Information and material flow diagram Closed-loop MRP system
Product structure tree example Decomposition diagram
Entity-relationship diagram Data flow diagram
Application-centred data organisation Database approach
Relational table attributes
Application size to software technology match
Computer software generations Oracle software products
Page 1 of Master form Page 2 of Master form Page 3 of Master form Page 4 of Master form page 1 of Creorder form Page 2 of Creorder form Page 3 of Creorder form
23 Page 1 of capacity form 65
24 Page 2 of capacity form 65
25 Page 3 of capacity form 66
26 Page 4 of capacity form 66
27 Page 5 of capacity form 67
28 Page 6 of capacity form 67
29 Page 1 of Factory form 68
30 Page 2 of Factory form 69
31 Page 3 of Factory form 69
32 Page 4 of Factory form 70
33 Page 5 of Factory form 70
34 Page 1 of Reorder form 71
35 Page 2 of Reorder form 72
36 Page 1 of Control form 73
37 Page 2 of control form 73
38 Page 1 of Performance form 74
39 Page 2 of Performance form 74
40 SQL*menu-application specification 76 41 SQL*menu-work class/user information 76 42 SQL*menu-options for application 77 B1 DFD of shift progress data entry 90
B2 DFD of processing order 91
B3 DFD of committing order 92
B4 DFD of scheduling 93
B5 DFD of reports 94
B8 DFD of processing purchase form 95
Jl Page 1 of Master form 122
J2 Page 3 of Master form 123
J3 Page 1 of Creorder form 123
J4 Page 5 of Capacity form 129
J5 Page 3 of Master form 131
J6 Page 4 of Capacity form 131
J7 Page 1 of Factory form 132
J8 Query statement for stock level 139
J9 Query statement for WIP 139 '
CHAPTER I
INTRODUCTION
1.1 Project's Origin
This project concerned the development of a management system for a manufacturing company in Christchurch that
makes quality plastic wares. An analysis of the company was made and a proposal was to be put forward for a PC based computer system that would give the management information for production planning and control and also for processing orders from customers. At an early stage i t was envisaged that the system would be built on a spreadsheet or a
database management system (DBMS). The planning and control would be done through a material requirements planning (MRP) closed loop system. This would ~ave given the management the functions that they wanted in the system at a cost lower than commercially available manufacturing software systems.
The needs of this company are similar to many small manufacturers in New Zealand. Many realise the importance of information systems in improving manufacturing
productivity. In a survey- of New Zealand manufacturers, the most frequently cited critical issues in information systems are lower product costs, improved material and production control and improved financial control 1
be met with a computerised MRP system.
These needs may
In 1988 there were approximately 16,000 manufacturing sites in New Zealand. Only about 300 of them used an
integrated manufacturing software package I, Small
manufacturers may not need the complicated manufacturing packages currently available in the market. Also they may not be able to afford the high price of these packages. Enquiries in Christchurch revealed that a typical cost for manufacturing and inventory modules was $ 10,000 or more. Many small manufacturers may want an alternative.
The alternative may be provided by information systems developed from common development softwares such as Oracle. These softwares are getting increasingly cheaper and more user-friendly. The new focus of this project was to
investigate the approach and techniques in designing and building such information system, in particular an MRP system. This could then provide a guide-line to
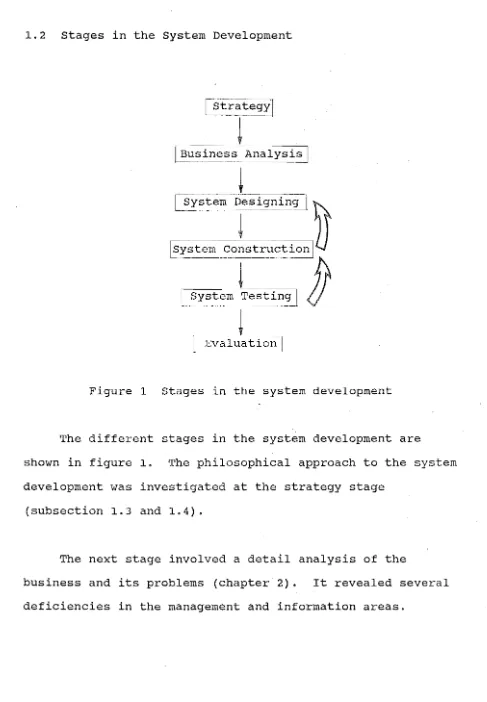
1.2 stages in the System Development
[str~teg~
---'-~
.[Busi~ne~~
AnalysisI
_~
___ t __
~_
~e~r!,~~n~ ~
Isystem
construct~LJ
~
Figure 1 Stages in the system development
The different stages in the system development are
shown in figure 1. The philosophical approach to the system development was investigated at the strategy stage
(subsection 1.3 and 1.4).
The next stage involved a detail analysis of the
[image:14.595.64.551.66.768.2]At the system designing stagel possible solutions to the deficiencies were investigated. Firstly, a study was carried out on the application of the MRP system for
production planning and control (chapter 3). Nextl three diagramming techniques were employed to model the system. The diagrams provided a graphic illustration of the
necessary components and data requirements in the system (chapter 4). An assessment was then made on the type of software packages that would suit the system (chapter 5).
The construction of the system involved building a database and end-user applications (chapter 6). The system testing provided feed-back on the necessary changes and improvements to be made at the system designing and construction stages.
The final stage was an evaluation of the system development (chapter 7) •
1.3 structured Design
structured design is defined as the development of a blueprint of a computer system solution to a problem, having the same components and interrelationships among the
components as the original problem has 2 To do this
successfully the designer must resists making decisions on how the problem is to be solved until what the problem is has been determined.
structured design involves a top-down approach where large, complex problems are broken down into smaller, less complex components. Decomposition continues until the original problem has been expressed as some combination of many small solvable components. The strategy is also to code and test the higher level modules first before moving on to design more detailed lower level modules. To do this dummy routines are substituted for detailed modules. These routines usually consist of returning constant output,
returning a random number, immediate exit or output message to indicate that the module has been executed.
The benefits of the top-down approach include:
i) Skeleton version of the system can be developed and demonstrated to users at an early stage~ This is
want. Changes at this early stage are certainly much easier to make than when detailed codes have been completed.
ii) To the system developer, seeing the resulting progress at an earlier stage can be an important morale booster[ especially for projects requiring a long time to
complete.
iii) Debugging is easier and more systematic. This is because top-down testing tends to be incremental in nature. It consists of adding one new module to an existing skeleton of modules and observing the
behaviour of the new system. If anything is wrong the problem is usually located in the new module or in the interface.
1.4 The System Approach
In simple terms, the system approach is a philosophy which emphasises the role of a component in a larger system of components. The effectiveness of components considered collectively as a system may be greater than the sum of the effectiveness of each component considered separately.
The basic objective of the system approach to
information system design is to optimise the organisation as a whole. This means that the system analyst must not look at problems in isolation from the larger system they are in. For example, proposing a just-in-time system to solve
production planning and control problems would be disastrous without also solving problems dealing with unreliable
suppliers.
CHAPTER II
ANALYSIS OF THE BUSINESS AND ITS PROBLEMS
The system analysis started with a series of
interviews with the management and also with the workers. Considerable time was spent observing the day to day
running of the business and sometimes helping to do some of the functions. The objective was to have a total view of the organisation. This included understanding its constraints, the interrelationship between departments, the flow of information and the particular problems that the management wanted the system to solve.
The findings are summarised and documented below.
2.1 A General Description of the Business
The business operated as a number of companies. For instance, the factory that was involved in manufacturing the products and distribution to markets was set up as one company, and there was another which took care of overseas markets. The products manufactured included a wide range of plastic kitchen wares, food and drink serving wares and airtight storage boxes and canisters.
raw materials and packaging materials were purchased from suppliers.
2.2 Organisation structure
r-=
sales. coordinator accountant
assistant accountant
managing director
l
mould shop suparvisor
\
mould technicians
assistant faclory manager
I packaging supervisor
l
packaging I
assembly workers
Figure 2. organisation structure
l
1001
makers
1
I
storemenlloading ~;orkers
As the number of employees was small the areas of responsibility among them were rather broad and
[image:20.596.65.545.96.735.2]The managing director was more involved in overseas marketing. He made the initial contact with clients and often went overseas to do that. The assistant managing director would oversee the day to day running of the whole business. She also played the role of marketingl
making decisions on the prices and even purchasing some of the materials.
The sales co-ordinator was in charge of processing orders I responding to local customer enquiries and
dealing with the sales representatives.
The financial and accounting part of the business was the responsibilities of the accountant and his assistants.
The factory manager was responsible for the manufacturing part of the business, making sure the factory capacity could cope with the local and overseas orders. His assistant would take care of the day to day scheduling of the machines, packaging and loading
~
processes. Supervision of all die changes and
The factory operated for three shifts a day. Each shift had its packaging supervisor who co-ordinated the assembly and packaging work. The two storemen did the store keeping and loading of products onto transport vehicles.
2.3 Factory Layout and Material Flow
The business operated from a two-story building, with the administration occupying the top level and the
factory the ground level. The plan for the factory is shown in figure 3.
The movement of material is as followed (see both figures 3 and 4) :
In-coming plastic raw materials in small quantity were stored in the factory itself; larger quantity were stored in the storage building. Other materials were stored in the loading or stock areas.
The plastic materials. were fork-lifted or manually brought to the mixing area to be mixed with colourant pallets for the particular colours of the products. This was done in rotating drums. The right mixtures were then manually loaded onto the moulding machine hoppers.
I
I
Plastic I
I
Materials I
I
_____ J
.--...
0 ' - - ..0 [image:23.1190.158.1047.14.816.2]1
.--2
...
0
-
..00 '"'
I~
r
""'-- ,-...
...
0 c
..0 .0
0 ...
'"'
i::I-..,
""--13
12
D~
D.""---
Press~
Ultrasonic Weldero
0
W orkshopPress
Office
Cafe
Container Bay
Figure 3 Factory plan
-<II d)
(5
0
4
r'"
: !
I I
D
.
10
Mixing Area
Dies
I
Toilet
I
Plastic Materials ___ I
D[g]
D
L-Conveyor
I I
I
l
:
:
D
G
L_i I...J
8
~
"'"
0I
DiesI
>.d)
> c
8
..."'"
0 e-Ul"'"
..s
on cStock Area for
'So
ro!
~
u
I
ro
.
- ,
Parts and Matenals
Packag ing for Local Orders
n
Storage
[
StorageLoading Area
..
or allowed to be dropped onto conveyors or boxes placed underneath the machines (Figure 3).
The parts were assembled and packed at the end of the conveyor line for large orders, which .were usually overseas orders. Some of these parts from the conveyor also went to stock when stock levels were low. Packaging of local orders was done close to the loading area. The parts for local orders mostly came from the stock.
The simple assembly work involved putting two or three parts together. For example, putting a lid onto the canister. For some products, assembly was done on the ultrasonic welder which welded plastic parts
together. Some work on non-plastic parts was done on the presses.
stickers and a bar code were then put on the assembled products. Some products were then put into gift boxes and finally into carton boxes. The carton boxes were moved to the loading area, ready to be loaded onto vans or trucks for local orders or shipping
containers for overseas orders.
2.4 Information Flow
customer
overseas loca
orders
\7
\1
order processing and
administration
shipping documents (for containers)
I
local export +order packing slip (for local orders) consignment notes / delivery notes
plastic raw material
moulding
shift shift
work priority
progress
supplier
r--plastic raw material packaging material
non· plastic pans
storage ~1
~
11
stock level
clastic oans
Slack
packaging malerial non· plastic pans
L"',-/"
«)'
export + local order forms ~ export
'" packaging
' " r&
~ productioncustomer
planning and control
loading
1
shift oackaoino schedule r-. (lncl. assembly)
shift progress +
reject count
local packaging (incl. assembly)
.--sheet I'
D
products in containers, (cont~ers)_____ v:.::a~n::::.s,'-.!t:.::ru:.:::c.:.::ks:::.._ _ _11 loading bay'
local +
export order
-& forms products in canon
~r-
____________ b_o_xe_s __~
__~
Figure 4 Information and material flow diagram thin arrow: information flow
[image:25.595.67.529.50.790.2]involved calculating the order's fully packed weight and volume. The calculated volume was then compared with several container sizes. If there was space available in the chosen container size"the sales co-ordinator would persuade the customer to order more to fill up the space. The weights of local and overseas orders were quoted on the transport documents.
Next, the shipping schedules were consulted to determine which ship the order would be on to meet the customer's required date. The sales co-ordinator would then pass the export order form to the production
manager, detailing the products, their quantity and the date of sailing. The production manager would decide whether or not there was enough factory capacity for that order. If capacity was available, i t would be committed to producing for that order. If capacity was lacking, the sales co-ordinator would negotiate a new delivery date with the customer.
For large local orders the same kind of consultation went on between the sales co-ordinator and the factory manager. Small local orders were recorded on local order forms with expected delivery dates and passed on to the factory planners.
As orders came in, the numbers of parts required were calculated and the machine time for each part was
estimated. The board was then updated. It was from the information on this board that the machine allocation and packaging schedules were based.
These activities were. done for large orders only. For small local orders, the needed parts were taken from stock. Whenever the stock level was low the planners would reserve some machine capacity for local orders.
Packaging capacity was not planned as such. The planners would rely on their experience to estimate the available capacity in that factory. Packaging was a more critical process to control than the moulding process as i t was the slower process most of the time. The machines were often run at a slower speed than their capability so that a bottle neck situation would not develop.
In the loading bay, the two storemen who were in charge of this area recorded on the loading sheet, the products that were loaded into the container. On
completion of loading each order, the loading sheet would be checked again by the planners. When transport
vehicles arrived to pick up the products, consignment forms from the transport company would be sent up to the office to be filled in. Packing slip for local orders or shipping documents for overseas orders would be sent down to the loading bay to be delivered with the orders.
2.5 Deficiencies in the Organisation
From the analysis made of the business, several
deficiencies were found in the management and information areas. The more important deficiencies that needed
urgent attention are described below:
i) The need to streamline order processing and factory scheduling
There were two time consuming and repetitious
processes that could be computerised: the processing of orders and the 'explosion' of products into their parts to estimate the machining time.
director also accepted orders on his overseas sales trips with little consultation with his factory manager. At times the factory manager had difficulty fitting all these orders into the factory schedules. Clearly an information system that would give accurate data on available factory capacity was needed for the factory manager, the sales co-ordinator and the managing
director.
ii) Better product costing system
The accountant expressed the opinion that there
should be a better product costing system in place. What was available was only material costing for each product. No attempt was made to estimate labour content, factory overhead or administration overhead. When quoting price for an order, rule-of-thumb was sometime used; 'x' times material cost. There was no way of knowing whether those quotes would actually cover the production cost until the accountant has worked out the profit or loss for that period with all the income and expenditure figures.
iii) More efficient way of ordering of materials
was no multiple ordering of items and items were indeed ordered when stock levels were low.
iv) stock Keeping
How did the manager knows about the stock levels? He often had to send the storemen to count the materials in stock. A better $tock keeping practice needed to be in place. This would make i t easier for the yearly stock taking too.
v) No measure of performance
There was virtually no performance indices employed by the management. The managing director was interested only in knowing whether the products were selling well or not. As for the rest of the people in the company they would not know whether they were improving or otherwise in what they were doing. They had little incentives to improve, this was especially true for those in the
factory.
There were other areas that were in need of
CHAPTER III
ESSENTIAL FEATURES OF AN MRP SYSTEM
The computerisation and production control and
planning required by this business could be provided by a material requirement planning system. The repetitious nature of the production made i t a potential candidate for the just-in-time (JIT) way of planning and control, which would bring in a lot of benefits. This was not considered as JIT requires radical changes in the
organisation, with which this business would not be able to cope.
JIT advocate, Edward Hay wrote:
If a company is coming apart at the seams, my inclination is to say to implement MRP, both in
order to get control and in order to keep the
situation from deteriorating further by ~sking
employees to make such a radical change as JIT .
3.1 Types of MRP System
An MRP system can be used in a variety of different ways. Schroeder has summarised them as three different types described as follows 4:
Type I: An inventory control system.
It is an inventory control system which releases manufacturing and purchase orders for the right quantities at the right time to support the master schedule. It does not include capacity planning.
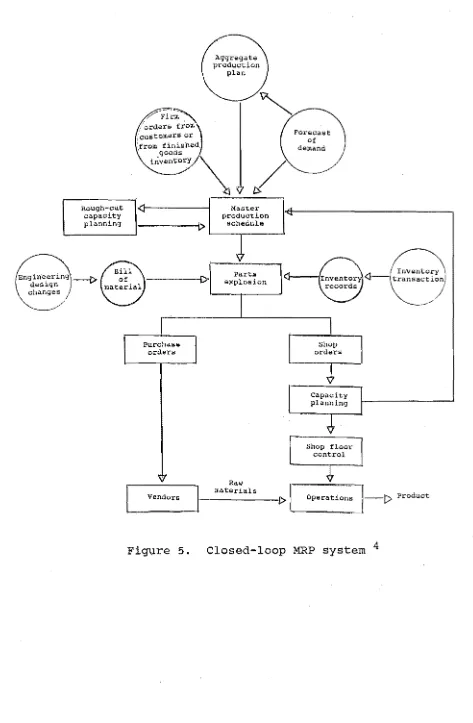
Type II: A production and inventory control system.
It is an information system used to plan and control inventories and capacities in manufacturing companies. In this system, the orders resulting from parts explosion are checked to see whether sufficient capacity is
available. If there is not enou~h capacity, ~ither the capacity or the master schedule is changed. This system has a feedback loop between the orders launched and the master schedule to adjust for capacity availability. As a result this type of MRP system is called a closed-loop system; i t controls both inventories and capacity. This is shown in figure 5.
Type III: A manufacturing resource-planning system.
Rough.-cut capacity
planning 1---1.>
~---~ ~--~---~
\ - - - 1 \ >
Vendors
1
Parts explosion
Raw materials
- - - [ >
l--t>
Product" - - - -_ _ _ --4
[image:33.598.75.548.52.775.2]personnel, facilities, and capital equipment. In this case the MRP parts-explosion system also drives all other resource-planning subsystems in the company.
The MRP system that this project is concerned with is perhaps best described by the MRP type II system. It is not expected that all MRP systems should fall neatly into anyone of these three types of systems. All
information systems should reflect the needs of the
business, and these needs differ from one business to the others. Despite these differences, a successful MRP
system would have to incorporate a few essential features which are described below.
3.2 Essential Features
3.2.1 Master production schedule (MPS)
An MRP system is driven by the MPS which specifies the "end items" or output of the production function. All future demands for work-in-process should be
dependent on the master schedule and the material requirements should also be derived from the master schedule.
The top of figure 5 shows information from three sources that is needed for scheduling. The aggregate production plan deals with families of products or
and strategic planning process. Aggregate production planning and forecasting of demand are outside the scope of this project. I t is assumed that information from these two sources are on hand when scheduling is done.
Scheduling is often done on a weekly basis. The MPS consists of weekly time buckets. In the case of this system the time buckets are further separated into a
large orders section and a small orders section. This is to ensure that capacity in any single week is not
overwhelmed by large orders and that small orders are catered for. The period covered by the master schedule should be long enough to ensure sufficient time is
available to order all parts and materials.
It is very important that the MPS reflects realistic capacity constraints. So before the MPS is to be used, a capacity planning routine must be run to determine
whether sufficient machine capacity, material and human resources are available. The methods employed to do this are explained later.
3.2.2 Bills of materials (BOM)
To be able to derive material and capacity
requirements from the master schedule, an accurate BOM is needed. BOM is a structured list of all the materials or parts needed to produce a particular product, assembly,
level of assembly
o
3
Figure 6. Product structure tree example 5 Key: (2) required units for higher level
assembly
132145 inventory number)
Figure 6 shows the type of information in a typical product structure tree, which the BOM would have to hold for all products: i t lists all c~mponents of a product and how they are related. A prerequisite to setting up a BOM is that each inventory item is identified by a unique code (inventory number).
3.2.3 Capacity planning
There are two ways to check the validity of the MPS:
1. Rough-cut capacity planning (or resource planning)
Approximate labour hours and machine hours are calculated directly from the master schedule to project future
process. When sufficient capacity is not available, the master schedule is adjusted or capacity is changed to obtain a feasible schedule. Only then is the parts-explosion run, to get the materials requirements.
2. Shop loading
A full parts-explosion is run at the beginning to get the resulting shop orders. These are loaded against work centres through the use of detailed parts-routing data. This gives a projected future capacity requirement for each work centre. As in the first method, the capacity or the MPS is adjusted until the MPS becomes feasible. At this point a valid material plan is available.
Rough-cut planning involves less calculations but is not as accurate as shop loading. Either one or both of these methods can be used, depending on the system
requirements.
The products produced by the factory being studied had a simple product structure. As the parts-explosion did not involve much computation, the more accurate technique was chosen.
3.2.4 computation of material requirements
each inventory item is in turn guided by the following questions:
What do we have? What do we need? What do we do?
Some basic elements of the inventory status that are needed to answer the above questions include:
Quantities on hand Quantities on order
Gross requirement quantities Net requirement quantities Planned-order quantities
On-hand and on-order quantities are reported to the system and can be verified readily by inspection. The other three quantities are computed by the system and can be verified only through recomputation. They are
explained below.
The gross requirement of an inventory item is
defined as the quantity that will be issued to support a parent order (or orders). For example, the gross
The computation of the net requirement is as follows:
Gross requirement minus on-order quantity minus on-hand quantity equals net requirement
The planned order quantity of an item is equal to its net requirement. The release of planned order is arrived at by offsetting for lead time.
One important factor that also needs to be
considered in the computation of material requirements is the safety stock. The primary purpose of safety stock is to compensate for fluctuation in demand, i.e. for
forecast error. Therefore, safety stock, where required, should be considered at the master schedule level. This has the advantage of ensuring that matching sets of
components, not simply an assortment of various parts, are available for production. The secondary function of safety stock is to compensate for uncertainty of supply. For items which are known to have erratic resupply
performance, it is justifiable to allow for safety stock.
Two types of stocks may be maintained in the
minimum stock levels set by the management. The aim of the system is to maintain the material stock levels within a range as close to the mean level as possible. In the long run the management should aim to eliminate the need for safety stock, that is to bring the mean level down to zero. This can be achieved by negotiating and working with the supplier to ensure a more reliable supply.
CHAPTER IV
MODELLING THE SYSTEM
Modelling the system is an essential stage in the system development. The system model should be able to provide the necessary information, which is needed to build the database and end-user applications. It should show the data requirements and the activities (processes) of the system. Normally, i t will require more than one type of modelling technique to do this.
In this project, three diagramming techniques were
employed to model the system. They were chosen because they
*
were able to provide the required information and they had the ability to support the top-down approach.
4.1 Decomposition Diagrams
The first and the simplest of the diagramming
techniques is the decomposition diagramming. A high-level organisation, function, or activity is decomposed into
*
Cronin demonstrated in his book, Mastering Oracle, that these three diagramming techniques provided sufficient information to build a relational database and applications, by using the Oracle software tools (Daniel J. Cronin,lower-level activities or processes. The lower in the hierarchy, the greater will be the details.
Decomposition at the highest level is termed functional decomposition. It illustrates the major functions or
activities of the corporation.
Lower down in the hierarchy are the processes and sub-processes, consist of mainly specific activities that have to be carried out.
functions process subprocesses
Order processing
Enter order's particulars
Check order's volume and weight
t
Calculate volume and weightChoose container type Negotiate with customer to fill available space in container
Estimate order's production cost Calculate material cost Calculate moulding cost Calculate packaging cost Calculate factory overhead cost
Get total cost Get sailing date from shipping schedules
Check with factorY capacity
Calculate order's required capacity
Load order into schedules Check factory capacity
Check material availability Estimate completion date of
order
Compare completion date with delivery/sailing date Commit order to production
Update factory capacity Update material requirement
Production Planning and Control
Weekly scheduling of MPS
Get demand predictions' Summarise previous week production
Get committed orders data Schedule production
Derive material requirement from MPS Calculate material
requirement
Get order releases
Propose material reorder Inventory control
Update inventory during production
update inventory for goods received
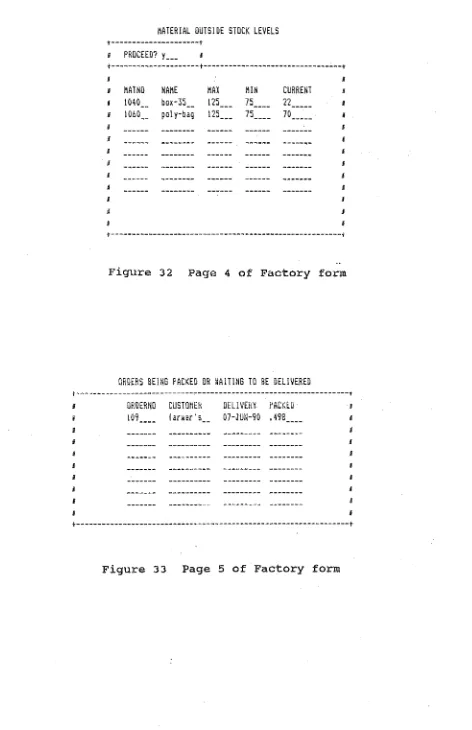
Report on stocks outside their levels
Work-in-process
~
Repo~t
on orders beingL
packedReport on undelivered orders
Performance measurement
Calculate material wastage Calculate packaging
performance
Calculate moulding performance
Calculate machine utilisation
4.2 Entity-relationship Diagrams
If the decomposition diagram is to be taken as one half of the equation in modelling the system, the
entity-relationship diagram is the other half. An entity is something (real or abstract) about which data is stored. Some examples of entities in a business are clients, suppliers, divisions or departments. The
entity-relationship diagram assists the designer in defining and understanding the significant entities in the business and also the relationships between these entities.
The entity-relationship diagram of the system is shown in figure 8. The keys to this diagram are given in appendix A.
In building an entity model, the simplest core relationships are usually defined first. other
relationships are then added, layer by layer to make a complete model.
The core relationships in the system were the factory capacity-MPS-MRP relationship and the product-unit-part relationship. The latter relationship is explained below.
is consist
'of
provide relations to
is OUlP\.lt
of
is planned in
is derived from
is derived from
delivery 110te Is check with
unit
capacity in terms of
of
is consist 01
output of
of
material requirement Is check with
volume Is check with
is supplied by
makes is planned
in
product, while two canisters and two lunch boxes without gift boxes might form another.
In this way, the number of different products was in the hundreds. This would make production planning (in the MPS) in term of products difficult to manage. The number of different units was less than sixty, a more manageable
number. Therefore, i t was decided that the planning would be done in term of units. However, i t recognised that the marketing and long term planning should be carried out in relation to products or product lines.
The other entities and relationships were defined and added on to the core relationships, as shown in figure 8.
4.3 Data Flow Diagram (DFD)
The data flow diagram (DFD) binds the business
functions and entities, providing a graphic representation of their interrelatedness. It captures the input and output flow of data in the entire system. It also serves as a
platform for designing the database, menu and user interface.
Again, by taking a top-down approach, the overview DPD of the system was worked out first (figure 9). The diagram showed only the source (the origin of data), and the sink
(the ultimate recipient of data). The DFDs for all the
date of sailing
V
II
order particulars
-¢r
Order Processing
order processed data
g
SaJes Co-ordinator
II
Figure 9
I
II
II
I
I
delivery cousigmentnotes notes
-¢r
I\ ]
Production Planning and Control
purchase particulars
?
Purchase Form
Data flow diagram
shift progress
& material used
-"9
w.i.p.
performance indices stocle levels
M:magcment
dem'and ' prediction
V
In detailing the diagrams, i t was necessary to
establish the types of information that have to be kept in each file. This information was particularly important when designing the database. It also became clearer at this
stage which of the files or processes would be computerised. Some of them might be more efficient to be used in the non-computerised form.
One such file was the Shipping schedules. The amount of manual data entry for such schedules was considerable and i t required updating regularly (see example in appendix C). Unless the data was kept electronically in the shipping companies and could be accessed by or down loaded into the
\
user computer, the computerised schedules might not be
efficient to use. The possibility of electronically linking up the shipping schedules was not investigated in this
CHAPTER V
INTRODUCTION TO RELATIONAL DATABASE, 4GL AND ORACLE SOFTWARE PACKAGE
This chapter explains the relational aatabase approach to data organisation in a computer system and the type of software technology that was chosen. It also introduces the Oracle software tools that were used to build the system.
5.1 Relational Database
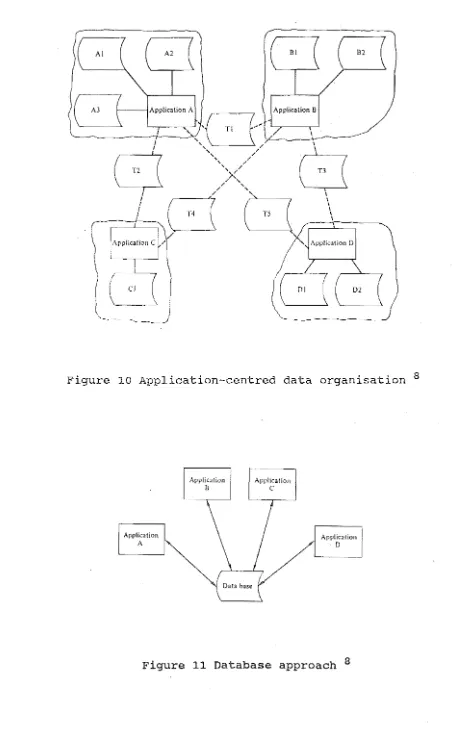
The application-centred approach is one way of organising the data in a system (figure 10). In this approach, data files used by applications are linked to individual applications only. Transfer files (TI-T5) facilitate the communication between the applications. However, this approach has some serious weakness. It can easily bring in problems of inconsistency in the data and unnecessary duplications of data.
The database approach will greatly reduce the above problems. Data is stored as a common pool to be shared between applications (figure 11). Knowing the overall requirements of the enterprise - as opposed to the
that is "best for the enterprise." This is very much in line with the system approach.
Security can be a problem with the sharing of data. Therefore, the database system must be structured such that (a) the only means of access to the database is through proper channels, and (b) authorisation checks will be invoked whenever sensitive data is accessed.
Figure 10 Application-centred data organisation 8
Application
A
Application B
Application
C
Application
D
[image:52.595.58.524.55.796.2]attributes:
Figure 12 Relational table attributes 9
5.2 Fourth Generation Language (4GL)
There is a wide range of software packages available in the market. Selecting one to suit the applications is quite a task. A guide in choosing the type of software technology to use is shown in figure 13.
Earlier in the project, an attempt was made to use the company/s spreadsheet software package called
LOGISTIX. A database and macros were developed to calculate weight, volume, material cost and machining time needed for orders. The hardware used was ICL PC model 46, with 20 Mbytes fixed disc and 551 Kbytes user RAM. The spreadsheet took about 10 minutes to process a simple order.
Though with a more sophisticated spreadsheet and a faster machine the processing time could be shortened, the experience here showed that a spreadsheet would not be able to handle an MRP system efficiently. Processes such as parts-explosion, calculation of capacities and material requirements, and processing of orders require a lot of data manipulation. It would take a database
management system (DBMS) and a database access and
VERY SMALL APPLICATIONS- <500 LINES OF SOURCE CODE
o
SPREADSHEETS
o
INTERPRETED LANGUAGES (BASIC C)
SMALL APPLICATIONS -
500-2000 LI NES
, " .,--.----o END USER FOURTH GENERATION LANGUAGES
LOW-MEDIUM APPLICATIONS -
2000-8000 LINES
~.--.--'- "'""'1""'1 •
o
PRODUCTION FOURTH GENERATION LANGUAGES
oPROGRAM AND APPLICATION GENERATORS
MEDIUM APPLICATIONS -
8000~32,000LINES
, , { .
o
CASE DESIGN TOOLKITS
o
FOURTH GENERATION LANGUAGES
o
PROGRAM AND APPLICATION GENERATORS
o
THIRD GENERATION LANGUAGES
MEDIUM-HIGH APPLICATIONS -
32,000-128,000 LlNES
• t' ,
o
CASE ANALYSIS AND DESIGN TOOLKITS
o
PROTOTYPING TOOLS
o
THI RD GENERATION LANGUAGES
LARGE SYSTEMS -
-.~,-,128,000-512,000 LINES
,,",,-~o
CASE ANALYST AND DESIGN TOOLKITS
oPROTOTYPI NG TOOLS
o SECOND AND THIRD GENERATION LANGUAGES
o
REUSAB I LI TY
VERY-LARGE SYSTEMS - 512,000-2 MILLION LINES
o
ANALYSIS, DESIGN, PROJECT MANAGEr-lENT TOOLKITS
o
REUSAB I LITY
o
DEVELOPMENT METHODOLOGY
o SECOND AND TH I RD GENERA TlON LANGUAGES
T H I R D G ENE RAT ION
TOO L S
o
COMPILERS
o
PROGRAM EDITORS
&
LIBRARIES
o
TEST DATA GENERATORS
&
COMPARATORS
o
PERFORMANCE MONITORS
&
OPTIMIZERS
.
F
0
U
R T
H
G ENE RAT ION
TOO L S
o
FOURTH GENERATION LANGUAGES
o
DBMS
o APPLICATION GENERATORS
&
CODE GENERATORS
F 1FT H G ENE RAT ION
TOO L S
o
NATURAL LANGUAGE INTERREPTTERS
o
SPEECH RECOGNIZER
o
VOICE SYNTHESIZER
o
PARALLEL PROCESSOR
DBMS is a tool associated with the 4GLs (see figure 14). What is a 4GL? There is no standard definition for a 4GL tool or system. Features of a 4GL include ease of use, less instructions and time are required in
application development compared with third-generation languages such as COBOL or PL/l, and suitable for
nontechnical end-users. Many characterise a 4GL system as one where a programmer specifies the task to be
achieved, while leaving the knowledge of how to achieve the task to the language itself 11
A 4GL system should support:
*
high-level user functions such as screen formatting, menu and logical device management,*
data-oriented functions such as structuring of data, storage management, and*
system functions such as file handling and communication with other applications.5.3 ORACLE Products
A list of the more popular 4GL softwares is given in appendix D. A 4GL software package called ORACLE, was used as the system development software because of the following:
*
It is a relational database system and therefore has the advantages mentioned earlier.*
It uses the industry-standard relational database language, SQL. This means that future development work can also access a wide range of SQL-based products and is less likely to become an obsolete language in the fast changing computer world.*
Applications developed on Oracle can be ported to over 80 hardware platforms with virtually nomodifications required. This gives great flexibility to future development work.
*
By using default settings provided in itsapplication generator, a skeleton of the system can be developed quickly.
*
As one of the world's top selling database systems i t is a proven product ..
'. '.....
•• 'f'
j. ~ .
1\,
.-OAACLE I,. RDBMS
.
..
....
..
....
Figure 15 Oracle software products 12
~~~
The Oracle products for personal computers, as illustrated in figure 15, consist of:
Oracle Relational Database Management System (RDBMS)
It manages the data storage environment and the access to data. The data base with its associated tables are
stored in an active data dictionary. This means that the system automatically updates the dictionary in "real
structured Query Language (SQL)
SQL is the interface language between the user and the Oracle database. Developed by the IBM corporation, SQL was accepted by the American National Standards Institute
(ANSI) in 1986 as the standard access language of RDBMS.
A set of SQL-based tools and utilities is available to help users in developing and running applications. Three of these tools, namely SQL*Plus, SQL*Forms and SQL*Menu, were used to develop the system in this project. The essential features of these tools are described below.
SQL*Plus
Of all the tools, SQL*Plus provides the most direct
access'to data. SQL*Plus includes the full standard SQL commands, plus the Oracle developed extensions to SQL, called SQL*Plus commands. with these commands, users can then perform ad hoc queries and data base administration functions or run pre-defined reports.
SQL*Forms
SQL*Plus, but it would be laboriously slow if there are more than a few records to be manipulated.
Functions that can be designed in the forms for the control of data entry are:
* provision of default values;
*
validation of data to ensure it is correct;* cursor navigation to control user movement through the application;
* automatic display of related data; and * automatic computation of field values.
At the heart of SQL*Forms are the triggers. They are strings of SQL statements or SQL*Forms commands placed at various event points in the form. When a certain event occurs, a predefined trigger will fire, executing a set of instructions.
SQL*Menu
SQL*Menu is a management tool for linking all the
applications, even non-Oracle applications. Access to the applications is through a set of options presented in a traditional menu style. It can be designed to
designate authorisation levels, so users can only access those options which they are authorised to use.
CHAPTER VI
BUILDING THE SYSTEM
6.1 Building the Database
In building the database, all information or attributes associated with each entity/files would have to be gathered. The data flow diagrams were able to provide this
information. These attributes and entities formed the columns and tables of the database respectively. To transform the tables to a relational database, the normalisation process, described below, was followed.
Normalisation simplified each table to its primary key and attributes. The goal of normalisation was to minimise data redundancy and to allow data to be easily managed and changed.
6.1.1 Primary and foreign keys
To link two or more related tables, the primary key of one table is stored in the other table(s) as a reference. The key is then called a foreign key in the latter table(s) .
The following illustrates an example from this project:
PURCHASE table
column attribute key
purno purchase number primary ( P)
supno supplier number foreign (F)
datesent date purchase form was sent daterec date goods were received
matno material number P,F
qty quantity ordered received quantity received
purno supno ·datesent daterec matno qty received
101 123 4-12-90 8-12-90 601 50 50
101 123 4-12-90 8-12-90 602 70 69
102 111 1-01-91 5-01-91 601 80 80
Each purchase of anyone type of material from a
supplier has a unique number. Tne combination of purno and matno is unique to each row in the table and therefore
functions as a primary key. Matno and supno are themselves primary keys in the material and supplier tables
respectively, but are foreign keys in the purchase table.
6.1. 2 Flat table
the repeating group in the PURCHASE table. As a result, the table is called a 'non-flat table' (see illustration below) .
purno daterec received
For sound database design, all tables must be reduced to two dimension or flat tables. The above PURCHASE table should thus be converted into two separate flat tables:
PURCHASE table PUR SUP table
column key column key
purno P purno P,F
matno P,F supno P,F
qty datesent
received daterec
Tables that are flat are said to be in a normal form. The tables in this project had all been converted into normal form. (For details of the different degrees of normal forms, please see Appendix G) .
6.1.3 Duplicated data
Within the column, there should not be any redundant data. This is data that can be deleted without information being lost. Redundancy is unnecessary duplication. All tables should be checked for this redundancy.
For example, in the PURCHASE table,
purno 101 101 102
matno 601 602 601
qty
50 70 80
received
50 69 80
PUrno value of 101 and matno value of 601 are necessary duplication. Deletion of any of these values will mean that the purno-matno relationship will not be complete. There is no redundancy in this table.
6.1.4 Normalisation processes
The finalised columns and tables are shown in appendix H. Some columns, like the calcula~ion columns, were added to the tables for computation purposes, at the SQL*Forms designing stage. More normalisation processes are described below to show the construction of some of the tables.
and have columns in the BOM table were primary keys as well as foreign keys. They represented respectively the IIparent" and "child" in a relationship. For example,
BOM table INVNO 19533 19533
HAVE
9500 9505
QTY
4
3
This meant, inventory 19533 have 4 of inventory 9500 and 3 of inventory 9505.
In the unit-MPS 'relationship, .unit number was the
primary key to both tables of unit and MPS. The unit table had the unit number column and attributes associated with the units (for example, unit's name, packaging time for unit, etc.). The MPS table had the unit number column and columns representing the weekly buckets of planned and
committed quantities of unit. Clearly the unit number was a redundant column. To remove the redundant column, the unit and MPS tables were merged into a larger MPS table.
.For instance in the factory capacity table, the following information was provided :
Process
90
91 1
2
Name
Packaging-local Packaging-o.s. Machine # 1 Machine #: 2
. WeekI Week2 Week3 ...•
The columns weekI, week2, week3 etc. were where the available capacity for the week was kept.
6.1.5 SQL*Plus
Tables were constructed by using commands in SQL*Plus. The CREATE TABLE command was used to specify
- the name of the table, - the name of each column,
- the format of each column, which includes
- the type of data stored (number, character or date) ,
- the column width, and
- whether or not the column must have a value in it.
For example,
CREATE TABLE pur_sup
(purno number(6) not null, supno number(3) not null, datesent date,
daterec date)
New columns could be added to a table easily by using the ALTER TABLE command. Deletion of column was also easy but not as straightforward. The CREATE TABLE, SELECT, DROP and RENAME commands were needed to do the job. With these commands, there was great flexibility to alter the structure of the database, no matter how much data had already been stored. With a good relational design, additional modules could be integrated easily into the database.
data required multiple INSERT commands. A faster way was to use the SQL*Forms default settings to create fields
corresponding to the columns in the table and insert data through the form.
6.2 Building the User.Interface
6.2.1 Building the forms
(SQL*Forms has special terminology which is used here. Please refer to appendix F)
SQL*Forms represented the interface between the database and the users of those data. The design of the
forms followed closely what had been described in the data flow diagrams. Seven forms with a total of twenty four pages were designed to meet the needs of this system.
MASTER form
The weekly production scheduling is done in this form. Page 1 presents the MPS. Values in the P and C fields are the planned and committed quantities of units respectively (figure 16). The ACT field displays the remaining quantities of units that have to be produced to match the planned quantities in the present week. At the end of the week, a negative value indicates that the
production for that unit has fallen below the planned figure. While a positive value indicates over
production.
with demand predictions on hand, user can update the MPS in page 1 (figure 16). User then move on to pages 2 and 3 to check whether the schedule places a realistic demand on the factory processes and ordering of
materials. Negative values in the AVAIL fields in page 2 indicate that the processing time demanded by the
schedule exceeds the maximum capacity allowable (figure 17). A positive value shows the available capacity in that process.
In page 3 user can scroll down the rows to see whether or not there is any material that has an order release in the WEEKO field (figure 18). This indicates that the material should have been ordered earlier than the present week in order to support the current
User can amend the MPS in page 1 to make i t more realistic. Exit from the form can be executed in page 3
(figure 18). Page 4 is created to enable user in the CAPACITY form to access a trigger in this form which compute the order releases of materials (figure 19).
MASTER PRODUCTION SCHEDULE
t---t---t---t---t---t
Ji 1 j j f j
I I 2B-MAY-90_ I 04-JUN-90_ f ll-JUN-90_ f 18-JUN-90_ •
i i OVERSEA LOCAL. OVERSEA LOCAL i OVERSEA LOCAL i OVERSEA LOCAL j
UNIT~O ACT, PCP C i PCP C i PCP C I PCP C i
9500 -901 50. 0 __ 40_ 20_1 55_ 0 __ 40_ 8 __ , 50_ 0._ 15_ 0 __ , 55_ 0 __ 15_ 0 __ , 9505 __ -90, 50_ 0 __ 40_ 15_, 55_ 0 __ 40_ 0 __ " 50_ 0 __ 15_ 0 __ 1 55_ 0 __ 15_ o __ 1
9520 -90. 50_ 24_ 40_ 0 __ 1 55_ 6 __ 40_ o __ 1 50_ 0 __ 15_ 0 __ , 55_ 0 __ 15_ 0 __ ,
______ ___ H ____________ J ____________ , ____________ , ___________ _
______ ___ I ____________ 6 ____________ , _________ ___ I ____________ I _________ ' _________ ___ i ____________ " ____________ , _________ ___ E
_________ a ____________ i ____________ I ____________ , ____________ , _________ 6 ________ • ___ i _________ ___ i _________ ___ , ____________ i
Ii H iI a
,
•
is I H i j i j it---t---t---t---t---t
SCHEDULE NEW WEEKFigure 16 Page 1 of Master form
t---t
J CHECK CAPACITY AND MATERIAL 'J __ R "
Ii REQU I REME~n if
t---t---t---t---t---t
i 9 2B-MAY-1990 iI 04-JUtH990 i ll-JUN-1990 i 18-JUN-1990 I
iI I 11 D il
il 11 AVAIL is AVAIL i AVAIL AVAIL
..
sPACK I 3.125 JI 3.021 I 3.646 Ii 3.542 f
,HACHINElli 2.583 i 2.361 i . 3.194 f 3.056 .II
iMACHINH2i 3.229 3.021 Ji 3.646 » 3.542 B
i II II /I /I j
g II 9 f JI iI
II i i f I r
Ii g I a jj
is i i if jj 1
t---+---~----f---t---t---t
+---HATERIAL-REQUIREMENT---+ II /I ii Ii I /I i i I if Ii i II MATNO 1070 1070 __ 1070 __ 1070 __ 1080 __ 1080 __ 1080 __ lOBO 1090 __ 1090 109o __ 109o __ DESCRIBE
req ____ _
dev ____ _ del
or _____ _
req ____ _
dEY
del
or
req ____ _ de'll del
or
WEEKO
0 ____ _
WEEKI
80.5 __
70 ___ _ B7.4 29.325 14.425 39.1 WEEK2 87.4 __
°
0 ____ _ 59.8 __
32.775 0 ____ _
,0
oJ.J. ___ _
24.15_
43.7
0 ____ _ 0 ____ _
29.9 __
WEEK3
59.8 __
0 ____ _
0 ____ _ 64.4 __
22.425
o
0 ____ _ 0 ____ _
WEEK4
b4.4 __
°
29.9__ 32. 0_____ 0 ____ _
° °
---32.2__ 0 ____ _
iI il il I I Ii i if jj i i iI i I I +---+
i EXIT: I
i
• RESTORE COMMITED CAPACITY DATA i
+~---+
Figure 18 Page 3 of Master form
+---+
I I
i1 CALCULATE MATERIAL REIlUIREHErn f
+---+
CREORDER form
The CREORDER and. CAPACITY forms are designed for order processing. Page 1 of CREORDER form is for entering order's data (figure 20). A trigger at the PRODNO field checks that the product number is a valid one. A message will appear at the bottom of the page for an invalid product number.
On entering page 2 (figure 21), a trigger will
process the order's data and display the computed values. Any changes to the orders can be made. in page 3 (figure
22) •
t---ORDER'S-PARTICULARS---T
i
i
i
LID REQDATE 07-J Ull-90
i
•
Ii
If ORDERND 109 __ CUSTOMER far Iller's __ i
I i
t---t
INPUT PRODUCT AND QUANTITY
+---+
I DRDERNO PRODNO NAME P9T'1 I
I 109
----
19533--
LUNCH BOX 51012,611*3 ______ 10 --- IJif 109 ---- 9~?~ J~J
---
Ii---
---JI H
---~---
---Ii il
---
---;; i
---
---If i
---
---If iI
---
---_
..._-g if
---
---I iI
---