
warwick.ac.uk/lib-publications
Permanent WRAP URL:
http://wrap.warwick.ac.uk/111555/
Copyright and reuse:
This thesis is made available online and is protected by original copyright.
Please scroll down to view the document itself.
Please refer to the repository record for this item for information to help you to cite it.
Our policy information is available from the repository home page.
SINGLE CRYSTALS BY X-RAY TOPOGRAPHY
by
Michael Dudley
A thesis submitted to the Department of Engineering Science, University of Warwick, in accordance with the requirements
for the degree of Doctor of Philosophy.
Page
Chapter 1: Literature Review 1
1 . 1 Introduction 1
1 . 2 Stress Strain Curves 3
1.2 . 1 Pure Iron 3
1.2 . 2 Alloys of Silicon in Iron 4
1.2.3 Interpretation 5
1.3 Slip Line Morphology 10
1.3.1 Pure Iron 10
1.3.2 Alloys of Silicon in Iron 1 1
1.3.3 Interpretation 13
1.3.4 Glide Band Velocity 14
1.3.5 Glide Band Formation 15
1.4 Electron Microscopy 17
1.4.1 Pure Iron 17
1.4.2 Iron Silicon Alloys 18
1.4.3 Interpretation 19
1.4.4 Low Temperature 20
1.4.5 High Temperature 27
1.4.6 Transition Region 28
1.5 Slip Geometry 29
1.5.1 Pure Iron 30
1.5.2 Alloys of Silicon in Iron 32
1 . 6 Surface Orientation Effects 34
1.7 Low Screw Mobility 36
1 . 8 Nucleation 44
1.8.1 Nucleation - Theoretical Approach
1.8.2 Effects of Stress Concentration 49
Chapter 2: Apparatus 53
2.1 Precision Laue Camera 53
2.2 Lang Cameras 54
2.3 X-ray Generators 56
2.4 Tensile Testing Machine 56
2.5 Synchrotron X-ray Sources 57
2.5.1 Power 59
2.6 Factors Affecting Resolution 63
2.6.1 Classical X-ray Topography 64
2.6.2 Resolution in White Beam Synchrotron
Radiation Topography 65
2.7 Direct Viewing of X-ray Topographs 70
Chapter 3: Experimental Techniques 74
3.1 Materials 74
3.2 Crystal Preparation 74
3.2.1 Shaping 74
3.2.2 Mechanical Polishing 74
3.2.3 Chemical Polish 75
3.2.4 Anneal 75
3.2.5 Etch Pitting 76
3.2.6 Mounting of Specimens 76
3.3 X-ray Topography 77
3.3.1 White Beam Techniques 78
4.1 Conditions usually met in Lang and
Synchrotron White Beam Topography 83
4.2 Kato's Eikonal Theory 85
4.3 Essential Phenomena 88
4.3.1 Anomalous
Transmission-Borrmann Effect 88
4.3.2 Interbranch Scattering or Creation
of New WavefieIds 89
4.3.3 Pendellosung Phenomena 90
4.4 Dislocation Images 91
4.4.1 Dynamical Image 92
4.4.2 Intermediate Image 93
4.4.3 Direct Image 94
Chapter 5: X-ray Topographic Interpretation 96
5.1 Contrast from Ferromagnetic Domains in
(100) Surface Fe 3.5 wt % Si Single Crystals 97
5.1.1 180" {001} walls 98-'
5.1.2 90» {110} walls 98
5.1.3 Contrast in Reflections such that
g.AMjiO 98
5.1.4 Junctions of Domains 100
5.2 Contrast from Magnetic Domains in (Oil)
Surface Fe Si Single Crystals 101
5.3 Dislocation Contrast 102
5.4 Precipitate Contrast 103
5.5 Grain Boundary Contrast 1°3
5.6.1 Specimens of (100) Surface xo5
5.6.2 Specimens of (oil) Surface 105
5.7 Image Distortion due to Lattice Rotation Effects 106
5.8 Luders Band Contrast 106
Chapter 6: Experimental Results 107
6.1 Crystal Cl (T=[011], N=[100]) 107
6.1.1 Projected Geometry 107
6.1.2 Projected Thicknesses 108
6.1.3 Exit Surface Effects 109
6.1.4 Slip Line Morphology and
Propagation Evidence 110
6.1.5 Lattice Rotation 111
6.1.6 Luders Band Observations and Rotation
Boundary Contrast 112
6.1.7 Nucleation Evidence 112
6.2 Crystal C2 (T=[011], N*[100]) 113
6.2.1 002 Main Spot Geometry 114
6.2.1a Projective Properties 114
6.2.1b Exit Surface Effects 115
6.2.1c Slip Line Morphology and Evidence for
Propagation 115
6.2.Id Nucleation Evidence 116
6.2.2 Oil Main Spot Geometry 117
6.2.2a Projective Properties 117
6.2.2b Exit Surface Effects 117
6.2.2c Slip Line Morphology, Propagation Evidence
6.2.3 oil Main Spot Geometry 118 6.2.4 Double Crystal Synchrotron Topographs 118
6.2.5 Lang Topographs 120
6.2.6 Summary of Evidence for Cl and C2 120
6.2.7 Etch Pitting 121
6.3 Crystal C3 (T-[011] , N «[0U] 121
6.3.1 White Beam Results from DCI, LURE 122
6.3.1a Projected Geometry 122
6.3.1b Projected Widths 122
6.3.1c Exit Surface Effects 125
6.3.Id Slip Line Morphology and Propagation
Evidence 126
6.3.1e Nucleation Evidence 126
6.3.If Intersection of Slip Systems 127
6.3.1g Lattice Rotation Effects 127
6.3.2 Video Stills 127
6.3.2a Projective Properties 127
6.3.2b Exit Surface Effects 128
6.3.2c Evidence for Nucleation 129
6.3.2d Evidence for Propagation 131
6.3.2e Lattice Rotation Effects 132
6.3.3 Lang Topographs 132
6.3.4 White Beam Topographs taken after
Deformation (SRS Daresbury) 133
6.3.4a 211 Main Spot Geometry 133
6.3.4b 222 Main Spot Geometry l34
Chapter 7: Discussion 135
7.1 Factors Influencing Choice of Slip System 135
7.2 Specimens Cl and C2 138
7.2.1 Slip Morphology 139
7.2.2 Nucleation 142
7.2.3 Propagation 143
7.2.4 Contrast from Slip Cells 144
7.2.5 Effects at Exit Surface 146
7.2.6 Effects at Entrance Surface 147
7.2.7 Extent of Borrmann Effect 147
7.2.8 Effect Due to Diffraction from the
Specimen Edge 148
7.2.9 Lattice Rotation 149
7.2.10 Grip Effects 150
7.2.11 Luders Band 154
7.3 Specimen C3 155
7.3.1 Operative Slip Systems 155
7.3.2 Slip Morphology 155
7.3.3 Nucleation 156
7.3.4 Evidence for Precipitates in C3 157
7.3.5 Propagation 159
7.3.6 Contrast 160
7.3.7 Conclusions 163
Appendix Is Magnetic Studies 167
(I) - 1 Basic Domain Physics 167
1.1 Energy Considerations 167
1.1a Magnetocrystalline Anisotropy
Energy 16 7
1.1b Exchange Energy 168
1.2 Domain Walls 16g
1.3 Closure Domains 26 8
1.4 Magnetostriction 26 9
(I) - 2 Magnetic Domain Configurations in
Crystals C2 and C4 ^ 7 0
2.1 Predeformation Magnetic Domain
Structures ^ 70
2.2 Stress Induced Changes in Magnetic
Domain Structure 2 72
2.3 Residual Magnetic Domain Structures
in C2 2.73
(I) - 3 Magnetic Domain Configurations in C3 2 74
3.1 Unstressed configuration 274
3.2 Stress Induced Structures 278
3.3 Contrast of Defects 282
Appendix II: Projective Properties of Laue
Topographs 185
1 Introduction 185
2 Reference Axes 186
3 Position of the Spots and
Operative Wavelength 189
4 Trace of the Plane of Incidence 191 5 Projection of a Crystallographic
Direction [u,v,w] and Magnification
Ratio 1 9 2
6 Projection of a Crystallographic Plane other than the Reflecting
7 Conclusion 1 9 6
8 Calculations Pertaining to the Specific Geometry Illustrated
in Fig 122 1 9 7
8.1 Position of the Spots 1 9 7
8.2 Trace of the Plane of Incidence 1 98
8.3 Projection of a Crystallographic
Direction 198
8.4 Projection of a Crystallographic
Plane) Projected Width 199
Appendix III: Intensity Calculations 202
1 Introduction 202
2 Borrmann Absorption Coefficient 203
3 Optimization of Choice of
Operative Wavelength 208
4 Calculation of Effective Misorientation and Deformation
For many years the Flastic Deformation of bcc metal crystals has formed the subject of numerous investigations comprising a wide range of experimental techniques. One of the more recent and novel of these techniques is Synchrotron White Radiation Topography. This is well suited for
examination of relatively large areas of comparatively thick crystals, without the need for undesirably long
exposure times (as encountered, for example, in conventional topography), typical values being of the order of seconds, making dynamic, in situ experiments feasible.
In this study, Synchrotron White Radiation Topography was used to make in situ, dynamic observation of the evolution of slip bands in single crystals of Fe 3.5 wt % Si (of rectangular cross-section) with two different surface orientations under uniaxial tensile stress in the [Oil] direction. Both types of crystal were oriented for double slip, in one
the primary Burgers vectors lying in the crystal surface, and in the other the primary Burgers vectors lying at an angle of 35° 16' with the surface. Slip morphology in particular, was found to be a sensitive function of surface orientation.
The studies reported in this thesis form a continuation of the work reported in Miltat and Bowen ([32]), and demonstrate the usefulness of the technique in studies of this nature.
Important information on the early stages of deformation and the progress of slip was obtained.
In Chapter 1 a brief review of the type of work that has already been conducted on bcc metals is presented, with particular reference to Iron and its alloys with Silicon.
Chapter 2 presents a description of the apparatus used throughout the work, including a detailed description of synchrotron X-ray sources, and the sophisticated direct imaging equipment essential for dynamic experiments.
The basic experimental approach adopted is outlined in Chapter 3.
Chapters 4 and 5 comprise a brief review of contrast theory in X-ray topography, and how this theory can be applied to interpret topographs.
Experimental results are presented in Chapter 6, and these results are discussed in detail in Chapter 7.
A brief description of the effect of stress on the magnetic domain configurations in the specimens is given in Appendix I.
Details of a calculation conducted with J. Miltat ([225]) on the projective geometries of white beam topographs are presented in Appendix II.
Figure Title Page
Chapter 1
1 Shear stress-shear strain curves of Iron single crystals oriented for single slip, measured in tension at
various temperatures 3
2 Shear stress-shear strain curves
for single crystals of Fe 0.5 wt % Si 4
3 Shear stress-shear strain curves for
single crystals of Fe 0.9 wt % Si 4
4 Schematic representation of the Critical Resolved shear stress (CRSS) versus
temperature curve. 5
5 The CRSS for Fe, Fe 0.5 wt % Si, Fe 0.9 wt % Si and Fe 3 wt % Si as a function of (a) Temperature and
(b) Silicon content 7
6 Comparison of the temperature de
pendence of the 0.3% offset yield strength in bending and in tension with the temperature dependence of the stress to produce a constant dislocation velocity for two different
constant velocity levels 10
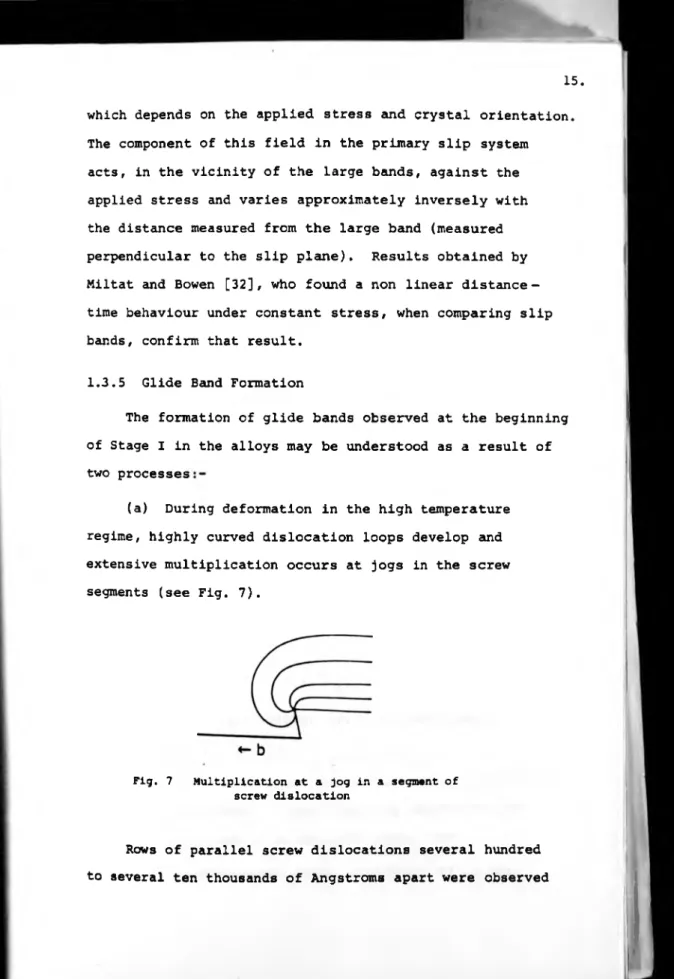
7 Multiplication at a jog in a segment
of screw dislocation 15
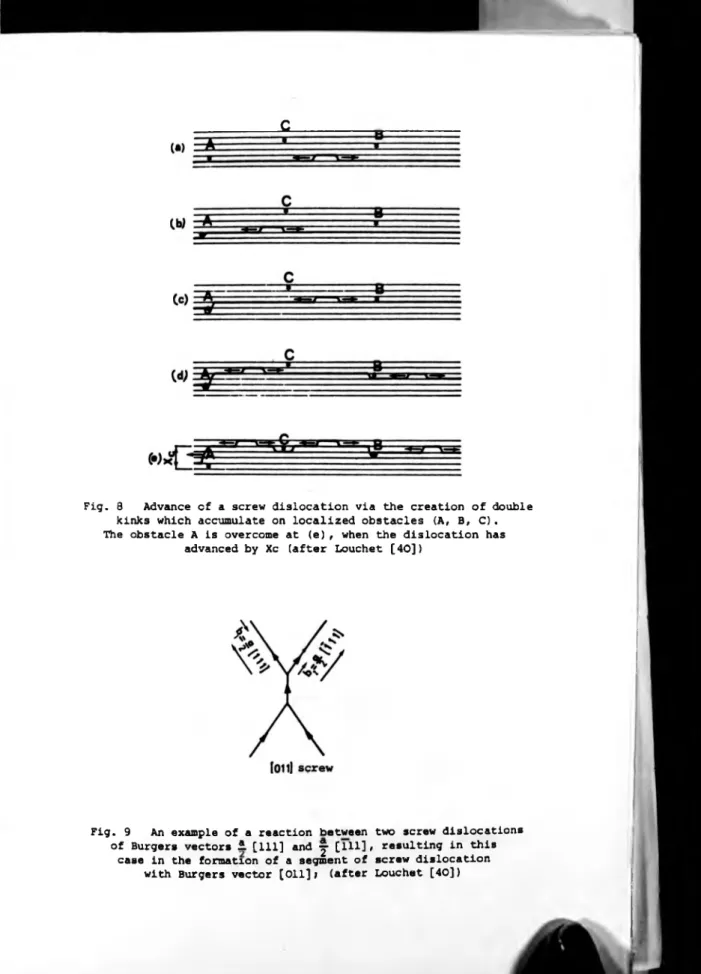
8 Advance of a screw dislocation via the creation of double kinks which
accum-mulate on localized obstacles 21
9 An example of a reaction between two
screw dislocations 21
10 Interaction of a dislocation with (for
example) a precipitate 21
11 Propagation of the loop forming mechanism 22
12 Interaction of a jogged dislocation with
a moving dislocation 23
13 Interaction of an edge dislocation with
14 Interaction of a screw dislocation with a row of prismatic loops
24
15 Slow, fixed dislocation source mechanism 25
16 Rapid, fixed dislocation source mech
anism 25
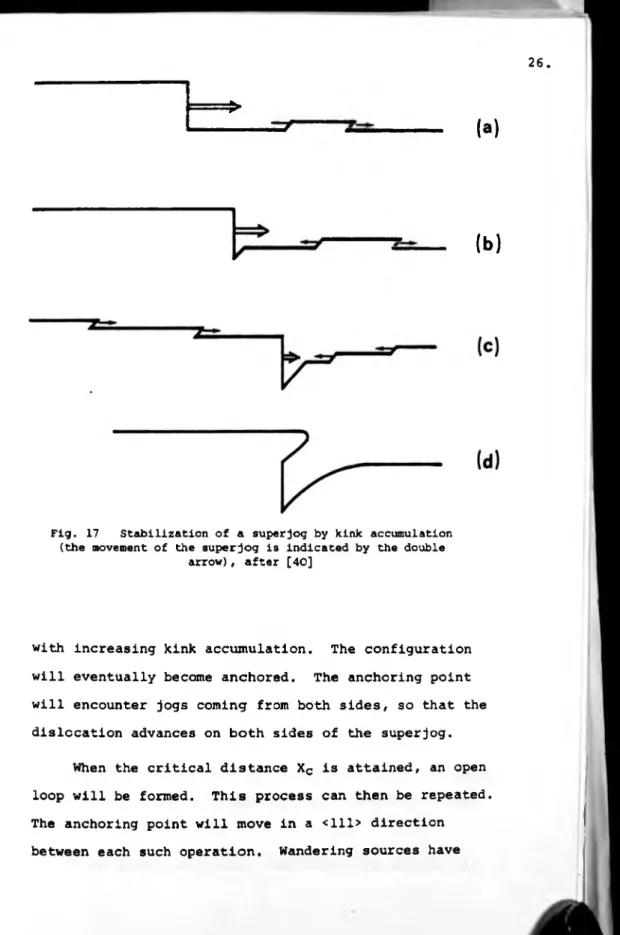
17 Stabilization of a superjog by kink
accummulation 26
18 [1 1 1] stereographic projection illustrating the significance of
Y-X curves 29
19 Crystal orientations investigated by
Spitzig 31
20 Model for motion of dislocation
dissociated on {1 1 0} planes 38
21 Similar model for stress assisted, thermally activated glide of screw dislocation dissociated on {1 1 2}
planes 39
22 Projection of bcc structure along [111] 41
23 Schematic diagram of a prismatic dis
location loop in a crystal 48
24 Glide of a prismatic loop under shear
stress 48
25 Volume indentation by a larger
precipitate 50
26 Volume indentation by a harder
precipitate 51
Chapter 2
27 Photograph of purpose built Pre
cision Laue Camera 54
28 The essential components of a Lang
camera 54
29 Photograph of the Warwick Lang Camera 55
30 Photograph of the Tensile Stage
31 32 33 34 35 36 37
38 •
39 40 41 Chapter 42 43 44
Angular spread in a Synchrotron The three components of vertical divergence
The variation of the average in cidence angle along the horizontal dimension of the sample
Dependence of the polarization of synchrotron radiation on the angle
against the electron orbit
Partially Integrated Intensity curve for DCI LURE, and SRS Daresbury Definition of parameters affecting vertical resolution in conventional X-ray topography
Definition of experimental parameters contributing to geometrical resolution in White Beam topography
Behaviour of geometrical resolution as a function of 2 0, when the de tector is perpendicular to the im pinging beam
The Du Mond diagram for White Beam topography
Schematic diagram of TV system The number of photons per square micron required in order to resolve features of a given size at various contrast levels
Orientations of specimens studied Lang topographs taken of C2 after first anneal (a) g ■
oTl,
Ag Ka radiation (b) g *oTl,
Mo Ka rad iation and after second anneal(c) g ■ Oil, Mo Ka radiation
45 Reproduction of a plate taken of
Cl in the
oTT
main spot geometry 7946 Reproduction of
in the 00? main
a plate taken of spot geometry
C2
80
47 Reproduction of
in the Oil main
a plate taken of spot geometry
C2
81
48 Reproduction of
in the
oTT
maina plate taken of spot geometry
C3
82
49 Du Mond diagram
topography
for double crystal
83
Chapter 4
50 Illustration of the zones of black and white contrast as a function of deformation gradient and
absorption 88
51 Integrated plane wave intensity as a function of thickness in the
Laue case 91
Chapter 5
52 Geometry of {110} 90° wall
53 Schematic diagram illustrating the sensitivity of the projection of a slip plane to diffraction geometry 54 Schematic diagram of lattice
rotation induced in order to compensate for slip
101
105
106
Chapter '
55 A series of White Beam main spot topographs taken of crystal Cl at various increasing levels of stress 56 Lang topograph taken of Cl, g *
oTl,
Mo Ko radiation, taken before de formation
57 A series of still photographs taken from the videotape recording of the
oTT
main spot during deformation at various increasing levels of stress108
108
Deformation history of Cl White Beam Synchrotron topo
graphs taken from the same plate _ as Figure 55b (a) g * o7o (b) g * 00?
(X - 0.9A)
Sketch of the projection on various reflections of the {2 1 1} plane intersections with the surfaces, and the <111> Burgers vectors, superimposed on the predicted image shapes, for crystal Cl in the oTT main spot geometry
Geometry of slip plane inter sections with the specimen sur faces in Cl
Orientation of slip direction with respect to the incident beam I0 , required for observed lattice rotation
White Beam Synchrotron topographs taken of C2 in the 007 main spot geometry, before deformation,
(a) g - golf, X ■ 1.8A (b) g * oTT, X = 1.95A
White Beam Synchrotron topographs taken of C2 in the 007 main spot geometry, after deformation,
(a) g ■ 007, X » 1.8A (b) g ■ o TT, X * 1.95a
Still photographs taken from the videotape recording of the 007 spot, from crystal C2 under de formation at various increasing levels of stress
White Beam topographs taken of C2 in the
oTl
main spot geometry(a) g -.Oil, X - 1A (b) g - 002, X ■ 0.5A
Some reflections taken from
oTT
main spot geometry (post de-formation) (a) g - 020, X ■ 0.9A (b) g - 007, X - 0.9A68 Details from OlT double crystal
topographs taken of C2 114
69 Detail from a Lang topograph
taken of C2 after deformation,
g * 722, A g Ka radiation 114
.70 The deformation history of C2 114
71 Reconstructed image shapes,
projected directions of Burgers vectors and projected directions of slip plane intersections with the surfaces in C2 (00? main spot
geometry) 115
72 Details from Figure 64 116
73
74
Predicted geometry of projections of slip planes and Burgers vectors
in the Oil main spot geometry 118
Detail of double crystal topograph (g * OlT, X • 0.85A) taken of C2 after deformation, and Lang topograph
(g * Oil, Mo Ka radiation) taken
before deformation 120
75 Plan of geometry of ?22 reflection
(Ag Ka radiation) 1 2 1
76 Details from optical micrographs
taken of the surface of C2, after
post deformation etch pitting 1 2 2
77 Predeformation Lang topograph of
C3, g » 200, Mo Ka radiation 1 2 2
78 Series of Synchrotron White Beam
topographs (g *
oTT
taken of C3 in theoTT
main spot geometry atvarious increasing levels of stress) 122 79 Series of still photographs taken
from the videotape recording of the
oTT
reflection in C3 under de formation at various increasinglevels of stress 122
80 Details from Lang topographs of C3 (a) g - 7 T T , Mo Ka radiation (b) g * 211, Mo Ka radiation (c)' g - 211, Mo Ka radiation (d) g ■ 2TTf Mo Ka
White Beam topocraohs of C3 taken at SRS Daresbury, in 222 main spot geometry (a) g ■ Oil. X = 1.18a
(b) g =.222, X = 0.6a (c) g = 211,
X = 0.8A 122
White Beam topographs of C3 taken at SRS Daresbury, In 2TT main spot geometry j_a) g » 222, X = 0.57A
(b) g * 211, X * 0.85A (c) g = 200,
X = 0.84A 122
Topographs from PIT main spot geometry for C3 (a) g = 211, X = 0 .6A (b) g * 211, X = 0^7A (c) g = 222, X - 0.63^ (d) g = 222, X = 0.68A (e) g = 233,
X = 0.52A (f) g *
231
, X * 0.55A 122 Optical micrograph taken of the exitsurface of C3 after deformation 123
Sketch of predicted image shapes for
C3 in the OlT main spot geometry 123
Enlargements of topographs from the
Oil main spot geometry for C3 124
Geometry of the Oil reflection for C3 126 An edge dislocation b x in itw slip
plane P,, being intersected by a parallel dislocation of different
Burgers vector b, in its slip plane P, 128
Classification of subgrains in C3 129
Stress history of C3 132
Plan view of geometry of TIT Lang
topograph 133
Definition of parameters used in calculating .orientation or Schmid
factors 135
Schematic diagram illustrating the various paths possible for dislocations
Figure Title Paqe
94 Possible mechanism for formation of
asymmetric slip cell 141
95 Schematic representation of lattice rotation induced on tensile
deformation
149
96 Plastic bending due to the influence
of the grips 151
97 Possible inhomogeneity in lattice
rotation 153
98 Schematic diagram of a source when
a single slip plane is favoured by
the stress 159
99 Mechanism of dislocation multiplication
when two cross-slip planes operate 159
100 Schematic view of orientation of
Burgers vectors to the crystal
surface 159
Appendix I
1 01 Minimisation of magnetostatic energy
by formation of closure domains 16 9
102 Illustration of the distortion
introduced in magnetic domains 170
103 Details from a Lang topograph taken
of C4 (g = Oil, Mo Ka radiation) 171
104 Schematic diagram of domain con
figurations observed in Figure 104a 171
105 Decomposition of 90° wall 171
106 Series of White Beam topographs
(g = 002,_X = 1.22Â) taken of C2 in the 002 main spot geometry at
various increasing levels of stress 172
107 Lang topograph and a series of White
Beam topographs (g = Q02, A = 1.79A) taken of C4 in the 002 main spot geometry at various increasing levels
108 Schematic diagram of initial and final magnetic domain configurations
in C2 under elastic stress 172
109 Schematic representation of surface
domains and closure domains in C3 175
1 1 0 Enlargement taken from Figure 77 177
1 1 1 Structure of internal flux closure
domains 177
1 1 2 Possible asymmetric chamfering in C3 177 113 Flux closure domains observed at the
edge of thin crystals 178
114 The Dijkstra and Martius model for
the stress induced magnetic domain
structure in C3 179
115 Series of White Beam topographs of
C3 taken in the Oil main spot geometry (g = OTT, \ = 1.96A) taken at various
levels of stress 180
116 Illustration of the correspondence of dark lines present on Oil topographs
to the magnetic structure 1 81
117 Model for Dijkstra and Martius type
II structure 183
118 Model for better distribution of
surface charge in the Dijkstra and
Martius type II structure 183
119 Depth of closure domains 183
Appendix II
120 Sample-detector geometry 186
1 2 1 Particular sample-detector geometry 188
122 Definition of s0 , and n 189
123 Definition of axes and angles in
Appendix III
124 Du Mond diagram for White Beam
topography
Table Title
I Activation energies for nucleating
slip as a function of critical radius 46 of slip
II Parameters of various Synchrotrons 57
III Projected thicknesses for crystal Cl 108
IV Projected_thicknesses for crystal C2
in the 002 main spot geometry 1 1 4
V Projected thicknesses for crystal C2
in the Oil main spot geometry 1 1 7
VI Projected thicknesses for crystal C3
in the Oil main spot geometry 1 2 3
VII Projected thicknesses for higher order reflections in the Oil main spot geometry
for C3 124
VIII Schmid factors and Vesely factors for
crystal C2 138
IX Vesely factors for crystal C3 1 5 5
X Percentage harmonic intensities for
crystal Cl in the
oTT
main spot geometry206
XI Percentage harmonic intensities incrystal C2 in the 002 main spot geometry 206
XII Percentage harmonic intensities in
crystal C2 in the Oil main spot geometry 207 XIII Percentage harmonic_intensities in
crystal C2 in the Oil main spot geometry 207 XIV Percentage harmonic intensities in
CHAPTER 1
[1] J.W. Christian^ Proceedings of 2nd Int. Conf. on strength of Metals and Alloys; Asilomar ASM pp29
(1970).
[2] P.B. Hirsch; Trans. Jap. Inst. Metals. Supp 9 (1968).
[3] R.A. Foxall, M.S. Duesbery and P.B. Hirsch, Can. J. Phys. 45 607 (1967).
[4] G. Taylor and J.W. Christian Phil. Mag 15 893 (1967).
[5] J.R. Low and A.M. Turkalo, Acta Met 10 215 (1962).
[6] E. Furubayashi, Trans. Jap. Inst. Metals Supp £ 939 (1968).
[7] E. Furubayashi, Journ. of Phys. Soc. Jap. 21_ 13° (1969)
[8] S. Takeuchi, E. Furubayashi and T. Taoka, Acta Met. 15 1179 (1967).
[9] D.K. Bowen, J.W. Christian and G. Taylor, Can. J. Phys. 45 903 (1967).
[10] D. Vesely, Phys. Stat. Sol. 29 675 (1968).
[11] A. Luft and L. Kaun, Phys. Stat. Sol. _37 781 (1970).
[12] M.S. Duesbery and R.A. Foxall, Phil. Mag. 20 719 (1969)
[13] C.J. Bolton and G. Taylor, Phil. Mag. 2£ 1359 (1972).
[14] A.J. Garratt-Read and G. Taylor, Phil. Mag. ¿3 577 (1976).
Stat. Sol. 26 485 (1968) .
[17] R.G. Garlick and H.B. Probst, Trans AIME 230 1120 (1964).
[18] F. Louchet, L. Kubin and D. Veselyi Proc. 4th Int. Conf. on Strength of Metals and Alloys; Nancy, France Vol. 1 171 (1976).
[19] V. Novak, K.Z. Saleeb, S. Kadeckova and B. Sestak, Czech. J. Phys. B26 (1976).
[20] A.S. Keh and Y. Nakada, Trans. Jap. Inst. Metals Supp. 9 876 (1968).
[21] J. Diehl and R. Berner, Z. Metallkde 51 522 (1960).
[22] R. Zeyfang, 0. Buck and A. Seeger, Phys. Stat. Sol.(b) 61 551 (1974).
[23] V. Novak and B. Sestak; Proc. 4th Int. Conf. on Strength of Metals and Alloys; Nancy (1976).
[24] N. Zarubova and B. Sestak, Phys. Stat. Sol.(a) 30 365, 479 (1975).
[25] L. Granas and B. Aronsson, Scr. Met. 2 541 (1968).
[26] D.F. Stein and J.R. Low Jr., J. Appl. Phys. 31 362 (1960)
[27] D.K. Bowen, D. Phil. Thesis, Oxford University (1966).
215 (1972).
[30] B. Sestak and V. Novak, Phys. Stat. Sol.(a) ¿3 703 (1974).
[31] B. Sestak and Z. Arnold, Phys. Stat. Sol. (a) 2_3 155 (1974).
[32] J. Miltat and D.K. Bowen, J. de Physique 40 389 (1979).
[33] JCM LL and C.D. Needham, J. Appl. Phys. 31 1318 (1960).
[34] P. Haasen, pp27 Physical Metallurgy, CUP Cambridge (1978).
[35] S. Libovicky', Electron Microscopy of Pure Iron Alloys, Proc, of Symp. on High Purity Materials in Science and Technology, Dresden (1980).
[36] T. Yamashita and Y. Nakada, Trams. Jap. Inst. Metals Supp. 9 465 (1968).
[37] K.F. Hale amd M. Henderson-Brown\ Proc. Roy. Soc. A310 479 (1969).
[38] A. Gemperle, M. Rozsival amd B. Sestak, Gech. J. Phys. B12 555 (1962).
[39] F. Louchet, L. Kubin and D. Vesely, Phil. Mag. A39 433 (1979).
[40] F. Louchet, These D'Etat, L'Université Paul Sabatier de Toulouse (1976).
[41] F.J. Humphreys and J.W. Martin, Phil. Mag. IjS 927 (1967).
Conf. on Strength of Metals and Alloys, Asilomar ASM (1970).
[44] E. Orowan, Discussion, Symp. on Internal stresses in metals and alloys (Inst, of Metals) London) 451 (1948).
[45] P.B. Hirsch, J. Inst. Metals £6 7 (1957). [46] F. Kroupa, Phil. Mag. J. 783 (1962).
[47] P.B. Hirsch, Phil. Mag. 7 67 (1962).
[48] G. Saada and J. Washburn, J. Phys. Soc. Japan, Suppl. 1 18 43 (1963).
[49] J.C. Grosskreutz and M.B. McNeil, Phil. Mag. 1£ 401 (1967).
[50] S. Mader, Z. Physik 149 73 (1957).
[51] S. Mader, A. Seeger and Ch. Seitz, J. Appl. Phys. 34 3368 (1963).
[52] B. Sestak and S. Libovicky. The Relation Between the Structure and Mechanical Properties of Metals, Teddington (1963).
[53] B. Sestak and S. Libovicky, Acta Metal, JL1 1190 (1963).
[54] B. Sestak and S. Libovicky, Czech. J. Phys. B13 266 (1963).
[55] G.I. Taylor) Proc. Roy. Soc A118 1 (1928).
[58] R.P. Steijn and R.M. Brick, Trans ASM 46 1406 (1954).
[59] D.F. Stein and J.R. Low, Acta Met. 14 1183 (1966).
[60] A.S. Keh and Y. Nakada, Can. J. Phys. £5 1101 (1967).
[61] T.E. Mitchell, Phil. Mag. 17 1169 (1968).
[62] M.S. Duesbery, Phil. Mag. 19 501 (1969).
[63] S. Argon and S.R. Maloof, Acta Met. 1£ 1449 (1966).
[64] S. Ikeda, J. Phys. Soc. Japan 27 1564 (1969).
[65] T. Takeuchi, Jap. J. Appl. Phys. 8 320 (1969). [66] T. Takeuchi, J. Phys. Soc. Japan 26 354 (1969). [67] B. Sestak and N. Zarubova, Phys. Stat. Sol. 10 239
(1965).
[68] F. Kroupa and V. Vitek, Can. J. Physics 45 945 (1967). [69] B. Sestak, N. Zarubova and V. Sladek, Cam. J. Phys.
45 1031 (1967).
[70] S.V. Afanasev and B.V. Molotilov, Fig. Metallov i Metallovedervie 27 111 (1969).
[71] J.W. Christian, Comments on Solid State Physics 1 19 (1968).
[72] F. Kroupa and V. Vitek, Phys. Stat. Sol. 36 K143 (1969).
[73] D. Vesely, Phys. Stat. Sol. 29 685 (1968).
[74] D. Vesely*, Proc. 3rd Int. Conf. on HVEM, Oxford (1973).
31 632 (1960).
[77] J.S. Koehler, Phys. Rev. 86 52 (1952).
[78] J.R. Low Jr. and R.W. Guard, Acta Met. 7 171 (1959)
[79] R.A. Foxall and C.D. Statham, Acta Met. 18 1147 (1970).
[80] P.B. Hirsch, (oral communication) J 5th Int. Congress of Crystallography (1960).
[81] F. Kroupa, Phys. Stat. Sol 3 K, 391 (1963).
[82] B. Escaig, J. de Phys. 27 C3, 205 (1966).
[83] B. Escaig, J. de Phys. 28 171 (1967).
[84] B. Escaig, Phys. Stat. Sol. 2J3 463 (1968).
[85] M.S. Duesbery, P.B. Kirsch, 'Dislocation Dynamics', Ed. A.R. Donenfeld, G.T. Hahn, A.L. Bernent,
R.I. Jaffe - McGraw Hill p57 (1968).
[86] J. Friedel, Internai Stresses and Fatigue in Metals (eds. G.M. Rassweiler and W.L. Grube)
Elsevier Publishing Co., Amsterdam-London-New York, p239, Princetown (1949).
[87] L.P. Kubin, Rev. Deform. Behav. Mater. 1 244 (1977)
[88] B. Sestak and J. Blahovec, Phys. Stat. Sol. 40 599 (1970.
28 475 (1968).
[91] B. Escaig, These, Fac. des Sciences d'Orsay (1968).
[92] V. Vitek, Phil. Mag. 18 773 (1968).
[93] V. Vitek, Phil. Mag. 21 1275 (1970).
[94] Z.S. Basinski, M.S. Duesbery and R. Taylor, Phil. Mag. 21 1201 (1970).
[95] M.S. Duesbery, V. Vitek and D.K. Bowen; Proc. Roy. Soc. A332 85 (1973).
[96] J.W. Christian and V. Vitek, Rep. Prog. Phys. 33 307 (1970).
[97] D.A. Smith and K.M. Bowkett, Phil. Mag. 18 1219 (1968).
[98] D.A. Smith and J. Gallot, Metal Sci. Journal 3 79 (1969).
[99] J.T. Lynch, G.K.L. Cranstcun, D.A. Smith and G.D.W. Smith, Nature 223 637 (1969).
[100] D.A. Smith and V. Vitek, unpublished work.
[101] R. Chang, Phil. Mag. 16 1021 (1967).
[102] R. Bullough and R.C. Perrin, Dislocation Dynamics, Batelle Colloquium (Eds. A.R. Rosenfield, G.T. Hahn, A.L. Bernent and R.I. Jaffee) pl75, New York;
McGraw-Hill (1968).
Fundamental Aspects of Dislocation Theory, p305 Washington! US National Bureau of Standards (1969).
[105] P.C. Gehlen, J. Appl. Phys. 41 5165 (1970).
[106] V. Vitek, R.C. Perrin and D.K. Bowen, Phil. Mag 21 1049 (1970).
[107] L.L. Boyer and J.R. Hardy, Phil. Mag. 24 647 (1971).
[108] C. Wuthrich, Phil. Mag. 35 325 (1977).
[109] Z.S. Basinski, M.S. Duesbery and R. Taylor, Can. J. Phys. 49 2160 (1971).
[110] V. Vitek, Cryst. Latt. Defects !3 1 (1974 ).
[111] V. Vitek, Proc. Roy. Soc. A352 109 (1976).
[112] Z.S. Basinski, M.S. Duesbery and R. Taylor, Interatomic Potentials and Simulation of Lattice Defects, Battelle Colloquium (Eds. P.C. Gehlen, J.R. Beeher Jr. and R.I. Jaffee) p537, New York and London! Plenum Press (1971).
[113] P.C. Gehlen, Interatomic Potentials and Simulation of Lattice Defects, Battelle Colloquium (Eds. P.C. Gehlen, J.R. Beeler Jr., and R.I. Jaffee) p475 New York and London! Plenum Press (1971).
[114] B. Escaig, Scripta Metal 5 199 (1971).
[115] A. Seeger and B. Sestak, Scripta Metall 5 875 (1971).
[118]
[119]
[
120
]
[
121
]
[
122
]
[123] [124] [125] [126] [127] [128] [129] [130] [131] [132] [133] [134] [135]
A. Sato and M. Meshii, Acta Met. 21 753 (1973).
L. Kubin and F. Louchet, Acta Met. 21_ 337 (1979).
A. Seeger, Phys. Stat. Sol. J55 (No.2) 457 (1979).
W. Frank and B. Sestak, Scripta Met. 4 451 (1970).
A.H. Cottrell, Dislocations and Plastic Flow in Crystals, Oxford (1953),
J. Friedel, Dislocations, Pergammon Press (1964).
F. Seitz, Adv. Phys. 1 43 (1952).
F. Seitz, Phys. Rev. 88 722 (1952).
D. Kuehlroan-Wilsdorf, Phil. Mag. 3 125 (1958).
R. Grilhe, Acta Met. 11 56 (1962).
D.A. Jones and J.W. Mitchell, Phil. Mag. 3 I, 334 (1958).
D.J. Barber, K.B. Harvey and J.W. Mitchell, Phil. Mag. 2 704 (1957).
A.S. Parasnis and J.W. Mitchell, Phil. Mag £ 171 (1959).
J. T. Bartlett and J.W. Mitchell, Phil. Mag. 3 334 (1958).
A. Fourdeux and A. Berghezan, Compt. Rend. 252 1462 (1961).
J.S. Lally and P.B. PartridgeProc. 5th Int.
Conf. on Electron Microscopy, Philadelphia ^ 5112 (1962
J.E. Bailey, Acta Met. 11 267 (1963).
[137] J.J. Gilman, J. Appi. Phys. 30 1584 (1959).
[138] D.M. Marsh, Phil. Mag. 5 1197 (1960).
[139] D.K. Bowen and M. Dudley, to be published.
[140] D.K. Bowen and J. Miltat, J. Phys. E: Scientific Instruments 9 868 (1976).
[141] Synchrotron Radiation Techniques and Applications, Topics in Current Physics, Voi. 10, ed. C. Kunz, Springer-Verlag Berlin, Heidelberg, New York (1979)
[142] U. Bonse, Characterization of Crystal Growth Defects by X-ray Methods, p298 eds. B.K. Tanner and D.K. Bowen, Plenum (1980).
[143] M. Sauvage and J.F. Petroff, Synchrotron Radiation Research, p607 ed. H. Winick and S. Doniach,
Plenum press (New York and London) (1980).
[144] J. Schwinger, Phys. Rev., 75 798 (1949).
[145] J. Schwinger, Phys. Rev. 75 1912 (1949).
[146] D.H. Tomboulian and P.L. Hartman, Phys. Rev. 102 1423 (1956).
[147] J.D. Jackson, Classical Electrodynamics, John Wiley New York, London, Sydney, Toronto, p76 (1975).
Defects by X-ray Methods, p216, eds. E.K. Tanner and D.K. Bowen, Plenum (1980).
[150] T. Tuomi, K. Naukkarinen and P. Rabe, Phys. Stat. Sol. (a) 25 93 (1974).
[151] M. Hart, J. Appl. Cryst. 8 436 (1975).
[152] J.F. Petroff and M. Sauvage, J. Cryst. Growth 43 628 (1978).
[153] J. Chikawa and I. Fujimoto, Appl. Phys. Lett. 13 No. 11 387 (1968).
[154] G.A. Rozgonyi, S.E. Haszko and J.L. Statile, Appl. Phys. Lett. 16 No. 11 443 (1970).
[155] J. Chikawa, I. Fujimoto and Takao Abe, Appl. Phys. Lett. 21 No. 6 295 (1972).
[156] J. Chikawa, J. Cryst. Growth 24/25, 61 (1968).
[157] W. Hartmann, G. Markc:witz, V. Rettenmaier and H.J. Queisser, Appl. Phys. Lett. 27 Ko. 5 308
(1975).
[158] A.R. Lang in Diffraction and Imaging Techniques in Materials Science, Volume II] Imaging and Diffraction Techniques, Second Revised Edition (ed. S. Amelinckx, R. Gevers and J. Van Landuyt) North Holland
publishing Company, Amsterdam-New York-Oxford p623 (1978).
Defects by X-ray .Methods, p433 eds. B.K. Tanner and D.K. Bowen, Plenum (1980).
[161] J. Bradler, Private communication.
[162] R.W. James, The Optical Principles of the Diffraction of X-rays, G. Bell and Sons, London (1950).
[163] B.W. Batterman and H. Cole, Rev. Mod. Phys. ¿6 No. 3 681 (1964).
[164] N. Kato, Acta Cryst. 13 349 (1960).
[165] N. Kato, J. Phys. Soc. Jap. 18 1785 (1963).
[166] N. Kato, J. Phys. Soc. Jap. lj) 67 and 171 (1964).
[167] N. Kato, 'X-ray Diffraction', Ed. L. Azaroff, McGraw-Hill, New York (1974).
[168] N. Kato, The Characterization of Crystal Growth Defects by X-ray Methods, p264, Ld. B.K. Tanner and D.K. Bowen, Plenum (1980).
[169] N. Kato, Acta Cryst. 1£ 526 and 627 (1961).
[170] Y. Ando and N. Kato, J. Appl. Cryst. £ 74 (1970).
[171] A. Authier and F. Balibar, Acta Cryst. A26 647 (1970).
[172] G. Borrmann, Z. Physik £2 157 (1941).
[173] G. Borrmann, Z. Physik 127 2971 (1950).
[176] Y. Epelboin, These, Université de Paris, CNRS AO 9961 (1974).
[177] M. Schlenker, These, Dtetat Université de Grenoble (1970).
[178] M. Polcarova and A.R. Lang, Proc. Roy. Soc. A285 297 (1965).
[179] M. Hart, PhD Thesis, University of Bristol (1963).
[180] M. Hart and A.R. Lang, Acta Cryst. A16 102 (1963).
[181] A. Authier and M. Sauvage, J. de Physique 21_ C3-137 (1966).
[182] N. Kato, K. Usami and T. Katagawa, 'Advances in X-ray Analysis', Vol. 10, Eds. J.B. Newkirk and G.R. Mallet p46, Plenum Press, New York (1967).
[183] J.I. Chikawa, J. Appl. Phys. 3496 (1965).
[184] J. Miltat and D.K. Bowen, J. Appl. Cryst. 8 657 (1975).
[185] J. Miltat, These D'Etat, Université de Paris-Sud (1976).
[186] M. Kleman and J. Miltat, Proc. Int. Summer School o’- X-ray Dynamical Theory and Topography, B13 Limoges (1975).
[187] G. Rieder, Abhandl. Braunshweig Wiss. Ges. 11 20 (1959).
[188] F. Kroupa and I. Vagera, Czech J. Phys. B19 1204 (1969).
635 (1967).
[191] M. Polcarova and A.R. Lang, Phys. Stat. Sol (a) 4 491 (1971).
[192] M. Polcarova, Z. Naturforsch. 28a 639 (1973).
[193] M. Schlenker, P. Brissonneau and J.P. Perrier, Bull. Soc. Fr. Mineral. Crist. 91 653 (1968).
[194] M. Polcarova and J. Gemperlova, Phys. St. Sol. 32 769 (1969).
[195] J. Miltat, The characterization of Crystal Growth Defects by X-ray Methods, p576, Ed. B.K. Tanner and D.K. Bowen, Plenum (1980).
[196] J. Miltat and M. Kleman, Phil. Mag. 28 1015 (1973).
[197] L.J. Dijkstra and V.M. Martius, Rev. Mod. Phys. 25 146 (1953).
[198] E.S. Meieran and I.A. Blech, J. Appl. Phys. 36 3162 (1965).
[199] D.K. Bowen and J.W. Christian, Phil. Mag. 12^ 369 (1965).
[200] E.I. Salkovitz and J.S. Koehler, Acta Met. 1 568 (1953).
[201] R.F. Miller, Trans. A.I.M.E. Ill 135 (1934).
[202] C. Crussard, Rev. Met. 4£ 286, 321 (1945).
[203] C. Crussard, Bull. Mineral. £8 174 (1945).
185 599 (1940).
[206] E. Orowan, Nature 149 643 (1942).
[207] C.S. Barrett, Imperfections in Nearly Perfect Crystals, Wiley N.Y. (1952).
[208] R.W.K. Honeycombe, J. Inst. Metals 80 45, 49 (1951).
[209] R. Maddin and N.K. Chen, Progr. Met. Physics, 5 53 (1956).
[210] R. Maddin and N.K. Chen, J. Met. 6 280 (1954).
[211] F.D. Rosi, Acta Met. 4 26 (1956).
[212] V.R. Regel, H. Berez and G.V. Kova, Sov. Phys. Cryst. 4 718 (1960).
[213] K. Kuehlman-Wilsdorf, Phil. Mag. 3 125 (1958).
[214] R.J. Stokes, Trans. A.I.M.E. 244 1227 (1962).
[215] B.K. Tanner, X-ray Diffraction Topography, p75, Pergamon Press (1976).
[216] J. Di Persio, These D'Etat, Université de Lille (1980).
[217] S. Chikazumi, Physics of Magnetism, J. Wiley (1964).
[218] M. Labrune, These D'Etat, Orsay (1979).
[219] J. Miltat, Private Communication.
[220] M. Labrune, M. Kleman, J. Appl. Phys. £5 2716 (1974).
[221] M. Schlenker and M. Kleman, J. Physique, Cl 32^ 256 (1971).
Pergamon N.Y. (1965).
[224] M. Labrune, Private communication.
[225] J. Miltat and M. Dudley, J. Appl. Cryst. 13 555 (1980).
[226] A. Guinier and J. Tennevin, Acta Cryst. 2 133 (1949).
[227] International Tables for X-ray Crystallography Vols. Ill and IV, Kynoch Press, Birmingham (1968). [228] D.T. Cromer, Acta Cryst. lj) 17 (1965).
[229] A. Authier, Proc. of Int. Summer School on X-ray Dynamical Theory and Topography (A1-A2), Limoges France, (1975).
[230] J. Miltat in Proceedings of the Workshop on Imaging Processes and Coherence in Physics,
Les Houches, Springer-Verlag, Berlin, March (1979).
I would like to express ray gratitude to my supervisors Dr. D.K. Bowen and Dr. J. Miltat for providing help,
guidance and inspiration throughout the course of this work. I would also like to thank all workers at the Laboratoire de Minéralogie-Cristallographie, at Paris University, for providing an atmosphere conducive to good work.
I am grateful to Dr. N. Zarubova (Prague),
Dr. M. Sauvage (Paris), Professor B. Sestak (Prague), Dr. S. Davies (Warwick) and Dr. E. Manghi (Paris) for helpful discussions.
I wish to thank Mr. C. Lovatt and Mr. A. Jeanne-Michaud for help with photography and Mr. C. Bidmead and
Mr. Y. Bernard for technical assistance. I vrould also like to express my appreciation of the hard work and patience of Miss L.J. Laws in typing and helping to prepare this thesis.
I also wish to thank Professor A. Authier for
welcoming me to his laboratory in Paris and Professor J. Douce for welcoming me to his laboratory in Warwick.
I am indebted to my family and friends for their encouragement throughout the past three-and-a-half years.
Dynamic experiments are essential in studies of the early stages of deformation of single crystals. X-ray topography is a technique which is especially useful in assessing bulk defect structures in single crystals, and if used in conjunction with a synchrotron source, the short exposures in the high intensity beam make dynamic in situ experiments feasible.
This thesis aims to outline a methodology of how best to exploit the technique of White Beam Synchrotron Radiation Topography for such dynamic deformation studies. Design of experiment is discussed in detail, as well as how to extract the maximum amount of information from, the data obtained.
Single crystals of Fe 3.5 wt % Si were deformed in situ in the white X-ray beam emitted from the synchrotron source at DCI, LURE, Orsay, France. Specimens of two different surface orientations were tested in order to investigate the influence of surface orientation of sheet specimens on the type of slip that ensued under tensile de formation.
ported by Miltat and Bowen ([32]).
In addition to White Beam Synchrotron Radiation Topography, conventional X-ray Topographic techniques will be used as well as optical microscopy and dislocation etch pitting.
The image obtained in X-ray Topography is an un magnified projection of the crystal. Enlargement must therefore be achieved photographically. As is the con vention, topographs are presented as they appear on the X-ray plate. Thus internegatives must be made and sub sequently enlarged to a positive point. Thus darkening on the print corresponds to increased X-ray intensity
1.1 INTRODUCTION
Studies of the plastic behaviour of bcc metals have provoked much discussion based on the effects of dislocation mobility. In general, the relative mobilities of edge and screw dislocations and the frequency of
cross slip are recognized to be important factors in glide deformation of bcc single crystals (for review see [1]).
The plastic properties of bcc metals are found to be very temperature dependent. Generally, two temperature regimes exist (ignoring creep effects at very high
temperature, when diffusion becomes possible), separated by a transition range over which striking changes in behaviour occur. At moderately high temperature (T >
(0.1 -*■ 0.15)Tm) and low strain rates, single crystals of bcc metals exhibit three stage hardening, and can develop dislocation structures similar to those found for
example in Copper (see [2], [3]). In the early stages of deformation at these temperatures there is usually no unique slip system, even for crystals with ideal
slip orientation. Dislocations of all four Burgers vectors have been detected in the microstrain or stage O region
([3]» [4]) and only after some strain does slip on a single system, which is characteristic of stage I become established.
metals, and is characterized by a quasi parabolic stress-strain curve with no clearly distinguishable stages, and by the development of a structure of long screw dislocations accompanied by loop debris ([4], [5], [6], [7], [8], [9]). At these lower temperatures the initiation of macroscopic plastic flow is less well defined and dislocations of different Burgers vectors continue to contribute to deformation up to quite high strains ([10], [11]).
Whilst the author does not wish to enter into a detailed description of the behaviour of all bcc metals it is felt useful to distinguish here between Group Va and Via elements. The former (Nb, V, Ta) generally exhibit simpler hardening behaviour with fewer Burgers vectors activated after a short initial region, but they also show anomalous (Oil) slip behaviour at low temperatures ([12], [3], [9], [13], [14], [15]). The latter (Mo, W) often show a very extended stage 0 with many slip systems active? ([16], [17]). Anomalous slip analogous to that observed in Nb and V has not been observed in these metals. The behavioural characteristics of Iron and its alloys with Silicon appear to fall in between these two extremes (for example cross slip is easier in Mo than Nb, Fe being intermediate
[18]).
alloys With Silicon, as it is these materials which are of most interest to the author.
1.2 Stress Strain Curves
1.2.1 Pure Iron
Work hardening curves of single crystals of Iron have been investigated at various temperatures by Novak and coworkers ([19]) see Fig. 1).
Fig. 1 Shear stress - shear strain curves of Iron single crystals oriented for single slip, measured in tension at various temperatures (after
[19])
The lower regime, which shall be called the Low Temperature Regime, is characterized by a quasi parabolic shear stress-shear strain curve.
1.2.2 Alloys of Silicon in Iron
A study of the effect of alloying on work hardening in Iron Silicon crystals of low silicon content has also been made by Novak and coworkers [19]. Single crystals of Fe 0.5 wt % Si and Fe 0.9 wt % Si were studied
(see Figs. 2 and 3).
Fig. 2 As in Fig. 1, but for Fig. 3 As in Fig. 1, but for single crystals of Fe -0.5 wt single crystals of Fe 0.9 wt
% Si {[19]) % si ([19])
by Three Stage Hardening curves) and the low temperature regime is shifted to lower temperatures, (b) Stage I hardening is enhanced, and (c) the flow stress level increases.
Fig. 4 Schematic representation of CRSS versus temperature curve, illustrating the significance of Tt and Tc
1.2.3 Interpretation
can be considered from the point of view that in bcc metals (as opposed to Fee) it is easier from the start of deformation for extensive cross slip to occur (i.e. no long Stage II is necessary). This degeneration of Stage II could also be affected by friction stress within the crystal, which would impede cross slip at lower temperatures but not so much at elevated temperatures [9] .
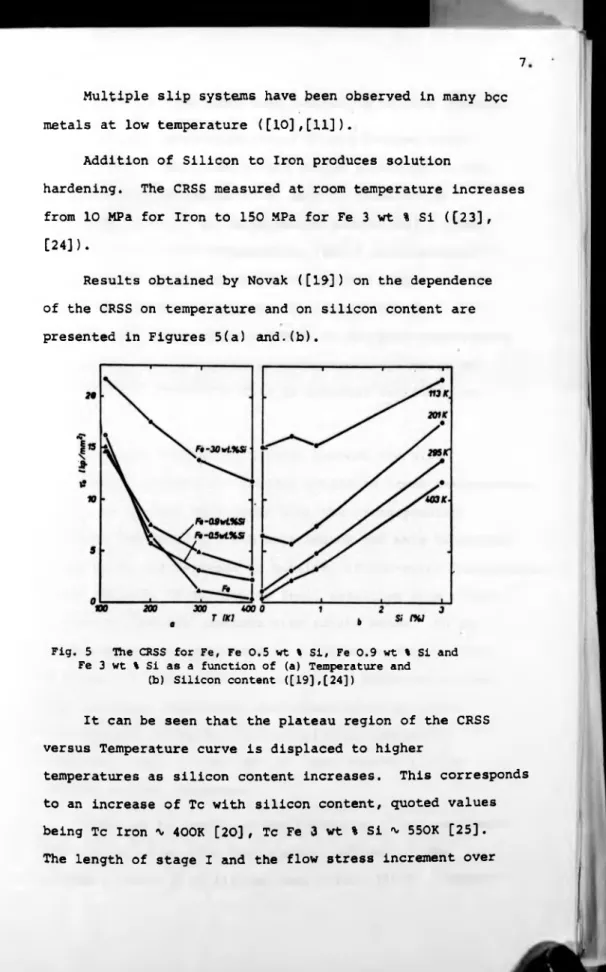
At the critical temperature, the critical resolved shear stress (CRSS) curve reaches a plateau, and the flow stress becomes strain rate insensitive (see Figs. 4, 5a [19]).
As the temperature is decreased from Tc (^ 400K for Iron) the mobility of screw dislocations decreases appreciably whilst that of the non screw does not. This effect will be considered in more detail in section 1.7.
Below a certain temperature known as the transition temperature Tt , the difference in mobility (see Schematic diagram Fig. 4) between screw and non screw dislocations becomes so large that it becomes easier for slip to occur via the motion of secondary edge dislocations than by the motion of primary screw dislocations, since the flow stress increases so much. Although movement of both edge and screw dislocations is needed for loops to expand, it is the screw mobility which controls the flow stress. Below Tt , the stress strain curves are parabolic in shape
Multiple slip systems have been observed in many bcc metals at low temperature ([10],[11]).
Addition of Silicon to Iron produces solution
hardening. The CRSS measured at room temperature increases from 10 MPa for Iron to 150 MPa for Fe 3 wt % Si ([23], [24]).
Results obtained by Novak ([19]) on the dependence of the CRSS on temperature and on silicon content are presented in Figures 5(a) and.(b).
Fig. 5 The CRSS for Fe, Fe 0.5 wt % Si, Fe 0.9 wt % Si and Fe 3 wt % Si as a function of (a) Temperature and
(b) Silicon content ([19],[24])
It can be seen that the plateau region of the CRSS versus Temperature curve is displaced to higher
this stage also increase with increasing silicon content.
However, investigations of alloys ranging from 0 to 3% silicon show that alloys deform according to the high temperature regime (i.e. exhibit Three Stage Hardening Curves), at temperatures substantially lower than their Critical Temperatures (which are indicated by the position of the onset of the plateau region on the CRSS versus Temperature curves). Single crystals of Fe 3 wt % Si (Tc ^ 550K) deformed in the high temperature regime even at the lowest investigated temperature of 113K ([24]). Evidently this is somewhat contradictory and odd.
So, with increasing Silicon content the high
temperature deformation regimes extend to lower temperatures, which are in fact much lower than the corresponding
critical temperature. The main reason for this behaviour seems to be the decrease in mobility of non-screw dislocations after addition of Silicon to Iron, resulting from inter actions of the dislocations with solute atoms. So as temperatures decrease there is a reduction (due to the alloying) of the mobility of non-screw dislocations and This reduction approaches that experienced by screw dislocations (whose mobility is already inherently relatively small in bcc metals - see section 1.7) as Silicon content increases.
pinning of an edge dislocation by a solute atom (i.e.
decoration) will not occur as Iron-Silicon is a substitutional alloy and diffusion would have to be possible for such
decoration to occur (this only occurs at high temperatures in Iron). However, the interaction of an edge dislocation with such a strain field may be enough to make non screw mobility keep track with screw mobility as temperatures decrease.
Fig. 6 Comparison of the temperature dependence of the 0.3% offset yield strength in bending and in tension with the temperature dependence of the stress to produce a constant dislocation velocity for two different constant velocity levels (10” ‘ and 10~* cm sec-1) (after [26])
1.3.1 Pure Iron
Slip line morphology investigations in pure Iron, were made by Novak and Sestak [28], at a series of temperatures. At 113K slip traces were only observed after deformation to a shear strain of e * O . L Slip traces were diffuse, and slip was described as being very fine and homogeneously distributed in the specimen. The contrast of slip traces increased with strain, till the necking of specimens. Evaluation of the Nomarski contrast indicated local changes in slope of the surface relief of approximately ten minutes of arc at e = 0.3. This corresponds to local variations of shear strain Ae = 0.006. Crystals were oriented in the centre of the unit triangle and traces consistent with
(ToD(lll)
and (101)[Til]
slip systems were observed around the whole circumference of specimens. Traces of slip in the two remaining <111> directions were observed only on a part of the specimen surface and this made slip plane determination difficult.TCMPCIUTu«C *«
At 295 and 403K Iron exhibits Three Stage
Hardening curves (as already mentioned in Section 1.2.1).
In Stage I Iron showed distinct traces of extensive cross-slip of primary screw dislocations. In Stage III (Stage II being a point of inflexion) slip became very inhomogeneous, as indicated by coarse slip bands
observed on the surface. These bands were approximately consistent with primary slip on planes of the [111] zone, which are situated in the vicinity of the (101) plane.
1.3.2 Alloys of Silicon in Iron
Observation of slip line morphology in a series of alloys of Silicon in Iron were also made by Novak and coworkers [28].
At 113K Fe 0.5 wt % Si showed similar behaviour to that already described for pure Iron at this temperature.
For Fe 1 wt % Si single crystals at 113#K coarse slip bands mostly corresponding to the primary (101)[111] and the conjugate (101)[111] systems were observed. Inside the bands slip was very fine and relatively homogeneous. A shear strain of e = 0.15 was concentrated in the primary slip bands whilst between the bands e = 0. With increasing deformation the slip bands broadened
up to constant ' strain and new bands were nucleated.
particular specimen shear strain e = eg , these bands were seen to fill up the whole specimen surface and as this value of shear strain is exceeded, a relatively homogeneous slip occurs till necking of the specimen
([24],[29]). The same slip morphology was observed on Fe 3 wt % Si single crystals after deformation at all the investigated temperatures, but with the value of es decreasing with increasing temperature ([30]).
At 201, 295 and 403K Fe 0.5 wt % Si and Fe 1 wt % Si exhibited Three Stage Work Hardening curves and the observed slip markings were qualitatively similar in the two alloys. At the beginning of Stage I,
and up to a particular value of shear strain which shall be called ep , slip was concentrated into primary
slip bands separated by undeformed regions of crystal. Values of ep become smaller when the Silicon content is decreased and when the temperature is increased. After the specimen surface is covered by bands, slip becomes relatively homogeneous till the end of Stage I. Quantitative evaluation of the Nomarski contrast
indicated variations of Ae 'v 0.01 of the shear strain until the end of Stage I.


![Fig. 10 Interaction of a dislocation with (for example) a precipitate (a) after Orowan ([43]), (b), (c) ,](https://thumb-us.123doks.com/thumbv2/123dok_us/9889455.490183/64.764.124.746.14.1005/fig-interaction-dislocation-example-precipitate-orowan-b-c.webp)
![Fig. 21 Similar model for stress assisted, thermally activated glide of screw dislocation dissociated on {112} planes (after [86])](https://thumb-us.123doks.com/thumbv2/123dok_us/9889455.490183/82.775.91.747.5.945/similar-stress-assisted-thermally-activated-dislocation-dissociated-planes.webp)
![Fig. 22 Projection of bcc structure along [ill] (after [1])](https://thumb-us.123doks.com/thumbv2/123dok_us/9889455.490183/84.768.105.753.10.969/fig-projection-bcc-structure-ill.webp)
![Fig. 26 Volume indentation by a harder precipitate (after [123])](https://thumb-us.123doks.com/thumbv2/123dok_us/9889455.490183/94.771.159.739.4.990/fig-volume-indentation-harder-precipitate.webp)
