ORIGINAL RESEARCH
ADULT BRAIN
Constrained Source Space MR Spectroscopy: Multiple Voxels,
No Gradient Readout
K. Landheer, A. Sahgal, S. Das, and S.J. Graham
ABSTRACT
BACKGROUND AND PURPOSE: Our goal was to develop a novel technique for measuring a small number of localized spectra simulta-neously and in a time-efficient manner.
MATERIALS AND METHODS: Using appropriate radiofrequency pulses, the magnetization from multiple voxels is excited simultaneously and then separated (reconstructed) by using the individual coil-sensitivity profiles from a multichannel receiver coil. Because no gradients are used fork-space encoding, constrained source space MR spectroscopy provides a time advantage over conventional spectroscopic imaging and an improved signal-to-noise ratio per square root of unit time over single-voxel spectroscopy applied at each successive location. In the present work, we considered prototype application of constrained source space MR spectroscopy for 2 voxels.
RESULTS:Experimental data from healthy volunteers and simulation results showed that constrained source space MR spectroscopy is effective at extracting 2 independent spectra even in the challenging scenario of the voxels being closely spaced. Also, from 6 patients with various types of brain cancer we obtained 2-voxel constrained source space MR spectroscopy data, which showed spectra of clinical quality in half the time required to perform successive single-voxel MR spectroscopy.
CONCLUSIONS: Constrained source space MR spectroscopy provides clinical quality spectra and could be used to probe multiple voxels simultaneously in combination with Hadamard encoding for further scan-time reductions.
ABBREVIATIONS:CSSMRS⫽constrained source space MR spectroscopy; PRESS⫽point-resolved spectroscopy sequence; SVS⫽single-voxel spectroscopy
T
here are 2 major categories of MR spectroscopy pulse se-quences on current clinical MR imaging systems: single-voxel spectroscopy (SVS), which measures one voxel, and MR spectro-scopic imaging, which measures many spectra simultaneously over a Cartesian grid of voxels. Both SVS and MR spectroscopic imaging are widely applied in humans to detect certain molecular constituents of normal and abnormal tissues, especially those as-sociated with cellular metabolism, and to monitor therapeutic response.1-3Each MR spectroscopy category has its applicationniche, because SVS and MR spectroscopic imaging exploit
dif-ferent spatial and temporal resolution trade-offs. SVS is attrac-tive when anatomic MR imaging provides a precise indication of where spectral information should be collected. When pa-thology is more diffuse, widely distributed, or not detectable on anatomic MR imaging, MR spectroscopic imaging is the technique of choice for generating spectra from many voxels by using multiple repetitions fork-space encoding.4,5To reduce
spectroscopic scan times, various “parallel imaging” ap-proaches have been applied to reduce the amount ofk-space data acquired. These techniques exploit the spatial sensitivity of individual elements in multichannel receiver coils6-9 and
can substantially reduce scan times.
The spatial limitations of SVS are well recognized; it is usually the case that SVS spectra are required at more than one location, either to compare spectra from diseased and normal tissue or in the case of multifocal disease. This limitation naturally leads to execution of SVS pulse sequences successively for each voxel lo-cation. There have been some attempts to modify spectroscopy acquisition to extend the volume of SVS coverage, such as with line-scan echo-planar spectroscopic imaging,10which provides
spectra from a column of voxels. However, for clinical applica-Received September 26, 2014; accepted after revision January 19, 2015.
From the Departments of Medical Biophysics (K.L., S.J.G.), Surgery (S.D.), and Radia-tion Oncology, Sunnybrook Odette Cancer Centre (A.S.), University of Toronto, Ontario, Canada; Physical Sciences (K.L., S.J.G.), Sunnybrook Research Institute, To-ronto, Ontario, Canada; and Keenan Research Centre (S.D.), St. Michael’s Hospital, Toronto, Ontario, Canada.
K. Landeer was supported by scholarships from the Natural Sciences Research Council of Canada, the Ontario Graduate Scholarship program, and the Walter C. Sumner foundation.
Please address correspondence to Karl Landheer, MSc, Sunnybrook Research Insti-tute, 2075 Bayview Ave, Room S605, Toronto, Ontario M4N 3M5, Canada; e-mail: landheer@sri.utoronto.ca
tions, standard SVS methods, notably point-resolved spectros-copy (PRESS)11and stimulated echo acquisition mode,12remain
entrenched.
Previously, a technique that uses radiofrequency localization and sensitivity encoding13was developed for fast functional MR
imaging.14It is reasonable that this “constrained source space”
approach, appropriately modified for MR spectroscopy applica-tions, should be investigated more to determine whether it use-fully augments existing SVS capabilities. In the present work, in which we used constrained source space MR spectroscopy (CSSMRS), a prototype pulse sequence was developed and ana-lyzed for its ability to acquire and separate spectra from 2 voxels simultaneously with nok-space encoding. The efficacy of spectral separation was investigated for a variety of distances between the 2 voxels in a healthy volunteer. In addition, numeric simulations were performed to assess the validity of certain assumptions made in the reconstruction and to predict CSSMRS performance in cases in which lengthy experimentation was impractical. Last, 2-voxel CSSMRS data were reported in relation to conventional SVS data acquired successively at each voxel location for patients with a variety of different brain cancers ranging from low grade to high grade.
MATERIALS AND METHODS
CSSMRS Implementation and Spectral Analysis
All experimental data were collected by using a Discovery MR750 3T imaging system (GE Healthcare, Milwaukee, Wisconsin) with a standard 8-channel head coil receiver. To achieve CSSMRS for
proof-of-principle demonstrations, a standard PRESS sequence was modified to excite 2 voxels (instead of 1) arbitrarily in space (Fig 1A). Illustrative voxel locations are shown overlaid on the anatomic image of a patient with brain cancer inFig 1B(see patient 6 data inTable 1). The 2 user inputs were the voxel size, chosen throughout as 20 mm⫻20 mm⫻20 mm, and the x, y, and z coordinates of each voxel location. In this approach, 2 arbi-trarily positioned voxels were excited via cosine modulation of the first radiofrequency pulse, which resulted in the excitation of 2 parallel sections, followed by the standard spin-echo formation process thereafter. Arbitrary localization was obtained by modi-fying the offset frequencies of the radiofrequency pulses and changing the rotation array between logical and physical gradi-ents. The 3 radiofrequency pulses were Shinnar-Le Roux pulses15
with durations of 3600, 5200, and 5200 milliseconds and band-widths of 2366.67, 1384.62, and 1384.62 Hz for the first, second, and third pulses, respectively.
The additional pulse sequence parameters for this initial work included a TR and TE of 1500 milliseconds and 288 milliseconds (unless otherwise stated), respectively, a flip angle of 63° (approx-imately the Ernst angle), a readout bandwidth of 2500 Hz, and 1024 points of data acquisition (total acquisition time, 409.6 mil-liseconds). A TE value of 288 milliseconds was chosen because it has been shown to have high MR spectroscopy reproducibility,16
[image:2.594.115.472.48.194.2]an important clinical factor compared with the other common TE values of 30 and 144 milliseconds, despite the associated reduction in SNR. Water suppression was implemented by us-FIG 1. A, Pulse diagram for CSSMRS. The first radiofrequency pulse has a flip angle of␣(where␣is⬍90°) and is cosine modulated, such that the subsequent spin echo after the third radiofrequency pulse excites 2 voxels. Shaded gradients are crusher gradients. The section-select rephasing lobe for theygradient is added directly to the first crusher. The gradient-echo readout in the dotted box is optional for voxel localization verification. RF indicates radiofrequency; DAQ, data acquisition.B, An anatomic T1-weighted image of patient 6 with the nominal voxel locations overlaid and a brain tumor evident in the left middle temporal gyrus. The 2 spectra for this patient are displayed in the bottom row ofFig 2.
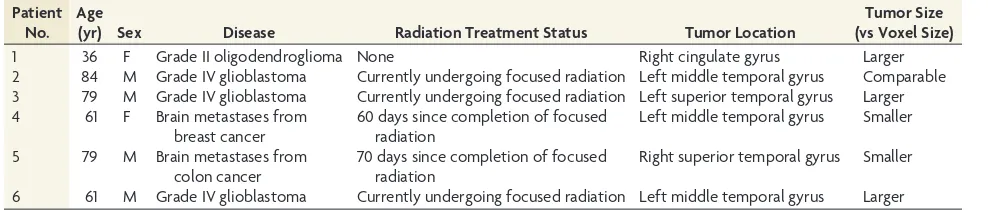
Table 1: Summary of patients with brain tumor studied in experiment 2 Patient
No. Age
(yr) Sex Disease Radiation Treatment Status Tumor Location
Tumor Size (vs Voxel Size)
1 36 F Grade II oligodendroglioma None Right cingulate gyrus Larger
2 84 M Grade IV glioblastoma Currently undergoing focused radiation Left middle temporal gyrus Comparable
3 79 M Grade IV glioblastoma Currently undergoing focused radiation Left superior temporal gyrus Larger
4 61 F Brain metastases from
breast cancer
60 days since completion of focused radiation
Left middle temporal gyrus Smaller
5 79 M Brain metastases from
colon cancer
70 days since completion of focused radiation
Right superior temporal gyrus Smaller
6 61 M Grade IV glioblastoma Currently undergoing focused radiation Left middle temporal gyrus Larger
[image:2.594.51.545.268.373.2]ing chemical shift selective saturation.17Before each data
ac-quisition, first- and second-order shimming was applied to encompass most of the brain to decrease spectral linewidths. The typical linewidth of the water peak was approximately 8 Hz. The total number of excitations was 128, and the total scan time was 3.2 minutes.
Regarding spatial reconstruction of CSSMRS data to separate spectra from the 2 voxels, the governing equation can be ex-pressed in matrix form as follows13,14:
1) y共t兲 ⫽ Sx共t兲 ⫹ ⑀共t兲,
where the sensitivity matrixSrelates how the magnetization signals x(t) from each voxel result in the acquired signalsy(t) from each element in the receiver coil, and⑀(t) represents coil element-depen-dent noise. As can be seen from Equation 1, the reconstruction of CSSMRS requires a calibration scan for the measurement of the coil sensitivity. The sensitivity matrix is generated by assuming that the spatial sensitivityCof each coil element varies slowly over the extent of each voxel. For each of thelcoils andnsections,
2) Sl,n ⫽
1 Np
冘
i⫽imin
imax
冘
j⫽jmin
jmax
Cl,n共i,j兲,
whereNpis the number of pixels within the specified region inside the voxel,iminandimaxare the minimum and maximum, respec-tively, row pixel limits on the voxel, andjmin andjmaxare the minimum and maximum, respectively, column pixel limits on the voxel. Equation 1 can be solved by the sensitivity encoding for-malism by using weak reconstruction with SNR optimization13:
3) xˆ共TRp;t兲⫽共SH⌿⫺1S兲⫺1SH⌿⫺1y共TRp;t兲,
wherexˆis the estimated magnetization signal for each voxel,TRp denotes thepth repetition, and⌿represents the noise covariance matrix between the coils. For example,
4) ⌿l1,l2⫽
1 NE
冘
i⫽1 NE
共⑀l1
*共i兲⫺⑀ l1
*兲共⑀
l2共i兲⫺⑀l2兲,
where the complex noise samples can be taken from the last da-tum of each acquisition, and the covariance is calculated over the total number of excitations,NE.
TheCmatrices can be estimated by various approaches,18-20
though previous CSS work has shown that a simple procedure is sufficient for proof-of-concept implementation.14Two sets of fast
gradient-echo images were acquired with the same pulse sequence parameters (TE, 1.3 milliseconds; TR, 34 milliseconds; flip angle, 5 °; field of view, 30 cm; 64⫻64 acquisition matrix; section thick-ness, 5 mm): 1 set with the body coil and 1 set with the multichan-nel head coil receiver. These images were then interpolated to produce 256⫻256 images with an isotropic in-plane resolution of 1.17 mm. For each of thelcoils andnsections, the coil-sensi-tivity map at each in-planex,ycoordinate,Cl,n(x,y), was estimated by dividing each of the individual head coil images by the analo-gous body coil image and then thresholding by using an “object indicator” to set the coil sensitivity to 0 in regions in which noise dominated the object signal.
The CSSMRS reconstruction was performed by using specially written scripts in Matlab (MathWorks, Natick, Massachusetts).
The 2 separated signals were first zero-filled by a factor of 2 and then transformed to the spectral domain by fast Fourier transfor-mation. The spectra were then phase corrected including zero-and first-order correction terms by using an automated algorithm based on minimizing entropy.21The spectra were then shifted in
frequency to place the peak for NAA at 2.04 ppm, normalized by their L2 norm, and subjected to Hankel-Lanczos singular value decomposition22 for the removal of residual spectral content
arising from water. Spectral components were then quantified automatically by using the freeware SPID (http://homes.esat. kuleuven.be/⬃biomed/software.php), which uses a separable nonlinear least-squares fitting algorithm known as automated quantitation of the short echo time MR spectroscopy spectra.22
The automated quantitation of short echo time MR spectros-copy spectra algorithm provides Cramer-Rao lower-bound es-timates of the standard deviation of each quantified spectral component. The basis set used was simulated by using Java Magnetic Resonance User Interface (jMRUI) and the scan pa-rameters. The values obtained from the quantification algo-rithm for NAA, Cho, and Cr were then scaled by attenuation factors to account for transverse and longitudinal relaxation effects by using relaxation constants obtained in a normal brain.23According to common practice, the values for lactate
were not adjusted for attenuation.
Experimental Validation
Bloch equation simulations confirmed that cosine modulation had negligible effects on the integrity of the spatial profile. A water-fat phantom was used to measure the signal bleed between voxels. One voxel was placed inside a stationary fat container, and another voxel was placed inside a surrounding water bath. Typical scan parameters, except a TE of 30 milliseconds for increased SNR, were used. This scan was repeated for center-to-center distances of 30 –70 mm. The bleed was defined to be the amplitude of the contaminating spectrum divided by the amplitude of the main spectrum in the other voxel multiplied by 100%. Two validation experiments were subsequently conducted on healthy volunteers and patients with brain cancer to assess CSSMRS capabilities in practical scenarios. Each volunteer participated with free and informed consent and with the approval of the hospital research ethics board.
Experiment 1 was performed to investigate how CSSMRS re-sults are affected by voxel placement in relation to coil-sensitivity profiles. Because CSSMRS involves sensitivity encoding recon-struction, overall performance depends on the condition number of the reconstruction matrix, as quantified by the g factor13:
5) g共k兲⫽
冑
共S*⌿⫺1S兲 k,k⫺1共S*⌿⫺1S兲 k,k,
ma-trix from the measured coil sensitivities at each individual voxel location, which, along with the noise covariance matrix (Equation 4), can be used to calculate the g factor by using Equation 5. In addition to these experiments, a single scan was performed on a healthy volunteer with a TE of 30 milliseconds to investigate the short echo time regimen.
Experiment 2 was performed to investigate how well CSSMRS distinguishes spectra from cancerous and normal tissue over a representative range of clinical presentations. Six patients with brain cancer were recruited from the Sunnybrook Odette Cancer Centre during the course of their treatment (seeTable 1for tumor characteristics). Patients were included if they presented with a tumor volume approximately the same size as the prescribed voxel, or slightly larger or smaller. Tumor location was verified by using a high-resolution fast-spoiled gradient-echo with an ana-tomic inversion recovery preparation (acquisition parameters are shown below). For each patient, one voxel was placed at the center of the tumor, and the other was placed on the contralateral side in the analogous neuroanatomic region within normal-appearing brain tissue. PRESS data were also acquired successively in these 2 locations for comparison purposes.
In both experiments, PRESS was performed with the identical acquisition parameters used in CSSMRS and with the same spec-tral analysis pipeline. The total examination time for comparing CSSMRS and PRESS data from 2 voxels was approximately 20 min, which included scout images, anatomic MR imaging (fast-spoiled gradient-echo with an anatomic inversion recovery; 256⫻256 pixels; pixel size, 0.86⫻0.86 mm; TR, 8.2 milliseconds; TE, 3.2 milliseconds; flip angle, 8°), and 2 fast gradient-echo scans
(for measuring coil sensitivity, as already described) and high-order shim, CSSMRS, and PRESS acquisitions.
Numeric Simulation
A simple numeric simulation was also written in Matlab for addi-tional insight into the results of experiments 1 and 2. The simu-lation assessed the impact on spatial reconstruction of the impor-tant assumption underlying Equation 1, namely that coil sensitivity could be reasonably approximated as a constant over each voxel. Given good agreement between experimental results and simulations for experiment 1 (see “Results”), the simulation also was used to predict CSSMRS performance under conditions that were not possible to measure experimentally during experi-ment 2 because of the inherent time restrictions for collecting MR spectroscopy data in patients.
[image:4.594.52.533.44.322.2]struction, spectral processing, and analysis were conducted as outlined above for experimental data.
RESULTS
For center-to-center spacings of 30, 40, 50, 60, and 70 mm, the ob-served bleeds of water into the fat voxel were 6.2%, 6.3%, 3.5%, 0.4%, and 1.7%, respectively, and the observed bleeds of fat into the water voxel were 3.0%, 0.2%, 0.1%, 5.2%, and 2.4%, respectively.
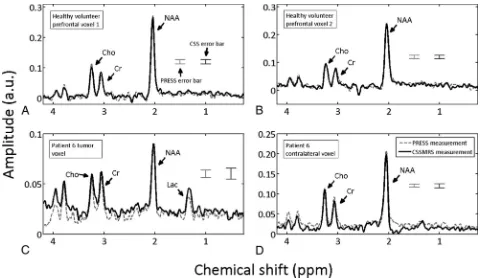
For visual comparison,Fig 2displays 4 representative spectra obtained by CSSMRS (solid black lines) and PRESS (dashed gray lines). As commonly performed for display purposes, all spectra were apodized by a Gaussian filter with 2 Hz full-width at half-maximum. The spectra shown inFig 2A,-Bare qualitatively sim-ilar and were obtained from a healthy volunteer with both voxels
placed inside the prefrontal cortex. The spectra shown inFig 2C,-Dwere obtained from patient 6 (Table 1) and are substantially different for the 2 voxels, with the spectra inFig 2C obtained from tumor tissue inside the left middle temporal gyrus and those inFig 2Dobtained from con-tralateral homologous tissue, as shown inFig 1B. Spectra from pa-tient 6 were chosen for display inFig 2because CSSMRS results were ob-tained in this case with the median g factor observed over the patient co-hort.Figure 3Adisplays spectra ob-tained from both CSSMRS and PRESS for the minimum achievable TE of this pulse sequence (30 milli-seconds).Figure 3Bshows the tumor spectrum obtained from CSSMRS for patient 1 and the fit obtained from automated quantitation of short echo time MR spectroscopy spectra.
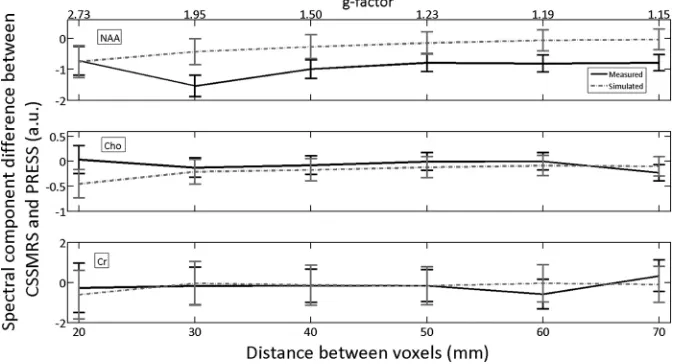
The results of experiment 1 and related numeric simulations are shown inFig 4, in which are plotted the difference between quantified spectral components measured by CSSMRS and PRESS for 6 different voxel separations (one voxel held fixed, one moved radially) and the 3 main metabolites observed inFig 2A, -B: NAA, Cr, and Cho. The differ-ence values (CSSMRS minus PRESS) reported are specifically for the voxel that was maintained in a fixed po-sition. For both the experimental and simulated results, the differ-ence between CSSMRS and PRESS remained constant within experi-mental error over all the voxel sep-arations. Furthermore, the differ-ence values for experimental and simulation results also agreed within error, with the only ex-ception being a slight bias in NAA quantification when voxels were separated by more than 20 mm.
Given the good level of agreement between experiment and simulation observed inFig 4, numeric simulations were then ex-tended to assess CSSMRS reconstruction quality as a function of voxel separation with spectra that were substantially different in the 2 voxels.Figure 5 shows plots of the difference between quantified spectral components measured by CSSMRS and PRESS in a manner analogous to that shown inFig 4; however, in this case, the inputs to the simulation were provided from patient 6 with the difference values relating to quantification of the tumor spectral components: NAA, Cho, Cr, and lactate. For additional FIG 3. A, Spectra from a healthy volunteer at 30-millisecond echo time, obtained by using both
CSSMRS and PRESS. The labeled metabolites are myo-inositol (mI), Cho, Cr, Glx, and NAA.B, The unapodized spectrum obtained from CSSMRS from patient 1 (highest g-factor) along with the auto-mated quantitation of short echo time MR spectroscopy spectra (AQSES) fit.
[image:5.594.64.381.45.241.2] [image:5.594.53.393.302.484.2]context, the difference values ob-tained experimentally for patient 6 are also indicated as single data points inFig 5. Similar toFig 4,Fig 5 shows difference values of 0 within error for all voxel separations and metabolites (except Cho for adjacent voxels), indicating that good CSSMRS reconstruction quality was maintained even when the 2 voxels were located in close proximity to one another. In addition, the recon-struction tends to improve as the dis-tance between the voxels increases for all metabolites. The simulation results and experimental results also agree within error for the single ex-perimental data point.
To summarize the results of ex-periment 2, CSSMRS and PRESS re-sults are quantified in Tables 2–5 for patients 1– 6 across tumor and nor-mal tissue voxels for NAA, Cr, Cho, FIG 5. Simulated metabolite quantification values for 7 different voxel separations for the 4 main
[image:6.594.52.392.51.234.2]metabolites within the tumor spectra for patient 6: NAA, Cho, Cr, and lactate (Lac). The quantified values were from the stationary voxel placed within the tumor and are plotted in gray. The black data points located at 62 cm in each plot are the experimental results for this patient, corresponding to the first difference column values listed inTables 2–5for patient 6. The estimated g factors are also displayed above the top x-axis for reference, though there is a nonlinear relationship between the g factor and voxel separation.
Table 2: Quantified NAA values from PRESS and CSSMRS for both voxelsa
Patient No.
CSSMRS Tumor Voxel (a.u.)
PRESS Tumor Voxel (a.u.)
Difference (a.u.)
CSSMRS Healthy Voxel (a.u.)
PRESS Healthy Voxel (a.u.)
Difference (a.u.)
1 5.70⫾0.65 4.86⫾0.58 0.83⫾0.87 9.73⫾0.28 9.88⫾0.20 ⫺0.15⫾0.35
2 2.70⫾0.44 2.08⫾0.40 0.62⫾0.59 9.34⫾0.35 8.84⫾0.35 0.50⫾0.49
3 1.70⫾0.19 1.60⫾0.20 0.10⫾0.28 9.14⫾0.12 9.42⫾0.14 ⫺0.28⫾0.18
4 3.33⫾0.54 0.14⫾0.25 3.19⫾0.59 8.09⫾0.38 8.89⫾0.36 ⫺0.81⫾0.52
5 5.27⫾0.29 4.22⫾0.21 1.05⫾0.35 8.87⫾0.38 10.93⫾0.55 ⫺2.06⫾0.66
6 5.89⫾0.27 5.41⫾0.33 0.48⫾0.43 6.81⫾0.21 6.98⫾0.20 ⫺0.17⫾0.29
Note:—a.u. indicates arbitrary units.
a
[image:6.594.53.535.346.432.2]Shown are means and standard deviations (Cramer-Rao bounds).
Table 3: Quantified Cho values from PRESS and CSSMRS for both voxelsa
Patient No.
CSSMRS Tumor Voxel (a.u.)
PRESS Tumor Voxel (a.u.)
Difference (a.u.)
CSSMRS Healthy Voxel (a.u.)
PRESS Healthy Voxel (a.u.)
Difference (a.u.)
1 2.93⫾0.39 2.89⫾0.24 0.04⫾0.45 1.72⫾0.18 1.73⫾0.13 ⫺0.01⫾0.22
2 1.86⫾0.27 1.67⫾0.17 0.19⫾0.32 1.89⫾0.20 2.22⫾0.22 ⫺0.33⫾0.30
3 0.67⫾0.12 0.96⫾0.17 ⫺0.28⫾0.21 2.06⫾0.07 2.31⫾0.08 ⫺0.25⫾0.11
4 0.97⫾0.93 0.83⫾0.33 0.15⫾0.99 1.36⫾0.18 2.05⫾0.21 ⫺0.69⫾0.75
5 1.66⫾0.12 1.81⫾0.11 ⫺0.15⫾0.16 1.56⫾0.26 3.02⫾0.66 ⫺1.46⫾0.71
6 1.56⫾0.17 1.59⫾0.20 ⫺0.02⫾0.26 1.75⫾0.13 1.80⫾0.12 ⫺0.05⫾0.17
Note:—a.u. indicates arbitrary units.
a
Shown are means and standard deviations (Cramer-Rao bounds).
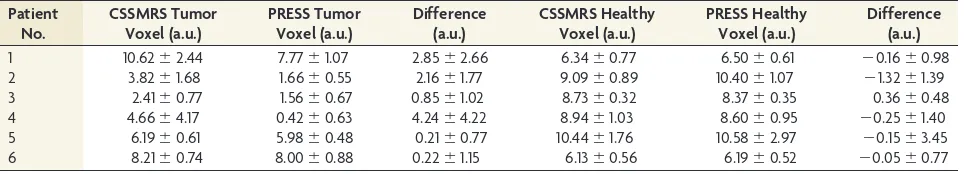
Table 4: Quantified Cr values from PRESS and CSSMRS for both voxelsa
Patient No.
CSSMRS Tumor Voxel (a.u.)
PRESS Tumor Voxel (a.u.)
Difference (a.u.)
CSSMRS Healthy Voxel (a.u.)
PRESS Healthy Voxel (a.u.)
Difference (a.u.)
1 10.62⫾2.44 7.77⫾1.07 2.85⫾2.66 6.34⫾0.77 6.50⫾0.61 ⫺0.16⫾0.98
2 3.82⫾1.68 1.66⫾0.55 2.16⫾1.77 9.09⫾0.89 10.40⫾1.07 ⫺1.32⫾1.39
3 2.41⫾0.77 1.56⫾0.67 0.85⫾1.02 8.73⫾0.32 8.37⫾0.35 0.36⫾0.48
4 4.66⫾4.17 0.42⫾0.63 4.24⫾4.22 8.94⫾1.03 8.60⫾0.95 ⫺0.25⫾1.40
5 6.19⫾0.61 5.98⫾0.48 0.21⫾0.77 10.44⫾1.76 10.58⫾2.97 ⫺0.15⫾3.45
6 8.21⫾0.74 8.00⫾0.88 0.22⫾1.15 6.13⫾0.56 6.19⫾0.52 ⫺0.05⫾0.77
Note:—a.u. indicates arbitrary units.
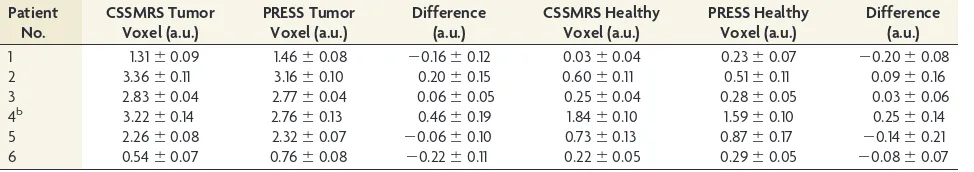
[image:6.594.54.537.489.575.2] [image:6.594.53.535.628.715.2]and lactate, including the differences in spectral quantification. The CSSMRS g factors for patients 1– 6 were 1.39, 1.00, 1.00, 1.13, 1.17, and 1.01, respectively, which indicates that there should be a SNR per square root of unit time benefit for CSSMRS over PRESS in all cases. Overall, large decreases in NAA and increases in lac-tate and Cho were observed for tumor voxels in relation to normal tissue voxels for CSSMRS and PRESS for most patients, con-sistent with results from previous studies.24 Tables 2–5also
show large variability in the tumor spectra across patients. A Mann-WhitneyUtest on the pooled values from all metabo-lites obtained from CSSMRS versus PRESS yielded aPvalue of .86, indicating no significant difference. There was no evidence of significant voxel bleed in the in vivo experiments, because no systematic increase in lactate was observed in normal tissue CSSMRS voxels (Table 5), except that a large lactate value was obtained from CSSMRS and PRESS spectra in the healthy tis-sue of patient 4. Voxel placement was close to the scalp in this particular patient, which produced contaminating lipid signals that were subsequently misinterpreted as lactate by the auto-mated quantitation of short echo time MR spectroscopy spec-tra software. Thus, this specific result should be discounted. In addition there was a significant increase observed for this pa-tient in NAA in the CSSMRS tumor voxel, which is likely be-cause of motion that exacerbated the bleed effects (this partic-ular patient had difficulty remaining still).
DISCUSSION
This work has introduced a prototype pulse sequence for CSSMRS, a novel spectroscopy technique that measures spectra from multiple voxels simultaneously without the need fork-space encoding. Instead, spatial encoding is achieved by multivoxel ra-diofrequency selective excitation, signal readouts from a multi-channel receiver coil, and sensitivity encoding14reconstruction to
separate the signals from each voxel. The CSSMRS method is important from the perspective of SNR per square root of acqui-sition time, potentially providing efficiency in comparison to the standard clinical practice of performing successive SVS acquisi-tions at different voxel locaacquisi-tions.
Careful experiments and simulations were undertaken to in-vestigate the capabilities of CSSMRS for simultaneous measure-ment of 2 voxels. In particular, considerable attention was paid to whether CSSMRS provides adequate spatial localization in rela-tion to the standard SVS PRESS method. In a water-fat experi-ment, it was shown that the bleed rate was up to 6% for very closely spaced voxels and less for further spaced voxels. This amount of bleed is acceptable for spectroscopic applications.
Ex-periments 1 and 2, conducted with healthy volunteers and a di-verse group of 6 patients with a brain tumor (4 different types of cancer were represented), showed overall that CSSMRS and suc-cessive PRESS spectra agreed within experimental error. Further-more, CSSMRS spatial reconstruction was shown to be robust over a range of voxel prescriptions (with one voxel held fixed and the voxel separation varied) by both experiments and numeric simulations. The experiment and simulation were in agreement for a healthy volunteer, indicating excellent reconstruction even when the 2 voxels were placed adjacent to one another. The only additional feature of note in this regard was a systematic decrease in the measured value of NAA in CSS (as shown inFig 4), which was not predicted by simulation. This feature is likely a result of either motion or the relatively simplistic nature of the simula-tions, which did not account for various experimental factors. However, given that the overall level of agreement between exper-iment and simulation was very good, these factors evidently have a small influence. The simulation, therefore, helped to support the assumption made in CSSMRS reconstruction that coil-sensitivity variations can be neglected within the voxels.
The agreement between these experiments and the simulation provides rationale for using simulations to further predict CSSMRS capabilities in a patient with brain cancer . As expected, slightly larger variations were observed as a function of voxel sep-aration in this case, likely because of the larger spectral differences between the 2 voxels. However, with the exception of NAA for voxels separated by greater than 20 mm, all CSSMRS results were predicted to be consistent with PRESS results within error.
Given that CCSMRS has been demonstrated to provide robust high-quality results, discussion can turn productively to the po-tential efficiency of this pulse sequence in terms of SNR per square root of acquisition time. In the 2-voxel implementation investi-gated in the present work, spectra were obtained in half the time of successive application of PRESS. The quality of the CSSMRS re-sults may have been affected by noise amplification in the sensi-tivity encoding reconstruction, however, as parameterized by the g factor. Therefore, the appropriate context for by using CSSMRS advantageously over PRESS is when the g factor is less than公2, which corresponds to a minimum center-to-center separation in voxels of approximately 35 mm near the center of the 8-channel head receiver coil used in this work. All patients had a g factor below this threshold.
[image:7.594.53.540.56.142.2]CSSMRS performed similarly with a short echo time, though a notable increase in the lipid peaks was observed. This increase is likely a result of the slight modification of the pulse profile and Table 5: Quantified lactate values from PRESS and CSSMRS for both voxelsa
Patient No.
CSSMRS Tumor Voxel (a.u.)
PRESS Tumor Voxel (a.u.)
Difference (a.u.)
CSSMRS Healthy Voxel (a.u.)
PRESS Healthy Voxel (a.u.)
Difference (a.u.)
1 1.31⫾0.09 1.46⫾0.08 ⫺0.16⫾0.12 0.03⫾0.04 0.23⫾0.07 ⫺0.20⫾0.08
2 3.36⫾0.11 3.16⫾0.10 0.20⫾0.15 0.60⫾0.11 0.51⫾0.11 0.09⫾0.16
3 2.83⫾0.04 2.77⫾0.04 0.06⫾0.05 0.25⫾0.04 0.28⫾0.05 0.03⫾0.06
4b 3.22⫾0.14 2.76⫾0.13 0.46⫾0.19 1.84⫾0.10 1.59⫾0.10 0.25⫾0.14
5 2.26⫾0.08 2.32⫾0.07 ⫺0.06⫾0.10 0.73⫾0.13 0.87⫾0.17 ⫺0.14⫾0.21
6 0.54⫾0.07 0.76⫾0.08 ⫺0.22⫾0.11 0.22⫾0.05 0.29⫾0.05 ⫺0.08⫾0.07
Note:—a.u. indicates arbitrary units.
a
Shown are means and standard deviations (Cramer-Rao bounds).
b
will be corrected for in the future by using outer-volume suppression.
It is also interesting to note that CSSMRS is compatible with another approach that avoids usingkspace for spatially encoding spectral information. In principle, if the flip angles assigned to each voxel can be modulated appropriately, then simple algebraic combinations of the successive spectroscopic readouts can be used to localize each voxel without sensitivity encoding recon-struction, as achieved in Hadamard spectroscopic imaging.24The
Hadamard spectroscopic imaging approach is independent of g factor and also provides improvements in SNR per square root of time but traditionally has required excellent radiofrequency fidel-ity and is sensitive to how spatial radiofrequency nonuniformfidel-ity and patient motion influence algebraic combination and the sub-sequent leakage of signals between voxels. In addition, the alge-braic combination of multiple recordings reduces the minimum temporal resolution that is achievable with Hadamard spectro-scopic imaging, whereas CSSMRS provides spectral separation in as little as a single TR value. CSSMRS and Hadamard spectro-scopic imaging are not mutually exclusive, however, and it is pos-sible that a robust hybrid technique can be developed in the future for further scan-time reductions.
Irrespective of developing such a hybrid technique, the method discussed here has potential applications in any in vivo spectroscopy experiment in which there are 2 regions of interest and the lengthy acquisition times of MR spectroscopic imaging are impractical. CSSMRS may also be beneficial in a research set-ting in which sophisticated 2D MR spectroscopy experiments have inherently long acquisition times, such as J-resolved MR spectroscopy.25Another promising application of CSSMRS is in
functional spectroscopy, in which real-time changes in metabolic information can be measured from multiple points within the brain simultaneously with high temporal resolution. Further de-velopment and applications of CSSMRS should be explored in the future.
CONCLUSIONS
CSSMRS has been developed to extract signals from 2 localized regions simultaneously and reliably. Utility was demonstrated in a clinical setting, though the technique also has promising applica-tions in research settings.
Disclosures: Karl Landheer—RELATED:Support for Travel to Meetings for the Study or Other Purposes: University of Toronto SGS Travel Award;UNRELATED: Grant: NSERC Canadian Graduate Scholarship. Sunit Das—RELATED:Grant: Canadian Can-cer Society Research Institute.* *Money paid to institution.
REFERENCES
1. Frahm J, Bruhn H, Gyngell ML, et al.Localized proton NMR spec-troscopy in different regions of the human brain in vivo: relaxation
times and concentrations of cerebral metabolites.Magn Reson Med
1989;11:47– 63
2. Spielman D, Pauly J, Macovski A, et al.Spectroscopic imaging with
multidimensional pulses for excitation: SIMPLE.Magn Reson Med
1991;19:67– 84
3. Segebarth CM, Bale´riaux DF, Luyten PR, et al.Detection of
meta-bolic heterogeneity of human intracranial tumors in vivo by1H
NMR spectroscopic imaging.Magn Reson Med1990;13:62–76
4. Brown TR, Kincaid BM, Ugurbil K.NMR chemical shift imaging in
three dimensions.Proc Natl Acad Sci U S A1982;79:3523–26
5. Maudsley AA, Hilal SK, Perman WH, et al.Spatially resolved high
resolution spectroscopy by “four-dimensional” NMR. J Magn
Reson1983;51:147–52
6. Lin FH, Tsai SY, Otazo R, et al.Sensitivity-encoded (SENSE) proton echo-planar spectroscopic imaging (PEPSI) in the human brain. Magn Reson Med2007;57:249 –57
7. Gu M, Liu C, Spielman DM.Parallel spectroscopic imaging recon-struction with arbitrary trajectories using k-space sparse matrices. Magn Reson Med2009;61:267–72
8. Posse S, Otazo R, Tsai SY, et al.Single-shot magnetic resonance
spectroscopic imaging with partial parallel imaging.Magn Reson
Med2009;61:541– 47
9. Bonekamp D, Smith MA, Zhu H, et al.Quantitative SENSE-MRSI of
the human brain.Magn Reson Imaging2010;28:305–13
10. Oshio K, Kyriakos W, Mulkern RV.Line scan echo planar
spectro-scopic imaging.Magn Reson Med2000;44:521–24
11. Bottomley PA.Spatial localization in NMR spectroscopy in vivo. Ann NY Acad Sci1987;508:333– 48
12. Frahm J, Merboldt KD, Ha¨nicke W.Localized proton spectroscopy
using stimulated echoes.J Magn Reson1987;72:502– 08
13. Chiew M, Graham SJ.Constrained source space imaging:
applica-tion to fast, region-based funcapplica-tional MRI. Magn Reson Med
2013;70:1058 – 69
14. Pruessmann KP, Weiger M, Scheidegger MB, et al.SENSE: sensitivity
encoding for fast MRI.Magn Reson Med1999;42:952– 62
15. Pauly J, Le Roux P, Nishimura D, et al.Parameter relations for the Shinnar-Le Roux selective excitation pulse design algorithm [NMR
imaging].IEEE Trans Med Imaging1991;10:53– 65
16. Inglese M, Spindler M, Babb JS, et al.Field, coil, and echo-time in-fluence on sensitivity and reproducibility of brain proton MR
spec-troscopy.AJNR Am J Neuroradiol2006;27:684 – 88
17. Haase A, Frahm J, Ha¨nicke W, et al.1H NMR chemical shift selective
(CHESS) imaging.Phys Med Biol1985;30:341– 44
18. Jin J, Liu F, Weber E, et al.An electromagnetic reverse method of coil
sensitivity mapping for parallel MRI—theoretical framework.J
Magn Reson2010;207:59 – 68
19. Allison MJ, Ramani S, Fessler JA.Regularized MR coil sensitivity
estimation using augmented Lagrangian methods.Proc IEEE Int
Symp Biomed Imaging2012;32:394 –97
20. Allison MJ, Ramani S, Fessler JA.Accelerated regularized estimation
of MR coil sensitivities using augmented Lagrangian methods.IEEE
Trans Med Imaging2013;32:556 – 64
21. Chen L, Weng Z, Goh L, et al.An efficient algorithm for automatic
phase correction of NMR spectra based on entropy minimization.J
Magn Reson2002;158:164 – 68
22. Poullet JB, Sima DM, Simonetti AW, et al.An automated quantita-tion of short echo time MRS spectra in an open source software
environment: AQSES.NMR Biomed2007;20:493–504
23. Li Y, Xu D, Ozturk-Isik E, et al.T1 and T2 metabolite relaxation
times in normal brain at 3T and 7T.J Mol Imaging Dyn2012;1:1–5
24. Horska´ A, Barker PB.Imaging of brain tumors: MR spectroscopy
and metabolic imaging.Neuroimaging Clin N Am2010;20:293–310
25. Ryner LN, Sorenson JA, Thomas MA.Localized 2D J-resolved1H
MR spectroscopy: strong coupling effects in vitro and in vivo.Magn