ON
BASE STABILITY
A report submitted in partial fulfilment of the requirements for the degree of Master of Engineering at the University of Canterbury, Christchurch, New Zealand
by
In this investigations, the effects of particle shape and gradation on the performance of unbound granular pavements were examined. The test was carried out on full scale road structures at the Canterbury Accelerated Pavement Testing Indoor Facility (CAPTIF).
Rounded and angular aggregates with different gradations were tested as a basecourse layer in flexible pavements for which sui table subgrade was provided and the subbases were excluded.
Density, moisture content, and sieve analysis tests were carried out before and after the experiment. Deflections and vertical deformations were measured frequently after specified intervals of loading.
Performance was evaluated by comparing compactive effort, deflections and vertical deformations. The cohesiveness of fines and blending of materials were found to be important factors. Particle shape has relatively greater influence on the performance than the aggregates' gradation.
The author wishes to thank his supervisor
Mr.B.D.Pidwerbesky for his guidance, assistance,
suggestions and critical comments throughout the work. The author acknowledges the invaluable assistance of Mr. A.W. Fussel, CAPTIF Technical Officer, in this project.
Laboratory and Construction divisions of PAVROC Holdings Ltd. are gratefully acknowledged for their careful testing and construction of the pavements.
The generous financial support for this research was provided by the National Roads Board, Wellington.
Finally, the author would like to dedicate this report to his family.
ABSTRACT
ACKNOWLEDGEMENTS TABLE OF CONTENTS LIST OF TABLES LIST OF FIGURES LIST OF PLATES
CHAPTER I INTRODUCTION 1.1 Introduction
1.2 Need for the Research
1.3 Objective for the research CHAPTER II THEORY AND LITERATURE REVIEW
2.1 Introduction
2.2 Aggregate: Roading Material
2.3 Factors which Influence Aggregates' Performance
2.3.a Particle Shape 2.3.b Gradation
2.3.c Cohesiveness of Fines 2.3.d Moisture Content
2.3.e Compaction 2.3.f Segregation
i i i i i i
v
vi
vii
1
1
2 3
4 4
4
4
5 5
7
7
7
8
2.4 Pavement Thickness Design 8
2.5 Summary 9
CHAPTER III DESIGN AND CONSTRUCTION OF TEST PAVEMENT 10
3.1 Introduction 10
3.2 Structural Design and Design Load 10
3.2.a Subgrade 10
3.2.b Geomembrane 12
3.2.c Basecourse 12
3.2.d Friction Course 12
3.3 Basecourse Material 13
3.3.a Selection 13
3.3.b Procurement 15
3.3.c Laboratory Tests 16
CHAPTER IV
CHAPTER V
CHAPTER VI
3.4.a Subgrade 3.4.b Geomembrane 3.4.c Basecourse 3.4.d Compaction 3.4.e Modification 3.4.f Friction 3.5 Summary
TESTING ROUTINE 4.1 Introduction 4.2 Procedure 4.3 Facility 4.4 Loading
Course
4.4.a Load Distribution
4.5 Pavement Performance Monitoring 4.5.a Density and Moisture Content 4.5.b Deflections
4.5.c Vertical Deformations OBSERVATIONS AND DISCUSSION 5.1 Introduction
5.2 Subgrade
5.3 Friction Course 5.4 Geomembrane
5.5 Placement of Material 5.6 Compaction of Basecourse 5.7 Gradation
5.8 Deflections 5.9 Deformations
CONCLUSIONS AND RECOMMENDATIONS 6.1 Conclusions
6.2 Recommendations BIBLIOGRAPHY OF REFERENCES
APPENDIX A CANTERBURY ACCELERATED PAVEMENT TESTING
INDOOR FACILITY
APPENDIX B GRADATION ENVELOPES
APPENDIX C DENSITY - COMPACTION RELATIONSHIP APPENDIX D LOAD - DEFLECTION RELATIONSHIP APPENDIX E OBSERVATION TABLES
Table
3.1 NRB M/4 (1985) Grading envelope 3.2 Gradation envelope (Target) 3.3 Subgrade density
3.4 Thickness of Basecourse 4.1 Basecourse moisture content 4.2 Deflections
4.3 Centreline rut depths
4.4 Thickness of friction course
5.1 Comparison of deflection and rut depth 5.2 Relation between density and compaction 5.3 Segment A - Gradation envelope (Target and 5.4 Segment G - Gradation envelope (Before and E1 Sieve analysis (Before and After)
E2 Sieve analysis (Actual) E3 Subgrade Profiles
E4 Optimum Moisture Densities
v
Page
13
15
17
20
27
29 31
31
34
34 Actual) 36 After) 38 77 77 78
Figure
3. 1
3.2
3.3.a
3.3.b
4.1
4.2 4.3
5. 1
B1 to B9 B10 to B15 C1
C2 C3
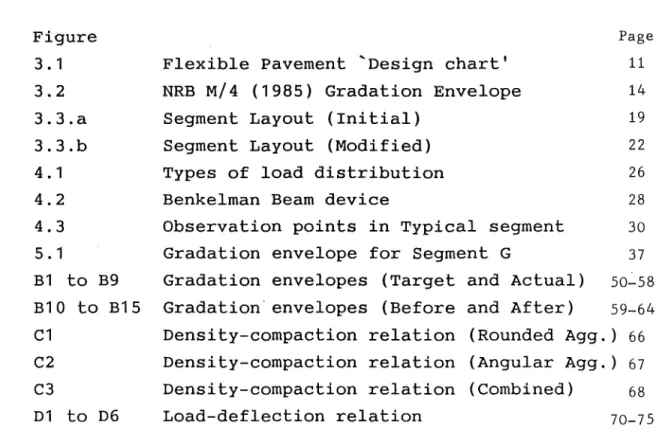
D1 to D6
Flexible Pavement 'Design chart' NRB M/4 (1985) Gradation Envelope Segment Layout (Initial)
Segment Layout (Modified) Types of load distribution Benkelman Beam device
Observation points in Typical segment
Page
11 14
19
22
26
28
30
Gradation envelope for Segment G 37
Gradation envelopes (Target and Actual) 50-58
Gradation' envelopes (Before and After) 59-64
Density-compaction relation (Rounded Agg.) 66
Density-compaction relation (Angular Agg.) 67
Density-compaction relation (Combined) 68
Plate Page
p 1 Compacted Subgrade 79
p 2 Geomembrane 79
p 3 Placing of Basecourse 80
p 4 Rutting in Segment I 80
p 5 Trafficking Simulation 81
p 6 Profilometer 81
p 7 Localised Segregation 82
p 8 Typical Bulging in the segment 82
CHAPTER I
INTRODUCTION
1.1 Introduction
New Zealand has a huge quantity of river deposits, which tend to be rounded aggregates. It is desirable to accommodate the widest possible range of aggregate types, while satisfying other criteria, in the specifications. While framing the specifications, economic and technical factors should be considered. The use of locally available material for road construction is a very common practice to achieve economy in reading projects. For example, the use of rounded aggregates minimises aggregate crushing cost. The specifications are updated periodically, taking in to account the past performances of pavements and the recommendations of various research projects.
The purpose of this research project described in this report is to check the performance of rounded and angular aggregates. In an unbound flexible pavement structure, the performances depends mainly on the subbase and basecourse aggregates, subgrade material, drainage conditions and loading pattern. Using the specific maximum size, specific percentage of each size and shape of aggregates is a proven method of improving performance of unbound flexible pavement. In addition i t also improves the performance of other factors, for example drainage. Timpany (1974) , Yeoh (1978) and other researchers have shown that particle shape and void ratio influence the stability of an unbound flexible pavementts's basecourse.
1.2 Need for the Research
The National Roads Board, through its Road Research Unit (RRU), has been carrying out research on unbound granular pavements since 1969 (Smith 1974). For example RRU Research Project No. BC/2, titled "Factors which affect the stability of unbound basecourse pavements", was conducted to compare the properties of 'sound' and 'failing' unbound thin surfacing pavements (Tonkins and Taylor 1972 ).
The influence of shape and gradation on unbound granular basecourses with thin surfacing was examined in RRU Research Project No. BC/19, titled " The influence of particle shape and grading on the performance of unbound basecourse material" (Yeah 1978). The research was divided into two distinct stages, viz. laboratory tests and full scale road structure tests at The University of Canterbury Pavement Test track. Laboratory tests were performed to measure the particle shape and its relation with compactibility of base course aggregates. The full scale road structure was constructed with the 1974 NRB B/2 specifications using nine different basecourse materials. The results indicated that the shape of aggregate does not have much influence on pavement performance. The aggregate gradation was found to have a greater influence on performance, than the shape.
This conclusion was drawn by assuming no particle and moisture movement took place during the test. Moreover, the research did not consider the percentage of rounded versus angular particles in each sieve range.
The performance of the aggregates should have been observed by isolating the shape and gradation factors. In addition to this isolation, all sizes in each type of aggregate should be considered when comparing shape of aggregates. Moreover, the revised NRB Specification B/2 ( 1985) should be considered for the construction of full scale road structure. Thus to obtain the performance of shape and void ratio, elastic deflections and permanent
deformations were measured at CAPTIF under ideal
1.3 Objective of the Research
The objective of the project is to examine the influence of
1. Void Ratio and 2. Particle Shape
of aggregates on the performance of thin surfaced uribound basecourse flexible pavement.
The pavement performance is influenced by many factors such as particle shape, movement of particles, moisture content and movement, subgrade CBR, compactive effort and loading condition. To isolate the effect of the shape and void ratio, other factors are to be constant during the test or have a minimal influence.
The aggregates are used only for a basecourse layer and no subbase layer is provided. This helps to isolate the influence of the aggregates on base stability.
CHAPTER II
THEORY AND LITERATURE REVIEW
2.1 Introduction.
Aggregate performance depends on many factors such as shape, gradation, moisture content, compactive effort, density, cohesiveness of fines and method of placing. This chapter briefly discusses the relation between those factors and aggregate performance. The emphasis of the literature review is on the research of the shape and gradation properties related to the aggregate performance.
2.2 Aggregate : Reading Material
An aggregate is defined as a collection of homogeneous particles. The function of aggregate in a pavement system is to transfer and distribute stresses induced by wheel loads. An aggregate layer needs to be compatible with the adjacent layer. Aggregates are required to retain their stability throughout the design life of the pavement. The characteristics of the aggregates should also be sui table for ease of construction.
2.3 Factors which influence aggregate performance
The characteristics of aggregates will be influenced by a variety of factors which may or may not
manifest themselves depending on the particular
circumstance prevailing. The research on aggregate performance has been monitored in New Zealand since 1969
influencing discussed.
factors
2.3.a Particle Shape
to this project are further
Particle shape can be defined on the basis of angularity number, flakiness index or the elongation index as described in B.S.812. But in practice, particle shape is classified as either angular or rounded. Angular aggregates will have angular faces which contribute to aggregate interlock and a rough surface texture which inhibits movement of one particle on another. This interlocking produces higher bearing capacity compared to rounded aggregates (Yoeh 1978). The angular aggregates requires less compacti ve effort to achieve maximum density.
The combination of angular and rounded aggregates offers better economical appraisal to the project if both types of material are available locally. The cost of the project is directly related to the haul distance
(O'Flaherty 1974). The haul distance will be
considerably less if suitable borrow pits either angular or rounded aggregates are available in the vicinity of the project. The use of both type may be justified by economical haul distance and its sutability as a roading material.
2.3.b Gradation
In an aggregate mass, the presence of different sizes and their percentage of the aggregate is termed as
gradation. The smaller size particles will be
this regard was introduced by Talbolt and Richard using gradation exponent 'n' (Kerbs and Walker 1971).
The gradation is specified by the maximum and minimum size of the aggregate and the gradation exponent with the following relationship
P=(d1/D1)n*100%
Where P
=
percentage passing the sieve size d1 01=
maximum particle sizen
=
gradation exponent.The aggregate performance depends on uniform distribution of individual size in order to produce maximum shear resistance but at the same time sufficient
air voids are required in the mix to ensure
permeability. The gradation envelope or curve should be such that the aggregate mass should produce maximum density. The maximum density may be achieved at gradation exponent n
=
0.5. (Kreb and Walker 1971)Bartley (1984) has documented that large (40 mm maximum) size aggregates are more rigid than those with small (20 mm maximum) size material. RRU Research Project No.BC-16A titled " Marginal aggregate pavement trials Quarry Road, Drury" (Bartley 1984) indicated that there is no difference in the performance of 40 mm and 20 mm as maximum size aggregates. The NRB M/ 4 specification allows use of both size as maximum size aggregates.
Another approach to the functional relationship P
=
(d1/D1)n *100% was studied by Salt(1977). He related grading shape with ratioconsecutive two sizes in
of percentage passing of the mix. The practical application of this relationship has proven to be difficult.
The functional relationship was studied by changing gradation exponent n value from 0.4 to 0.7 and the results were documented in RRU bulletin 67 (Bartley 1984). The conclusion of the project showed that even
for 'marginal' aggregates The quality of the
Fang (1979) indicated that n=0.6 has lower stability compared with n=O. 5 and 0. 4. The NRB M/ 4 1985 specification allows a range of n values from 0.4 to 0.6
2.3.c Cohesiveness of fines
A dense matrix of aggregates is a result of well graded material containing just enough fines as "binder"
to small voids. The binding characteristics of fines is
directly proportional to it's cohesiveness. Hence the
presence of cohesive fines in the aggregate mix is essential to obtain a stable mix.
2.3.d Moisture Content
The moisture in the mix should be controlled closely. Lesser percentage of moisture will produce an open mix while a higher percentage of water will develop plasticity within the layer. In the short term water
will have a direct influence on the strength
characteristics of the aggregate mass. In the long term water acts as a weathering agent. Excessive water should be drained off from the layer. The movement of desired moisture will lead to instability in the pavement structure (Bartley 1980).
The major engineering properties:- density and
moisture content are almost synonymous. This
generalisation has its limit. It tends to breakdown with
high water content.
2.3.e Compaction
and air voids will again develop within the material termed as dilatancy. Therefore compactive effort should be such that material should reach its maximum density and at the same time dilatancy should not develop.
The degree of contact depends on water content and type of compactive equipment.The compactive effort can be classified into four types viz. static, kneading, impact and vibrative. Depending upon the type of
material compactive effort can be applied
proportionally. The selection of type of equipment is also related to the basecourse material and its density. For example, NRB B/2 Specification specifies a maximum number of passes of a particular type of equipment with a given load and frequency. The effect of compaction on the basecourse layer depends on engineering properties such as density, elastic shear stiffness, shear strength, angle of friction, permeability and the equilibrium of saturation ( Thorn and Brown, 1987).
2.3.£ Segregation
The placing of aggregates should be done carefully. Dropping the material more than 1 m will lead to segregation i.e. fine particles will be separated from the coarser particles which will produce an accumulation of the same size particles at different locations. A localised deformation will be the response from the pavement structure due to the segregation.
2.4 Pavement Thickness Design
Flexible pavements are generally designed by the method 'Multilayer Elastic Theory'. This analytical method has two limiting criteria: a vertical compressive strain or horizontal tensile strain. For unbound granular aggregate pavements with thin seal surfacing vertical compressive strain is a limiting criteria. The combination of design variables like subgrade CBR, loading and the thicknesses of layers can be related by the charts. The design standards employed for this project are specified in the State Highway Pavement Design and Rehabilitation Manual (1987)
2.5 Summary
Aggregate performance depends on many factors
which are related to each other; for example,
CHAPTER III
DESIGN AND CONSTRUCTION OF TEST PAVEMENT
3.1 Introduction
This experimental study examines the performance of different gradations and different shapes of aggregates as a basecourse layer in unbound, flexible thin-surfaced road structures. Nine different samples were produced by changing the gradation exponent for angular and rounded aggregates. Combinations of angular and rounded aggregates
for the same gradation exponent were also used as test segments. This chapter deals with the structural design, materials and construction of full the scale road structures.
3.2 Structural Design and Design Loading
The project was aimed at comparing the shear resistance of each basecourse material sample. For structural design, State Highway Pavement Design and
Rehabilatation Manual (NRB, 1987) was followed.
Considering the main aim of the project, no subbase was provided. This ensured that the performance of the pavement was related to only the basecourse. The design chart and thickness of base course are shown in Fig.3.1.
Fong (1978) observed that for a similar basecourse material the significant difference of performance was at 2.5
*
10 5 EDA's. The designed loading for this project was also considered as 2.5*
10 5 EDA's which is an optimum time of usage of the facility considering the operating costs.3.2.a Subgrade
....
0
Ill Ill
~400
.)(.
u
:c
...
I'll
() 500
...
DESIGN CHART FOR PREMIUM FLEXIBLE PAVEMENTS WITH THIN SURFACINGS
FIGURE 3.1
~ote
1 Thcz curves giver minimum
cover Nquir«d above the sub· grade. Allowance must be mad« for loss of material through penetration Into soft subgradiZs and construction toleranc11s.
Material$ for use in hatchcrd 25 zon~r must satisfy PG:rrmability
requlrcrments SE >40
15
caR
10ensure that all the base course materials are tested under similar conditions. The subgrade material was selected so as to achieve: a> confirmation of the subgrade compaction to a desired value as per NRB Specification F/1 (1986) and b> saving of
eliminating the removal and replacing of the material.The subgrade aggregate was placed
time by subgrade over the existing foundation in the track, which was Port Hills loess. Scala Penetration Tests were conducted on the foundation material and the inferred CBR value was greater than 25. It was assumed that the CBR value of the subgrade aggregate was greater than 25.
3.2 b Geomembrane
An impermeable layer of geomembrane placed at the basecourse-subgrade interface. It was needed to restrain any possible vertical movement of moisture and fine particles. A thin ( 0. 5
composed of butynol was
mm), flexible geomembrane selected because the high
elastcity, this material would not promote the
development of shear plane failure at the interface.
3.2 c Basecourse.
With the assumed value of loading and the known value of subgrade CBR, the minimum required basecourse thickness was determined as 125 mm. The basecourse material used for the test complied with the NRB Specification M/4 (1985) with maximum particle size of 37.5 mm. Nine different types of basecourse material were used for the test segments, which are discussed in article 3.3.
3.2 d Friction Course
degree of control (iii) the friction smooth, deformable
during placement is available, and course surfacing
surface that
provides a very permits accurate measurements of surface profiles.
3.3 Basecourse Material
3.3.a Selection
Basecourse aggregates consisting of all angular, all rounded, and various combinations of angular and rounded particles were selected for study. The gradation envelope range for basecourse aggregates as per NRB Specifications M/4 (1985) is given in Table 3.1 and graphically presented in Fig 3.2 .
TABLE 3.1 Grading Envelope
Test Sieve Aperture Percentage Passing
(mm) (Percent %)
37.5 100
19.0 66 - 81
9.5 43 - 57
4.75 28
-
432.36 19
-
331 . 18 12 - 25
0.600 7 - 19
0.300 3 - 14
0. 1 50 10 Max.
0.075 7 Max.
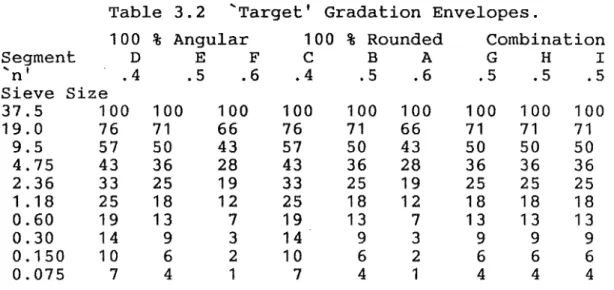
In this gradation envelope, the lower limit of the gradation envelope corresponds to the percentage passing is at the gradation exponent n=0.6 while the upper limit is 0. 4. Therefore three gradation exponents were selected: n=0.4, 0.5 and 0.6. This produced three pairs of samples of 100 percent angular and 100 percent rounded aggregates. The three combinations of fractions of angular and rounded aggregates ( ie. 30 % rounded, 50 % rounded and 70 % rounded; the remainder,angular ) with constant n=0.5 were selected. The percentages, 30,50 and
70, were selected to derive any percentage of
100 90 IJO 70 60
50
l
t
J
,
IUNIVERSITY OF CANTERBURY. Department of Civil Enginttering.
NRB
M/4 { 1985} Gradation Envelope
A
7···
/
7
.
/
v
/
/
..
.
.
.
.
/
v
.
/
.
,.
.
v
.
.
.
/
.
.
.
II
I
I
I
I
..
/
..
..
--Upper Limit
.. ... Lower Limit
I
75l!JTI 150l!JTI 300l!Jn IWOlJ.ffl t.t8mm 2.JfJmm 4.75mm 9.5mm t!imm J7.5mm
-SIEVE
upper limit, approaching 0 9 basecourse
greater than 70%, were to be treated as % and 100 % respectively. Thus a total of samples were selected and tabulated in Table 3.2, as 'Target' gradation envelopes.
Table 3.2 "Target' Gradation Envelopes.
100 % Angular 100 % Rounded Combination
Segment ... D E F
c
B A G H In' . 4 .5 .6 .4 . 5 .6 . 5 .5 .5
Sieve Size
37.5 100 100 100 100 100 100 100 100 100
19.0 76 71 66 76 71 66 71 71 71
9.5 57 50 43 57 50 43 50 50 50
4.75 43 36 28 43 36 28 36 36 36
2.36 33 25 19 33 25 19 25 25 25
1 . 18 25 18 12 25 18 12 18 18 18
0.60 19 13 7 19 13 7 13 1 3 13
0.30 14 9 3 14 9 3 9 9 9
0.150 1 0 6 2 10 6 2 6 6 6
0.075 7 4 1 7 4 1 4 4 4
3.3.b Procurement
When a specified gradation can not be produced from the same source of aggregates, blending is required. It is a common practice that aggregates of closely graded sizes may be subsequent remixed in the desired proportion. The geological source may be different for different particle sizes. The cohesiveness may differ within the same mix. Subsequently, this may affect the performance of the aggregates. Moreover, the process of combining the aggregates is a complicated procedure. A mathematical and graphical systems for blending of aggregates from different resources is discussed by O'Flaherty (1974) and Atkins (1980).
The "Target' gradations were provided to the reading contractor. The reading contractor blended materials from various sources to meet the "Target'
gradations. The same contractor procured the
minor changes. Those changes were within the range of the specifications and therefore the contractor was requested to deliver the material. To get the targeted gradation envelope, the contractor blended the material from different quarries: Hasketts Rd. quarry, Coutts Island quarry, Miners Rd. quarry and Pavroc Industries. Due to the blending required for each type, delivery of material was delayed by 6 weeks.
3.3 c Laboratory Tests
To avoid further delay in the project, the material delivered on site was immediately placed in the test segments. Meanwhile the following laboratory tests were carried out:
a > Sieve Analysis : This test was carried out
before and the end of experiment as per NZS 4402 : 1986 test 2.8.2 and the results are tabulated in Appendix E.
b > Optimum Moisture Content: This test was conducted as per NZS 4402 part 2 2P 1980 test No.14 for all test material. Appendix E containts graphs of the moisure content versus density relationship.
c > Shape of aggregates: Shapes were identified
by close visual inspection of representative samples.
3.4 Construction
The construction was carried out according to NRB Specification B/2 (1985). The track was divided into nine equal segments of 6 m each, as shown in fig.3.3.a .
3.4.a Subgrade
concrete face thickness of
of the
the wall to accommodate a uniform basecourse layer. Densities were monitored for each segment.
The uniform strength of the subgrade throughout the test track was confirmed by measuring densities at the centre of each test segment as shown below.
Table 3.3 Subgrade Density
Segments A B
c
D E F G H IDensi~y
(Kg/M )
2190 2160 2000 2210 2250 2210 2280 2220 2240
The profiles were measured by straight edge. At the centre of each segment the straight edge was placed on the top of a concrete wall and the depth to the subgrade was measured every 200 rnrn. After the experiment the subgrade profiles were measured by the same method. The initial and final profiles are given in the Appendix E. A compacted subgrade material is shown in Plate 1.
3.4.b Geomembrane
The geomembrane used in this project was 0.5 mm Dunlop Butynol sheeting. The geomembrane was laid in a transverse direction to wheel movement. A minimum 100 mm overlap was maintained to avoid slippage of the membrane during construction and applied loading. Geomembrane sheets were extended up to the face of the concrete side walls to avoid migration of moisture through the sides. The placing of geomembrane is shown in Plate 2.
3.4.c Basecourse
The track layout is shown in fig. 3. 3 a. Only three sheets of geomembrane 1000 mm wide each were laid initially to avoid disturbance by the loader. The placing of the material from the stock pile was done by loader. The height of drop of the material was kept as low as possible ( max. 300 mm) to avoid segregation while placing. The material was levelled by hand racking and the levelling was checked by straight edge. As the
placing of material proceeded, the remaining
geomembrane was laid. A removable partition was used to
separate the segments during placement of the
aggregates, to avoid mixing of materials. The placing of material by loader, the wooden partition and the straight levelling edge is shown in Plate 3.
The placing of material was started from segment C (Station No.18), and segments D,B,E,A,F,I,G and H completed in sequence. A 4 m. length of the track (Stn.48 Stn.52 ) was not used for test material because it was adjacent to the main entrance, and access to the track was over this section. Basecourse material (NRB Specification M/4, 1985) was placed between Station.48 and 52 for continuity of the basecourse layer.
3.4.d Compaction
To add sufficient water for compaction and to spray the water uniformly a perforated pipe was initially tried. The quantity through this sprinkler system was insufficient and therefore this method was abandoned. The water was sprayed manually with care to achieve uniform distribution. The initial spray was just sufficient for compaction needs.
t - - - 2 7 . 7 0 m - - - 1
f - - - 13.85m - - - 1
Segment Layout (Initial)
content and density at the centre of all the segments were monitored for each pass by nuclear densometer. Water was uniformly spread during the compaction.
The material was placed to a depth of 125 to 150 mm thick. Table 3. 4 shows the compacted thickness for different segments.
Table 3.4 Thickness of Basecourse
Test A B
c
D E F G HSegments Compacted
Thickness 108 11 0 115 110 103 114 1 01 104
(mm)
---
- ---- --
---The compaction was monitored by recording the density of each segment after each pass of the roller. The density versus number of passes relationship is plotted in Appendix C. As a ready reference, a typical graphical representation is shown below. It was noted that the contractor's crew and overseer were unfamilier with this practice of checking the density after each pass of the roller, though they were referred to by the contractor as " one of their most experienced teams".
While monitoring the density it was observed that the densities of segments D,E,F,G and H were increasing while, those of segments C,B,A and I were decreasing. After six passes of vibrating static force was applied but the same results continued. After two passes of static roller, the condition of segments C, B, A and I became that of total loose material. A pneumatic 7 tyre, 7 tonne roller was used to compact the C,B,A and I segments. The results were still worse. Shoving developed. The deformation in the segment I is shown in Plate 4. The roller sunk in the basecourse material. Therefore at this stage it was decided to remove segments C,B,A and I from the testing.
3.4.e Modifications
The basecourse material of segments C,B,A and I were removed carefully, so as to save the geomembrane. To continue the test, 100 percent rounded material
(Christchurch - M/ 5 ) was used to replace the segments and is designated as the A-1 segment in further discussion. The same geomembrane was laid after the inspection of subgrade profile. A-1 segment material was placed in the track directly from the truck. The material was levelled in similar manner to the earlier method.
A-1 material had sufficient water content for compaction, hence no additional water was spread. The 2 ton, 2500 vibrating frequency roller was used for a total of four passes. This compactive effort was restricted to only the A-1 segment.
Then, in the final stage of primary compaction two passes of the pneumatic tyre roller was used over all segments. The circular shape of the test track restricted the use of the pneumatic tyre roller. Seven passes of the static roller completed this compaction phase.
A minor modification was carried out for the segment F when the surface showed an open mix over about 60 % area. Hence approximately 0.8 M3 crushed quarry dust of 5 mm was sprayed over an area of 14 M2 . This segment was compacted with 1 ton vibrating roller for six passes. A revised layout of test segments with these modifications is shown in Fig. 3.3.b .
Segment
Layout ( Modified)
3.4.f Friction course.
A prime coat of hot bitumen ( 60 % bitumen and 40 % kerosene ) was applied at 0.6 l/M2 on the surface and was left for two days before the friction course was laid. A bituminous mix with 5. 5 percent bi tume,n content was laid with the paver. A uniform thickness of approximately 50 mm was maintained. Static and vibrating roller of 2 ton was used for two passes each in final compaction.
3.5 Summary
In the design, NRB's standard design procedure was followed. Basecourse material was selected in order to yield different shapes of aggregate and gradation envelopes. A geomembrane was used to remove any effect of moisture and fines migration on the stability of the pavement.
During the construction, the present NRB B/2 (1985) specification was strictly followed. A uniform strength
of subgrade throughout the track was achieved.
4.1 Introduction.
TESTING ROUTINE
This chapter contains a description of the testing routine measurements and observations. The loading was continued until a significant difference in the performance of the various segments was noticed. The moisture content, densities, surface profiles and elastic deflections of the basecourse and subgrade were measured. The Profilometer, Densometer and Benkelman Beam were used for in situ testing at the Canterbury Accelerated Pavement Testing Indoor Facility ( CAPTIF). Sieve analysis of granular samples was carried out at the University's Highway Engineering laboratory.
4.2 Procedure
A recording method was established to document the observations. For this investigation, a procedure was established as follows:
i> Sieve analysis of a sample of the basecourse material before and after the experiment.
ii> Monitor density and moisture content of subgrade and the basecourse layer.
iii> Measure deflections and profiles at 0 EDA, 1000 EDA's and then after every 10,000 EDA's until significant difference in performance is observed.
iv> Determine moisture content of the basecourse and subgrade at the end of experiment.
4.3 Facility.
The Canterbury Accelerated Pavement Testing Indoor Facility (CAPTIF) contains an innovative machine that was designed for accelerated testing and evaluation of
replicating, the effect on the pavement of actual road traffic conditions. The physical characteristics, loading system and control systems of CAPTIF are discussed in the Appendix A.
4.4 Loading
For this project, the total design loading was selected to be 2.5 *10 5 EDA's. The two vehicles (single axle, dual-wheel configuration of the machine were loaded to 40 kN each, representing 1 EDA. Thus in one revolution, the machine was producing 2 EDA's. Vehicles A and B were fixed with dual bias and dual radial tyres respectively, to represent a mix of tyre types found on the roads. The radial movement of 500 mm on the either side of the arm offers multiple wheel path loading which was used to simulate real traffic conditions.
4.4.a Load Distribution
The initial load distribution was carried out at 20 Km/h. This speed was continued for the first 2, 000 EDA's, in order to satisfy NRB Specifications B/2 (1985). Across the full trafficked width, the arm position was changed every two revolutions. This initial conditioning was completed with uniform distribution of loading.
After the conditioning, the speed of the vehicle was increased to 40 Km/h. The load distribution pattern was also changed from uniform to gaussian type. In this type of distribution, the frequency of the arm position at the centre of the trafficked width was higher than at the sides. Uniform and guassian type load distributions are shown in fig.4.1 .
4.5 Pavement Performance Monitoring
>-LJ
z
w::J
a
w
cr:.
u_
9
8
. 7
6
LL
2
1
Load Distribution Pat terns
o 1b 2b 3b
4
10
sb
6b 7b
ab
9b 1bo
RAM POSIT I ON
Rectangular
0+-~--~~-T--~~~--~~~
0
10 20 30
40 50 60 70 80
~0100
RAM POSIT I ON
Guassian
nuclear density meter, Benkelman Beam device and Profilometer respectively.
4.5.a Density and Moisture Content
In this project, subgrade density and the density achieved during compaction of the basecourse layer were measured by the Densometer documented in section 3. 4 a and 3. 4 d respectively. The moisture content for the basecourse layer was also recorded by using the same device. The moisture content was recorded for the basecourse layer
pavement and after just
the given in Table 4.1 .
before surfacing experiment. These
sealing results
Table 4.1 Basecourse Moisture Content
Test segments A1 D E F G
Moisture content.before 3.0 2.0 2.0 2.0 2.0
Moisture content. after 3.6 2.7 2.7 2.4 2.9
4.5.b Deflections
the are
H
2.0
2.2
Benkelman Beam device measures elastic deflections of the pavement;temporal changes in the deflections are related to changes in the pavements' structural capacity. An advantage of this device is that it is a non.destructive test. The device is schematically shown in Fig 4.2 .
ELEVATION
\_,.,
,,
...
POSITION 1 - FRONT VIEW PROBE BETWEEN DUAL TIRES
SHOWING DEFLECTION.
\ _
Adjustable Rear Support
Adjustable
Front Support
(not 10 scale)
Benkelman Beam Device
GAUGri
p~
7
(ijVEM~T
,
POSITION 1 - SIDE VIEW DIAL GAUGE IS ZtROED.
~
~
~'x'rb.
t·
---~ IS
-POSITION 2 - SIDE VIEW
DUAL TIRES HAVE MOVED FORWARD 'x' METERS. DIAL GAUGE IS READ TO GIVE REBOUND (DEFLECTION).
Measuring Rebound Deflection with Benkelman Beam
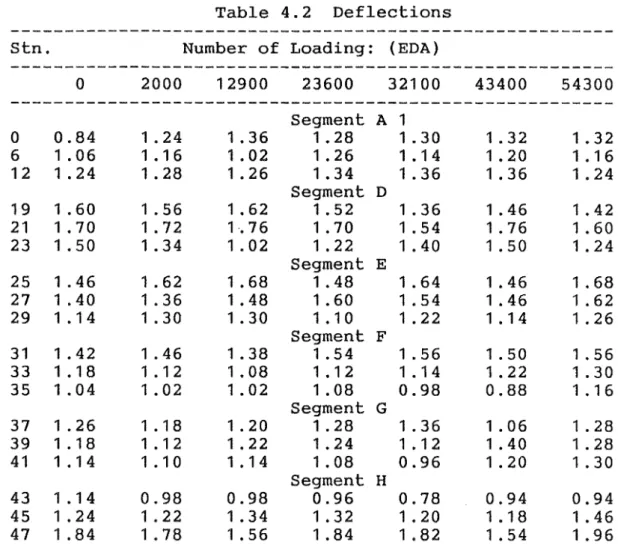
Table 4.2 Deflections
---
---stn. Number of Loading: (EDA)
---
---0 2000 12900 23600 32100 43400 54300
----
---Segment A 1
0 0.84 1 . 24 1 . 36 1 • 28 1.30 1. 32 1. 32 6 1 . 06 1 . 1 6 1. 02 1.26 1 . 1 4 1 . 20 1.16 12 1 . 24 1. 28 1. 26 1.34 1.36 1. 36 1. 24
Segment D
19 1 . 60 1. 56 1. 62 1.52 1 . 36 1 . 46 1. 42 21 1.70 1. 72 1 . 76 1 . 70 1. 54 1. 76 1. 60 23 1 . 50 1.34 1.02 1.22 1. 40 1. 50 1. 24
Segment E
25 1.46 1 . 62 1 . 68 1.48 1. 64 1. 46 1 . 68 27 1 . 40 1 . 36 1. 48 1.60 1. 54 1 . 46 1 . 62 29 1 . 14 1 . 30 1. 30 1 • 1 0 1 . 22 1.14 1. 26
Segment F
31 1.42 1 . 46 1. 38 1 . 54 1 . 56 1. 50 1 . 56 33 1 . 18 1 . 1 2 1.08 1 . 12 1.14 1. 22 1 . 30 35 1.04 1.02 1.02 1.08 0.98 0.88 1 . 1 6
Segment G
37 1 . 26 1 . 18 1 . 20 1.28 1. 36 1.06 1 . 28 39 1 . 18 1 . 1 2 1. 22 1.24 1 . 12 1 . 40 1.28 41 1 . 1 4 1.10 1.14 1. 08 0.96 1. 20 1. 30
Segment H
43 1 . 1 4 0.98 0.98 0.96 0.78 0.94 0.94 45 1 . 24 1 . 22 1 . 34 1 . 32 1 . 20 1.18 1. 46 47 1 . 84 1. 78 1.56 1 . 84 1 . 82 1 . 54 1. 96
---4.5.c Vertical Deformations
The permanent vertical deformation is an indicator of the degree of compression of the pavement's layers. The compression is related to the aggregate performance. The vertical deformation is effectively measured by the profilometer. The Profilometer and X-Y plotter used to record profiles are shown in Plate 6.
The beam end supports were kept at the exact location of each required station. The carrier's position was moved to the inner face of the track in order to establish datum. As the carrier travelled from inner face to outer face, the profile was recorded on the chart recorder.
carried out before it was used. The profiles were measured at three locations for each segment as shown in Fig.4.3. A typical surface profile is shown in Fig.4.4. The centreline rut depths were measured from the surface profile chart which are given in Table 4.3 .
Table 4.3 Centreline Rut Depths
Centreline Rut Depths (mm)
Load Segment A1 D E F G H
(EDA's)
0 0 0 0 0 0 0
2000 4 6 8 5 7 3
12900 6 12 13 9 11 5
23600 7 16 19 11 14 7
32100 8 19 21 14 19 9
43400 10 21 25 16 23 10
54300 12 25 36 18 28 14
At the end of the test, thickness of the friction course was measured at the centre of each segment. The thicknesses at 0 and 54300 EDA's are tabulated below.
Table 4.4 Thickness of Friction Course
Segments A1
Thickness at 0 EDA 48
Thickness at 54300 EDA's (mm) 45
D
54 49
E F G H
51 45 45 42 45 40 38 35
CHAPTER V
OBSERVATIONS AND DISCUSSION
5.1 Introduction.
Information obtained from the testing program is presented and discussed in this chapter. The influence of the shape of aggregate and the void ratio is examined by analyzing and comparing several indicators, such as
density, permanent vertical deformation, deflections and compactive effort.
5.2 Subgrade
Referring to section 3. 4 a and Table 3. 3, density results indicated that all segments of the basecourse were supported by subgrades of equal density. Hence it is assumed that all segments were tested under a uniform subgrade condition.
There are differences in the initial and final profiles of the subgrade for all the segments as given in Appendix E. The differences were within the range of 5 to 15
rrtm.
This deformation was consistent across the test segments.5.3 Friction Course
The differences between the initial and final thicknesses of the friction course were within the range of 3 to 7 mm Table 4. 4 ) . This deformation within the surface wearing course had a negligible effect on the pavement performance.
5.4 Geomembrane.
path. The perforations covered about 80 percent of the area for the segments D,E,and F while for the segments G and H i t was 60 to 70 percent. The perforation in the segment A-1 covered only 40 percent of the area. This was due to the 100 percent angular particles present in the D,E, and F, while A-1 had rounded particles.
The perforations may have permitted a small change in the moisture content of the basecourse material, when comparing its percentage before and after the test. The comparison is tabulated in Appendix E The basecourse layer was sealed by.the prime coat and the friction course. But the sealing can not be done near the concrete walls of the test track due to the limitations of the paving equipment. This 250 mm wide strip near the walls was all around the track. The moisture may have been absorbed by the basecourse material through this open strip. However, moisture content measurements were taken using nuclear density meter and not with a standard laboratory method. The laboratory equipment was not available at the test track.
A negligible increase in moisture content was observed for all the test segments. Therefore when performance of aggregates is compared, a similar condition existed for all the segments. The second aim of using the geomembrane was to restrain fine particles. As discussed later, this was also effective.
5.5 Placement of Material.
Table 5.1 Comparison of Deflection and Rut Depth Loading (EDA) 0 26000 Deflection (mm)
1. 28 1 . 34
Rut depth (mm)
0
7
Rut depths developed for other segments at this loading were to the extent of 19 mm but no bulging was developed in any of those segments. When the friction course was removed, localised segregation was observed as shown in Plate 7 . The development of bulge was due to the segregation, and directly related to placement of material.
5.6 Compaction of Basecourse layer.
The material was placed to a depth of 100 to 125 mm thick. The compacted thickness for each segments is tabulated in the Table 3.4. The compaction was monitored by recording the density of each segment on each pass of the roller. The density versus number of passes relationship is tabulated in Table 5.2 .
Material
100% Rnd. 100% Rnd. 100% Rnd. 100% Ang. 100% Ang. 100% Ang. 50%R+50%A 70%R+30%A 30%R+70%A
Table 5.2 Relation of Density and Compaction
Grad. Expn. "'n' 0.6 0.5 0.4 0.4 0.5 0.6 0.5 0.5 0.5
Seg. Densit3
Kg/m
Roller Passes (Static)
A B
c
D E F G H I1 2 4 6
2010 2050 1990 1810 1850 1790 1990 1940 1500 2040 2060 1990 1910 1880 1770 2040 1990 2060 2100 2120 2030 1950 1900 1830 2050 2040 2070 2080 2040 2030 1990 1960 1930 2110 2110 2040 8 2060 2060 2070 1930 1990 1920 2080 2040 2090
passes. A continuous increment in density was observed for the segment E. It is indicated that for equal compactive effort segment E (n=0.5) densified more quickly than segments D and F.
The segments A, B and C (rounded material) reached their plateau density within four passes of the static
\
roller (i.e. the strength offered at this compactive effort by the segments material was at a maximum). However, the test segments were unstable. It was observed that there were no cohesion between the particles; rather, dilatancy was developed. There may be two main reasons for this instability:
i > The gradation specified and that delivered on site was different, and
ii> To obtain the specified gradation, the required gradations were obtained by blending materials from four different sources (Quarries).
The subgrade deformation was consistent for all test segments while basecourse deformation was different for different segments. The different response from the basecourse was due to varying material within the layer. Moreover, The maximum deformation observed was 36 mm at 54300 EDA's through this pavement structure should sustain the design loading of 2.5*10 5 EDA's. It is postulated that the results obtained during the test were exclusively due to the behaviour of the basecourse.
5.7 Gradation
Table 5.3 Target and Actual Gradations
Segment A : Material 100% Sieve Size
(mm) 37.5 19.0 9.5 4.75 2.36 1.18 0.600 0.300 0. 150 0.075
Rounded : Grad. Expn Percetage Passing
( % )
Target Actual
100 66 43 28 19 12 7 3 2 1 100 77 50 35 27 22 13 5 1 0 0.6
Differences exist between the target and actual gradations for all nine materials. For rounded materials, the actual gradation was not as per specification but it was within the range of NRB M/4 (1985) specification, except for segment C. The material of segment I
(combination of angular and rounded particles) was also outside of the specification limit.
Though there was a discrepancy in target and actual gradations for the segments A and B, actual gradation was within the range of specification. Therefore, the material should have compacted but dilatancy developed during compaction. This may be due to the lack of cohesive particles. Behaviour of segment I was also similar, probably for the same reason. Moreover, actual gradation of segment I was out of specification limit and air voids present in the material was lesser than required. As described in Section 2. 3. e, there was no voids in the material and during compaction, particles started rolling over each another. Cohesionless material accelerated dilatancy further in the segment I . Segments A,B,C and I were replaced by another 100 percent rounded material
(segment A-1). The new A-1 material was compacted and developed a stable condition for this segment.
100
90
lJO
70
60 50
'
L
3
1
.
: I
.
~I/
i/
:
I
UNIVERSITY OF CANTERBURY.
Deportment of
Civil
Engin~tering.Segment:G
SIEVE
ANALYSIS
_..4
!.-.~·r£
. /
!/.···
/"'
/.
.·
/
1/
...
.-?/ .
.
·'/
v .. ··
..
··'//
. .
; '/
...
··
..
· · /• I "IIi. fl •
_.//
.
,.
.
,/
.
/
..
··..
,
.
.
' /
.
.
.
v//
.
.
/
/ /
_," / / /
/
:
.•... M/4
Limits
;
•,
Target
,,
___ -Actual
I
75lJ.m 1501J.m 300IJ.m tJOOIJm t.t8mm J,J(Smm 4.75mm 9.5mm Wmm J7.5mm
-SIEVE
material was from only one source (Miners Road Quarry) while A,B and C materials were blended from four different quarries (including Miners Roads Quarry). It implies that fine materials have different cohesiveness of the different sources.
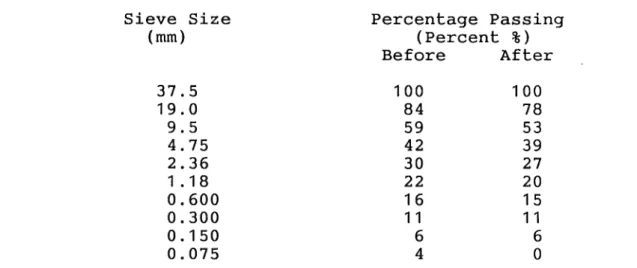
The particle size gradation before and after the test for all test segments are given in Appendix B. A typical gradation and its graphical representation is given in Table 5.4 and Fig. 5.1 below.
Table 5.4 Grading Envelopes
Sieve Size (mm) 37.5 19.0 9.5 4.75 2.36
1 . 18
0.600 0.300 0.150 0.075
Segment G
Percentage Passing (Percent %)
Before After
100 84 59 42 30 22 16 11 6 4 100 78 53 39 27 20 15 11 6 0
When comparing the gradation envelope before and after the experiment, the relative percentage of each particle size remained constunt for Segment A 1 while the percentage of particles smaller than 0.150 mm increased. This indicates that there was no movement nor degradation of 0.150 mm and above size material during the test in A-1 segment. The change in percentage for remaining segments may be due to degradation of the larger size particles.
For all test segments 0.075 mm size material was not present after the test. Their could be three explanations:
(i) Perforations developed in the geomembrane may have allowed the migration of 0.075 mm size material
This condition exist for all test segments, hence its relation to performance was uniform.
5.8 Deflections.
A measure of a pavement's response to loading may be obtained by the deflections. The performance can be related to the deflection but can not be taken alone as an indicator. However, deflections reflect the bearing capacity of the entire structure.
The first 2000 EDA's load repetitions were used to condition the surface of track. Thereafter, the deflections of the surface were measured at intervals of approximate 10,000 EDA's. This record was tabulated in the Table 4.2. The relationship between the deflections and loading graphs for all six segments are plotted in Appendix D.
The results show that exceptionally low deflections were recorded for the A-1 segments. Also the deflections were not consistent within segments. For example in segment D, the deflection at Station 19 was 1.62 mm while at 23 it was only 1 . 02 mm after 12900 EDA' s. The deflections were not consistent even with loading. In segment E at Station 25, deflection was reduced after 12800 EDA's but again increased at 321 00 EDA' s. It indicates that a definite relationship between deflection and load cycles can not be achieved.
5.9 Deformations.
this investigation, the evaluation of the performance is based on rut depth.
The first 2000 EDA's were treated as conditioning of the pavement structure. Thereafter, the rut depths were measured at 10,000 EDA's interval and the results are tabulated in Table 4.3.
A large increase in the permanent deformations was recorded in segment E while a small increase was recorded in the A-1 Segment. After 32100 EDA's loading, stations between segments D and E had developed rutting to only 19 mm. But the heave produced between them was greater than the clearance of the vehicles (Plate 8). A close inspection identified that an uneven surface was developed in segment D. The bouncing of vehicles caused further rutting in segment E. This stage was treated as failure of segments D and E. The bulging was removed, and an additional 20 mm thick friction course was laid on the surface in order to continue further loading.
In the next observation, at 43400 EDA's, a similar condition developed for segment G. With the addition of further loading, segments F and H also bugled. The ruts recorded at this stage were only 14 and 18 mm. At the end of loading it was observed that segment A-1 was intact, and a rut depth of only 12 mm was developed.
The first failure occurred in segment D. The gradation exponent was 0.4 of the segment D. This may have developed due to densification. The quick response to densification was due to the lower voids ratio and the degradation of larger size particle.
Referring to the actual gradation envelope of the material in segment D (Appendix B), the percentages of 19.0, 9.5 and 4.75 mm size particles was higher than targeted and even more than NRB Specifications M/4 (1985). The degradation can be justified by referring after-test gradation envelope (Appendix B) of the segment D.
proved to be efficient when the deformation of segment F was compared with other segments.
Referring to Table 4.3 , The combinations of angular and rounded material performance studied independently. Segment G having 50 % each of rounded and angular particles had developed twice the rut depth than Segment H (70% Angular + 30% Rounded. ) . The actual gradation for both material was the same. Therefore the difference in performance was due to differences in the relative percentage of angular and rounded particles. An increased percentage of rounded particles may have caused more deformation. This can be further justified by the example of segment I. Segment I with 70 % rounded material would not compact at all. Referring to earlier discussion, the rounded particles were cohesionless. Increasing the percentage of rounded particles in an aggregate have a negative effect on pavement performance.
Segment C (100 % Rounded) and I (70 % Rounded + 30 % Angular ) exhibited similar behaviour. The performance of 50 percent rounded aggregates (Segment H) was different. Hence the desirable combination of rounded and angular
CHAPTER VI
CONCLUSIONS AND RECOMMENDATIONS
6.1 Conclusions
( 1) Pavement behaviour was related exclusively to the basecourse layer.
( 2) Placing of 1 00 percent rounded aggregates incurred segregation greater than other samples.
(3) The performance of aggregates was more influenced by
the particles'shape than the gradation. Rounded
aggregates, of similar value of gradation exponent and same blending operation as angular aggregates, could not be compacted. But the non-blended rounded aggregates required less compactive effort than did the angular particles.
( 4) A significant difference was observed for the 1 00 percent rounded aggregates comparing its source.
(5) Aggregate performance is related to the presence of cohesive particles.
( 6) It is difficult to produce a continuous gradation for a particular value of gradation exponent.
(7) For the range of gradation exponent (n) values tested, no distinct difference in performance was observed.
( 8) The structural failure of the pavement can not be related with deflection observations. This may be due to the strong subgrade using a thin basecourse layer in the structure.
6.2 Recommendations
( 1) The test material should be examined for gradation exponent in the range of 0.4 to 0.45, 0.45 to 0.55 and 0.55 to 0.6 instead of.0.4,0.5 and 0.6. This will accommodate practical difficulty of obtaining gradation of the particular value of 'n'.
(2) The effect of blending on the aggregate performance should be studied as a independent research project.
( 3) The range of combination of percentage of angular and rounded particles should be from 30 to 70 percent.
(4) The specifications may include minimum percentage of cohesive material in the pavement layers.
( 5) While designing full scale testing facility, consideration, may be given to construction machinery which may be required during projects. For example, the minimum turning radius of pneumatic tyre roller compared with the radius of track.
( 6) For such investigations, where measurement of rut depth is most important a more precise profilometer
(Laser beam type) may be justified.
BIBLIOGRAPHY OF REFERENCES
1. ATKINS H.N. 1980 "Highway Materials, Soils, and Concrete" Prentice Hall Company, Virginia, U.S.A.
2. BARTLEY F.G. 1984 "Marginal Aggregate Pavement Trials Quarry Road, Drury". Road Research Unit Bulletin No. 67, National Roads Board, New Zealand.
3. BARTLEY F.G. 1980 "A Review of Aggregate Research in New Zealand" Road Research Unit Bulletin No.50, National Roads Board, New Zealand.
4. BRICKWELL R.G. 1985 "Geomechanics for New Zealand Roads" Road Research Unit Technical Recommendation TR 1
, National Roads Board, New Zealand.
5. BROWN S.F. and THOM N.H. 1987 "The Effect of Grading and Density on the Mechanical Properties of a Crushed Dolomitic Limestone". TRB Annual Meeting, Washington D.C., U.S.A.
6. DUNLOP NEW ZEALAND "Geomembrane" Product Information sheet, Dunlop Products, Christchurch, New Zealand.
7. FONG B.S. 1979 "The Field Trials to Determine the Influence of Particle Shape and Grading on Basecourse Performance" M.E.Thesis University of canterbury, Christchurch, New Zealand.
8. HAYNES J.H.and YODER E.J. 1964 " Effects of Repeated Loading on Gravel and Crushed Stone Basecourse Material
" Highway Research Board Bulletin No.39, U.S.A.
9. International Road Federation. 1986 Journal, Chapter: Pavement Design and Performance. PP 370-375.
10. KHANNA S.K. and JUSTO C.E.G. 1980 "Highway
Engineering" Nemchand Brothers Publishers,
Roorkey,U.P.,India.
11. KREBS.R.D. and WALKER R.D. 1971 "Highway Materials" McGraw -hill Book Company ,New York, U.S.A. 12. NATIONAL ROADS BOARD - Specifications, Wellington, New Zealand.
13. NATIONAL ROADS BOARD Wellington, New Zealand.
Roading Symposium 1975,
1 5. PIDWERBESKY B.D. , HOROSKO A. T. , WOOD W. I. and BERGAN A.T. 1987 "Indoor Pavement Test Tracks Incorporating Advanced Technology". New Zealand Reading Symposium, NRB, Wellington
16. PIDWERBESKY B.D. 1986 "An Investigation of the Performance of Geotextiles in Reinforcing Weak Subgrades on Unpaved Highways" M.Sc. Thesis University of Saskachewan, Saskatoon, Canada.
17. SEDDON P. A. 1988. Verbal discussion with Principal Academic Researcher, RRU Research Project No. BC/19.
18. TIMPANY R.J. 1974 " A Test of Aggregate Degradation " M.E.Thesis ,University of Canterbury, Christchurch, New Zealand.
19. TONKIN and TAYLOR 1972 "Factors Which Affect the Stability of Unbound Basecourse Pavements" Road Research Unit, Research Project BC-2 ,NRB, New Zealand.
20. YODER E. J. and WITCZAK M. W. 197 5 "Principles of Pavement Design" 2nd. Edition John Vi ley and Sons, Inc., New York, U.S.A.
Canterbury Accelerated Pavement Testing Indoor Facility
The Canterbury Accelerated Pavement Testing Indoor Facility (CAPTIF) is located in Christchurch, New Zealand. In this facility, testing and evaluation of road pavements and subgrades by replicating the effect on the pavement of actual traffic conditions. In addition, a variety of tyre,
and loading systems can be provides test conditions
axle, suspension,
tested. This
braking facility which approximate field situations and characteristics of road structures.
The pavements are constructed in an annular concrete tank; the tank serves to control moisture changes and provides an absolute reference. The track is 1 . 5 m deep and 4 m wide, and has a median diameter of 9. 26 m. The track is divisible into as many as twelve segments, so that a number of different conditions can be tested simultaneously. The facility is housed in a hexagon-shaped building 26 m wide and 6 m high.
The significant feature of this facility is its sophisticated pavement loading machine capable of applying a myriad of loading conditions via an array of vehicle types and assemblies. The machine carries a 55 kw electric motor, hydraulic pumps and reservoir, the rig-mounted electronics and various auxiliary systems. The auxiliary pump provides hydraulic power for the rams used to shift the machine's arms laterally, and for the emergency braking system.
machine's base elevation can be altered easily by up to 150 mm.
Hydraulic output from the main pump transfers directly to the hydraulic wheel-driving motors on the vehicles affixed to the outer ends of these arms. Consequently, travelling speed is regulated by the control of this pump output. The travelling speed of the machine is variable in increments of 1 km/h up to a design maximum of 50 km/h. A standard rear axle of a truck was split and one-half of the assembly was used for each vehicle. The differential was replaced with a driving motor so that the driving force is produced at the road surface in the same manner as would a conventional vehicle. Standard wheel hubs and heavy duty truck tyres are used. Normally, braking is imposed via the hydraulic drive system, whereby the rate of braking is controlled through the main pump.
Testing can be conducted with any pair of similar vehicle types or with a different vehicle on each arm. The vehicles are designed to reproduce the road wear of vehicles ranging from light commercials to heaviest tandem axle trucks. A vehicle consists of an assembly of half- axles, wheel-driving hydraulic pumps, normal wheels and suspensions, a frame, and instrumentation. The standard vehicles are equipped with single-axle, dual-tyred wheel assemblies which can be loaded to between 21 and 46 kN. Steel weights are easily added or removed, in increments of 2.75 kN.
A differing mix of road speeds can be attained because the machine may run at a constant speed or any chosen selection of speeds for varying durations. Controlled accelerating, braking and constant speed modes are available, and can be applied to either selected segments of the track or its whole length.
mounted under the centre platform, engaged with a hydraulic pump. The premise is that a pavement laid on a slope experiences large horizontal reactions relative to the vertical reactions to wheel loads driven over it.
Testing routines are programmed in terms of a number of parameters: start/stop times, time or distance or revolutions to be run, travelling speeds, d