SPECTRALLY EFFICIENT TECHNIQUES
A thesis presented for the degree of Doctor of Philosophy
in
Electrical Engineering in the
University of Canterbury Christchurch, New Zealand
by
B. G. Henderson B.E~(Hons)
PREFACE
The use of digital signals is well established as a means of representing information. A significant advantage of this format is that once information is digitised, the means by which it can be transmitted are independent of its original form. Thus, a digital transmission system can be used to transfer, for example, voice, visual, written or computer based information. The system does not require specific knowledge of the original or final form of the information it is carrying, but it must maintain an acceptable quality in terms of the errors which can be toler-ated in the received signal. This thesis is, in general, concerned with digital transmission systems and the means by which digital information can be transmitted in an efficient manner while maintaining the required qua 1 i ty of the recei ved signal.
In general there will be multiple users of a transmission medium and to enable their co-existence without excessive mutual interference, the allowable spectral occupancy and/or power for each information source must be limited. The material presented in this thesis is biased towards spectrally efficient techniques of digital transmission. However, an awareness is always retained of the requirement for efficiencies in the other system variables of signalling power, complexity and cost.
It became apparent that even though VSB is an established data transmission technique, its treatment in previous literature was sporadic and some derivatives of the fundamental VSB system had received no
attention. The research goal shifted direction slightly to a study rather than a development of VSB as one alternative for spectrally efficient transmission.
The research proved to be successful in several areas:
(a) A study of VSB signalling and the alternative generation and detection techniques which could be used gives a unified reference for initial VSB system design considerations, especially if digital processing circuitry is to be employed.
(b) A method was developed for both carrier and bit synchroniz-ation of a VSB receiver which offers a simple but efficient technique of maintaining both levels of synchronization without a need for enforcing code restrictions.
(c) Even though a VSB signal does not have a constant envelope it is shown to be a possible candidate for transmission over nonlinear channels, since even after it undergoes hardlimiting it retains good spectral efficiency and suffers only a small degradation in power effic-iency.
are:
Papers which have resulted from the research towards this thesis
Henderson, B.G., and J.A. Webb, IIA bandwidth-efficient data transmission system,1I Proc. Pacific Telecom. Conf., pp. 121-122, Jan. 1982.
Henderson, B.G., and J.A. Webb, "Synchronizing VSB data transmission," J. Electrical and Electronic Engineering, Australia. To be published.
ACKNOWLEDGEMENTS
I would like to express my gratitude to my supervisor Mr. J.A. Webb. The ideas and time he input to my research and his unabating enthusiasm and encouragement is gratefully acknowledged. I am also grateful to Dr. P. Gough for his comments and assistance as an associate supervisor, especially during the period Mr. J.A. Webb was overseas.
I wish to thank my fellow students for their assistance, in
I
particular Mr. A. Hamilton for his companionship and discussions on our respective research areas.
The financial support of the New Zealand Post Office is acknowledged with appreciation. Without this support, the time I dedicated to my research would not have been possible.
CONTENTS
Page
GLOSSARY xi
ABSTRACT xv
CHAPTER 1 INTRODUCTION 1
1.1 OUTLINE .OF THESIS 1
1.2 USE OF IIIDEA~' MODELS AND COMPUTER SIMULATION 5
1.3 COMMONLY USED CONVENTIONS AND TERMINOLOGY 6 CHAPTER 2 OVERVIEW OF DIGITAL TRANSMISSION TECHNIQUES 7
2.1 INTRODUCTION 7
2.2 GENERAL MODEL FOR A DIGITAL TRANSMISSION SYSTEM 7
2.2.1 Basis for Comparing Different Systems 9
2.2.2 Upper Bound in Performance 11
.
2.3 PRINCIPLES OF BASEBAND TRANSMISSION 13
2.3.1 Encoding 14
2.3.2 Spectral Efficiency and Eb 15
2.3.3 Optimum Receiver Filtering 16
2.3.4 Optimum Decoding 17
2.3.5 Symbol Shaping, Zero lSI and Eye-Patterns 20 2.4 BASEBAND ANTIPODAL SIGNALLING OVER A BINARY 25
SYMMETRIC CHANNEL
2.5 CODING FOR INCREASED EFFICIENCY 29
2.5.1 Coding for Increased Power Efficiency 30
2.5.2 Coding for Increased Spectral Efficiency 32
2.5.2.1 Basic multi-amplitude coding 32
2.5.2.2 Partial response signalling (PRS) 33 2.6 DIGITAL CARRIER-MODULATED SYSTEMS
2.6.1 General Model
2.6.2 Binary Phase-Shift Keying (BPSK) 38
2.6.3 Quaternary Phase-Shift Keying (QPSK) 39
2.6.4 Multi-Amplitude and Multi-Phase Signals 40
2.6.5 Single Sideband (SSB) and Vestigial 41
Sideband (VSB) signalling
CHAPTER 3 METHODS OF GENERATING AND DETECTING VSB SIGNALS 44
3.1 INTRODUCTION 44
3.2 CONVENTIONAL VSB SYSTEM 44
3.2.1 Complex Representation 45
3.2.2 BER Performance 48
3.2.3 Multiple Mixing Stages at the Transmitter 50
3.3 COMPLEX MODULATION AND DEMODULATION 51
3.3.1 Complex Modulation 51
3.g.~ Complex Demodulation 52
3.3.3 Relationships Between the Complex Terms of 52 the VSB Shaping Filters
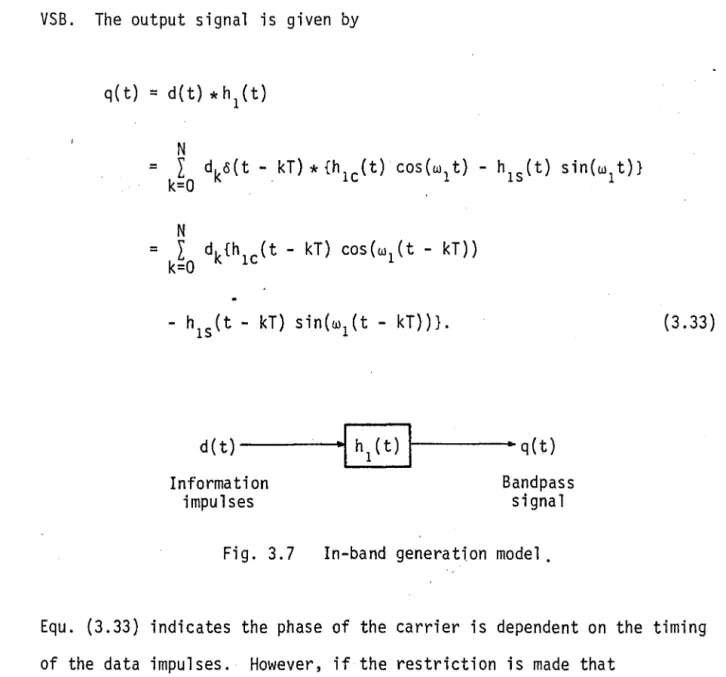
3.4 IN-BAND GENERATION
3.4.1 Restricted Carrier Frequency 3.4.2 Unrestricted Carrier Frequency
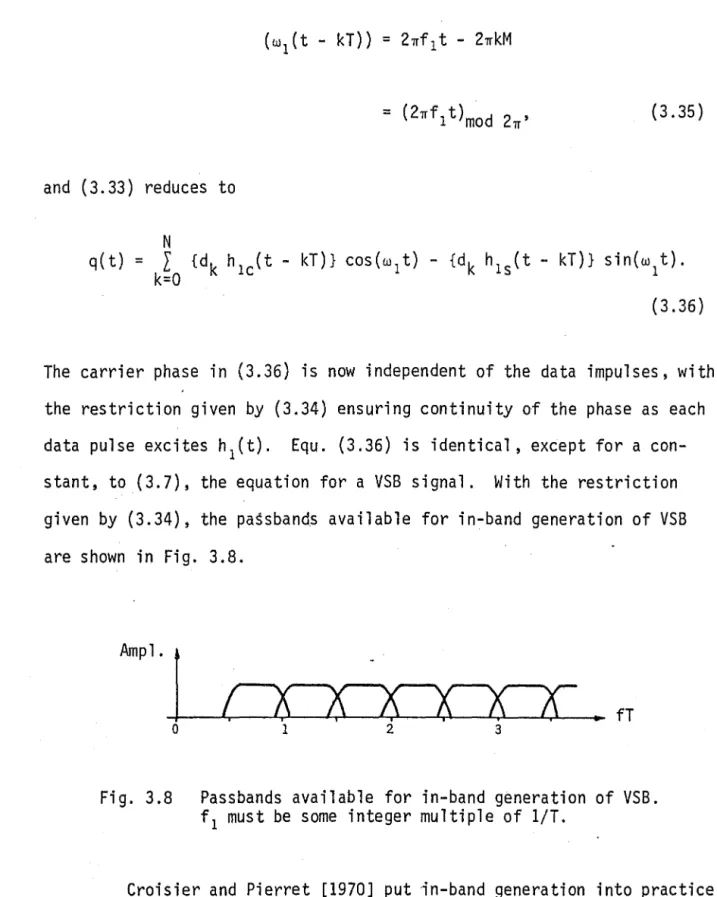
3.4.3 Defining the Passband Using Discrete Samples
55 56 59 61
3.4.4 Combined In-Band Generation and Complex 63
Modulation
3.5 GENERATION AND DETECTION OF VSB SIGNALS USING OQPSK 66 TECHNIQUES
3.5.1 Generation of VSB 3.5.2 Detection of VSB
3.6 A 9600 BITS/SEC DUPLEX DATA SYSTEM
66 67
CHAPTER 4 SYNCHRONIZING VSB DATA TRANSMISSION 4.1 INTRODUCTION
4.2 REVIEW OF VSB CARRIER SYNCHRONIZATION 4.3 BIT SYNCHRONIZATION: THE CONFLICT WITH VSB
CARRIER RECOVERY
4.4 PROPOSED VSB SYNCHRONIZATION SCHEME 4.4.1 General Model
4.4.2 BER Performance
4.4.3 Simulation Model and Resul ts 4.4.4 Discussion of Results
CHAPTER 5 TRANSMISSION OVER NONLINEAR CHANNELS 5.1 INTRODUCTION
5.2 REVIEW OF NONLINEAR TRANSMISSION 5.3 HARDLIMITING VSB (AND OQPSK) SIGNALS
5.3.1 Simulation Models
5.3.2 Simulation Results and Analysis
5.3.3 Experimental Results From Hardlimiting VSB 5.4 COMPARISON OF HARDLIMITED VSB WITH ALTERNATIVE
SYSTEMS Page 77 77 78 83 85 85 88 92 95 99 99 100 108 109 114 119 120
CHAPTER 6 QUADRATURE VESTIGIAL SIDEBAND (QVSB) DATA TRANSMISSION 125 6.1 INTRODUCTION
6.2 QVSB MODEL
6.3 ANALYSIS OF QVSB MODEL 6.4 PRECODING
6.5 PROBABILISTIC DECODING
6.5.1 Ignoring Noise Correlations 6.5.2 Considering Noise Correlations
6.5.3 Comparison of Processing Complexity 144 . 6.5.4 Spectral Efficiency and Narrowing the QVSB 145
Passband
6.6 QVSB AND QPSK AS IDENTITIES 149
6.7 GENERAL DISCUSSION AND COMPARISON OF RESULTS 151 CHAPTER 7 CONCLUDING REMARKS AND RECOMMENDATIONS 154
7.1 GENERAL CONCLUSION 154
7.2 RECOMMENDATIONS FOR FUTURE WORK 155
REFERENCES 158
APPENDIX 1 THEORETICAL LIMIT IN Eb/No FOR ERROR-FREE 166 TRANSMISSION
APPENDIX 2 AUTOCORRELATION FUNCTION FOR A DATA SEQUENCE OF 168 RECTANGULAR PULSES
APPENDIX 3 CALCULATION OF cr~ AND Eb FOR VSB 171
A3.1 CALCULATION OF cr 2 171
a
A3.2 CALCULATION OF Eb 172
GLOSSARY
Unless otherwise stated, symbols and terms used have the following
meanings:-(i n equations) exclusive-OR, modulo-2 addition (i n fi gures) summation
® (i n fi gures) multiplication
*
( on line) convolution*
(superscript) complex conjugate8(t) Dirac delta function
=
Kronecker delta function{
l' k = .e.
0, elsewhere
p filter rolloff factor
02 variance of random variable a(t)
a
D delay operator
E[o] Expectation value of terms inside [ ]
Eb energy per bit
Es energy per symbol
erfc( u)
=
complementary error functionf{ . )
f i (t)
F[. ] H[· ] Im[· ] j k! No P , Pb Pc
P de
Pe
p{ x I)
p{xllx)
P(A)
P(AIB)
R
Rc Re [. ] Rxx
h )
RXyh) Sx(f)t tk
T
function of terms inside ( ) instantaneous frequency
Fourier transform of terms inside [ ] Hilbert transform of terms inside [ ] imaginary part of terms inside [ ]
k factorial
one-sided spectral density. of·additive white Gaussian noise average power
probability of a bit error (bit-error-rate) probability of a symbol error
probability of a bit error when using differential encoding probability of error
probability density function of variable Xl
condition probability density function of variable Xl, given x has occurred
probability of the occurrence of event
A
conditional probability af occurrence event A, given event
B has occurred
information rate in bits/sec symbol rate in symbols/sec real part of terms inside [ ] autocorrelation function of x(t)
cross-correlation function of x(t) and y(t) spectral density of X(f)
time variable specific time
difference between two points in time bit period
x(t)
X(f)
-1 X I~IIxl
~ W W k AM APK ASK AWGN BER BPSKBse
dB d.c. demod DSB FfT FM FSK HPA Hz IJF-OQPSKfunction of time }
function of frequency Fourier transform pair
kth sample of variable x
matrix - referred to as a vector if a single-row matrix matrix transpose
matrix inverse
determinant of a matrix magnitude of x
estimate of x
radian frequency variable
=
2TIf specific radian frequency=
2TIfk amplitude modulationamplitude and phase-shift keying amplitude-shift keying
additive white Gaussian noise bi t-error-rate
binary phase-shift keying binary symmetric channel decibels
direct current demodulator double sideband
fast Fourier transform frequency modulation frequency-shift keying high power amplifier Hertz
intersymbol-interference and jitter-free offset quaternary phase-shift keying
mod
MSK OQPSK PCM PLL PM PRS PSK QORC QPSK QVSB SNR SQORC SSB
TWTA
VSB
modulator
minimum-shift keying
offset quaternary phase-shift keying pulse code modulation
phase lock loop phase modulation
partial response signalling phase-shift keying
quadrature overlapped raised-cosine quaternary phase-shift keying
quadrature vestigial sideband signal-to-noise ratio
staggered qu~drature overlapped raised-cosine single sideband
ABSTRACT
Spectrally efficient methods of digital transmission are studied, with particular emphasis on vestigial sideband (VSB) signalling. A gen-eral overview of digital transmission techniques gives a basis for more detailed studies into the areas of interest. Alternative methods of
gen-I
CHAPTER 1
INTRODUCTION
1.1 OUTLINE OF THESIS
The main emphasis in this research towards spectrally efficient transmission techniques has been towards the ve~tigial sideband (VSB) signalling format. However, VSB is by no means considered in isolation, since it is just one of many techniques available for obtaining a spect-rally efficient signal. Much of the analysis and results presented will have general application to the field of digital data transmission.
Prior to any analysis of VSB signalling, an overview of digital transmission techniques is given in Chapter 2. The general digital trans-mission model is introduced and, using this, Shannon's classical result for the capacity of a channel indicates how a compromise must be reached with the general system parameters of spectral efficiency, power effic-iency, complexity and cost. Carrier-modulated systems are an extension of baseband transmission, so the stages of the general baseband model are defined as a lead-up to applying them to out-of-baseband transmission. The baseband antipodal signalling model is generally accepted as a datum for digital transmission, so this system is defined and analysed; the results of which are referenced repeatedly in the following sections and chapters.
impractical when using analogue processing techniques. No previous studies appear to have addressed themselves to any unified study of these alternative techniques; this is the purpose of the material pre-sented in Chapter 3.
In this treatment of digital transmission systems only synchron-ous transmission has been considered since asynchronsynchron-ous techniques cannot offer good spectral efficiency coupled with power efficiency. Bit
synchronization is one level of receiver synchronization and is generally independent of the data transmission signalling format used. Another level of receiver synchronization is required in carrier-modulated systems and that is for the carrier itself. Chapter 4 is a study of VSB synchron-ization starting with a description of the problem followed by existing methods of synchronization and a new technique which retains power effic-iency and ensures both levels of receiver synchronization are maintained. VSB synchronization poses some unique problems. If no additional synch-ronization information is added to the VSB signal then sufficient infor-matio~ may not be present in the received signal to maintain either of the two levels of synchronization (bit or carrier). This occurs for certain transmitted code sequences. Though code restriction appears to be one possible solution to maintaining synchronization, it is shown that a conflict exists between carrier and bit synchronization; any code restrictions to ensure information is always present for maintaining one level of synchronization is to the detriment of the other level of
synchfonization. A review of existing methods of VSB carrier
synchroniz-ati~n where no code restriction exists shows they rely on the insertion of one or more pilot tones. The simplest of these techniques use large pilot tones, hence are power inefficient. The more power efficient of these
consid-ering it as an unrelated problem. It was clear during the research on VSB that the need existed for a synchronization technique which was both simple and power efficient. Both levels of synchronization should be considered jointly, since both are important to the overall performance. Code rest-rictions were to be avoided, since these limit the versatility of a system. These requirements set the base for the development of a new system which involved the addition of two low level pilot tones to the VSB signal. This was achieved by simply adding a stream of synchronization pulses to the data bits prior to transmission. Rather than rely solely on the pilots for synchronization, as is the general situation with existing systems, the pilots in the new system are used as a secondary source of information, whereby their presence become of importance only when the data signal it -self does not contain synchronization information. The performance of this new system is derived and, using computer simulation, estimates of carrier phase and bit timing variations are obtained.
inefficient in terms of spectral occupancy and additional filtering is required to increase this efficiency. A review of existing modulation formats for nonlinear transmission is presented and it is shown how a signal's instantaneous phase and envelope variations can be used to pre-dict and analyse the effect of filtering and nonlinear amplification. Since filtering is seen to introduce envelope variations, the question was posed; if filtering a constant envelope signal to increase its spect-ral efficiency introduces envelope variations, why not use a signalling format which is initially spectrally efficient and contains envelope
variations in its original form? This led to a study of VSB as a possible candidate for transmission over a nonlinear channel. An equivalence be-tweenVSB and filtered offset quaternary phase shift keying (OQPSK), derived in Chapter 3, enables the results for VSB to be applied also to OQPSK. Methods of obtaining spectral density, envelope, phase and eye-pattern plots using baseband models are derived. This simplifies the computer simulation of the nonlinear VSB system. The plots are then used to obtain performance figures for VSB in terms of spectral efficiency and degradation, which in turn are used in a comparison of VSB with existing systems used over nonlinear channels. VSB is seen to be a relatively robust'and spectrally efficient format for nonlinear transmission.
Since a VSB signal consists of quadrature related components it has generally not been considered as a suitable signalling format for combining with quadrature modulation to further increase its spectral efficiency. However, in Chapter 6 such a combination is proposed and analysed. The ne'w, signalling technique is given the name quadrature VSB
in deriving suitable encoding/decoding techniques to "unwind" the con-trolled lSI in the QVSB signal. As with PRS systems, the precoding technique offers the simplest method, but also the most inefficient in terms of bit-error-rate performance. A significant improvement in per-formance is seen to be gained by employing probabilistic decoding tech-niques. The Viterbi algorithm, which has been applied to convolutional coded and PRS systems, is applied to QVSB. The Viterbi algorithm is generally applied on the assumption that noise samples input to t~e decoder are statistically independent and this is used as a first step in deriving a probabilistic decoder. The optimum decoder is then derived where the Viterbi algorithm is again used but this time the noise
statistics are taken into account. QVSB is shown to offer a 2 to 3 dB signal-to-noise power advantage over conventional systems with comparable spectral efficiency. An additional and very interesting observation made during the study of QVSB was the use of the absolute value operation to replace squaring in probabilistic decoding algorithms. This approximation can be used to significantly simplify the computational effort required while apparently introducing only a relatively small performance degrad-ation.
1.2 USE OF "IDEAL" MODELS AND COMPUTER SIMULATION
absolute and relative performances of the various systems can be obtained from the Ifidealll models.
Computer simulation has been used in Chapters 4, 5 and 6 to study the performance of various systems. Its use enabled system variables to be readily altered and produced the required results without excessively
complicated mathematical analysis or time consuming hardware construction. With all of the computer simulation models, the signal passband shaping filters used had gradual, hence realisable, spectral rolloff characteris-tics. The models and results can therefore be related to practicable systems.
1.3 COMMONLY USED CONVENTIONS AND TERMINOLOGY
The information bits and coded symbols at the transmitter are always assumed to be in the form of impulses. This is for mathematical convenience, since the impulses will simply act as time shifting and amplitude scaling functions and symbol shaping can be completely defined using the transmitter and receiver filters. This is similar to the prac-ticable set-up where a transmitter filter1s time response is stored in a transversal filter or a look-up table in a microprocessor and is clocked out every symboi period with the required amplitude and polarity.
Changing between the frequency and time domains is freely used in analysing signal characteristics. Specific mention of this is not always given, but the following convention is always adhered to. Any function defined in the time domain using lower-case notation x(t), say, will have its Fourier transform defined in the frequency domain using upper-case notation X(f), where 00
x(t)
=
f
X(f) ej2TIftdf. (1.1 )-00
Also, a change is freely made between the variables w in radians!
sec, and f in Hz, where
CHAPTER 2
OVERVIEW OF DIGITAL TRANSMISSION TECHNIQUES
2.1 INTRODUCTION
Using a general model for a digital system,the parameters commonly used in comparing different transmission methods will be
defined. A theoretical bound for these parameters is given by Shannon's classical result for the capacity of a channel. While this bound
cannot, as yet, be attained in practice, Shannon does indicate the means by which it can be approached.
Most of the discussion in the following chapters is concerned with systems where modulation or frequency translation a·re used to obtain out-of-baseband data signals in the channel. Such systems are an extension of the general baseband model, so the various stages and some specific forms of this model are studied before extending it to
include the out-of-baseband systems.
2.2 GENERAL MODEL FOR A DIGITAL TRANSMISSION SYSTEM
N
d(t)
=
I
dk o(t - kT), k=Owhere dk
= ±1. T is the bit period, hence the information rate is
R
=
i
bits/sec.It is often convenient to consider the bit stream in vector form:
Noi se,
(2.1)
(2.2)
(2.3)
n( t) Bi nary
Bdian::; q ( t )
1
da ta ,d(t)-~'ITransmitterll--~~I Channel
t-I
--"'I_I
ReceiverI
r-- - - - a(t)Fig. 2.1 General model of a digital transmission system.
The transmitter's purpose is to change, if necessary, the information bits into a form suitable for transmission through the channel. En route to the receiver the transmitted information q(t) is inevitably perturbed by channel impairments. The receiver must then make an acceptable estimate a(t) (or in vector form
a)
of the infor-mation bits input to the transmitter. The number of errors in a(t) is the main criterion in,assessing a digital system's quality of perform-ance. It is measured in terms of Pb' the probability of a bit error, also referred to as the bit-error-rate (BER), where"
_ Number of Bit Errors in d(t)
As examples of Pb, voice traffic when transmitted in digital form can tolerate a BER as high as 10-3 [Newcombe and Pasupathy, 1982]. For digital radio the upper limit on Pb is about 10-4 [Anderson and Barber, 1979; Oetting, 1979]. Van Trees.e~al. [1977] indicate a range 10-8 - 10-12 is required for computer communications or electronic mail.
Numerous transmitter and receiver configurations are available, so from an engineering point of view it is important to have parameters available for comparing the alternatives and making a choice on a system most suited to a particular application.
2.2.1 Basis for Comparing Different Systems
In trying to achieve the desired BER the main factors requiring attention are:
(a) . i nforma ti on rate (b) channel impairments (c) signalling level (power) (d) signalling bandwidth (e) complexity
( f) cost
The usual situation is with (a) and (b) fixed, and (c) through (f) requiring minimisation. As will. be shown a compromise must be reached with these latter factors.
white Gaussian noise (AWGN) which has a two-sided spectral density of No!2 watts/Hz.
Often a channel will have non-uniform amplitude and phase char-acteristics which may distort the transmitted signal. These impairments usually cause distortion in a predictable manner and can, in theory, be removed by suitable signal conditioning at the transmitter and/or
receiver. If possible, the transmitted signal would be positioned within the channel passband where such distortion is minimal. Bennett and Davey [1965] have considered these impairments in comparing various systems.
Clark [1976] justifies the AWGN channel model in stating that the relative tolerance of systems to AWGN is a good indication of their relative tolerance to additive noise in general. Other important forms of additive noise are impulse noise [Bennett and Davey, 1965; Parson and Sheikh, 1979] and crosstalk from other transmission systems [Bellamy, 1982] .
The fading c~annel is another form of channel impairment which has received considerable attention [Feher, 1981 and references therein; Wozencraft and Jacobs, 1965]. With this, the interference is assumed to comprise of both multiplicative and additive terms.
Since the AWGN model is relatively easy to handle mathematic-ally, and so has received widespread use, it will be used as the channel
impairment when comparing different systems. An exception to this is in Chapter? when the nonlinear channel is considered. If a repeater is included in a channel link, and its power source is limited, it may have to operate its amplification stage in a nonlinear mode to make efficient use of the available power.
power at this point then
Eb
=
P/R Joules/bit (2.5)Clearly,the larger the ratio Eb/No the smaller Pb will be for a given system. Since Eb is limited by equipment capabilities and allowable crosstalk into other systems it is desirable to minimise this value while still maintaining the desired Pb,
Minimising the signalling bandwidth allows efficient use to be made of the available transmission medium. If a channel bandwidth of W Hz is required for the transmission of R bits/sec, the ratio R/W bits/ sec/Hz is used to define a system's spectral efficiency.
Unfortunately, as shown in section 2.2.2,a compromise is re-quired between the spectral efficiency and power efficiency of a system. Both of these resources can, however, be traded for a third, namely, complexity. It is really only since the mass production of large scale integrated circuitry this resource can be utilised without excessive cost. Increasing the "intelligence" of the transmitter and/or receiver allows some freedom in the choice of signalling power and bandwidth. Systems efficient in both of these latter two areas, which were once considered impractical due to high costs, may now be feasible to imple-ment.
2.2.2 Upper Bound in Performance
The classical result for the capacity of a channel in the
"Let P be the average transmi tter power and suppose the noise is white thermal noise of power N in the band W. By sufficiently complicated encoding sys-tems it is possible to transmit binary digits at a rate
with as small a frequency of errors as desired. It is not possible by any en-coding method to send at a higher rate with an arbitrarily low frequency of errors. "
(2.6)
The units of C are bits/sec. Using the substitutions P
=
CEb and N= NoW,
(2.6) can be rewritten in the formand from thi s,
CE
C/W
=
1092(1 + WNb) bits/sec/Hz, o(2.7)
(2.8)
Equation (2.8) gives the required Eb/No for obtaining the theor-etical maximum spectral efficiency of C/W. For any practicable system R/W will be less than C/W.
Using (2.8),the relationship between Eb/No and C/W has been plotted in Fig. 2.2. This illustrates the significance of Shannon's theorem. Any practicable system, where R rather than C is of interest, will have its operating point above and 'to the left of the curve in
spectral efficiency. The limiting value of Eb/No is found when infinite bandwidth is available, i.e., C/W
=
O. Substituting C/W=
0 into (2.8) gives Eb/No=
-1.6 dB (Appendix 1). If Eb/No is less than this value successful transmission is impossible. In the alternative direction, for a fixed complexity, increasing a system's spectral efficiency requires1/16 1/8 16 C/W (bits/sec/Hz, log scale)
Fig. 2.2 Eb/No versus C/W. Note change in Eb/No scale at origin.
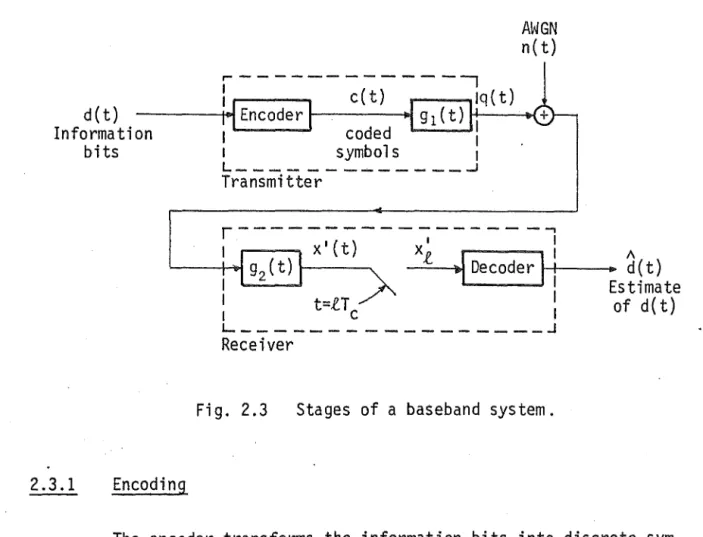
2.3 PRINCIPLES OF BASEBAND TRANSMISSION
A general model for a baseband data system is shown in Fig. 2.3. The encoder and decoder are not necessarily linear, but it will be
assumed the transmitter and receiver filters, respectively, gl(t) and g2(t) are linear with
d(t) Informa ti on
bits
AWGN
n(t)
r---~
I xl(t) Xl : "
1-.--+1
~
g2(t) .t~
DecoderI
~
J-I-__ •
d(t)Estimate
I t=.tT 1 of d( t)
I c I
L _ _ _ _ _ _ _ _ _ _ _ _ _ _ _ _ _ ~
Receiver
Fig. 2.3 Stages of a baseband system.
2.3.1 Encoding
The encoder transforms the information bits into discrete sym-bols to achieve increased transmission efficiency. The coded symsym-bols can be defined as
(2.10)
or in vector form
(2.11)
With the symbol period as Tc,the symbol rqte will be Rc = 1/Tc' The ratio R/Rc gives the number of information bits per transmitted symbol. In general, R/Rc > 1 for spectrally efficient systems and R/Rc < 1 for power efficient systems.
encoding operation may be performed by gl(t) and possibly g2(t). In this case Rc is defined at the output of gl(t).
2.3.2 Spectral tfficiency and Eb
In Fig. 2.3, gl(t) determines the shaping of the transmitted symbols. This filter governs the spectral characteristics, hence
spectral efficiency of the channel signal q(t) and, in conjunction with symbol sequence £, controls the signalling level in the channel.
Assuming c(t) consists of random data, its autocorrelation function is (see Appendix 2)
Using (2.12), the spectral density function for c(t) .is
which leads to the spectral density of q(t);
If Sq(f) has significant magnitude up to some frequency Wq Hz, the spectral efficiency of the system is R/Wq bits/sec/Hz.
(2.12)
(2.13)
The area under Sq(f) gives the average power of q(t). The aver-age energy per symbol is therefore given by
00
Es
=
Tcf
Sq(f) df Joules/symbol. (2.15)-00
substituting (2.14) into (2.15) gives
00
(2.16)
_00
Eb can now be found using (2.16) and the relationship
(2.17)
2.3.3 Optimum Receiver Filtering
The role of g2(t) in the system model is to maximise the SNR at its output. In addition to gl(t), g2(t) usually modifies the shape of the symbols prior to sampling and decoding. This latter point is con-sidered in section 2.3.5.
For a received signal of the form
(2.18)
where g (t) is square-integrable and n(t) is AWGN, the optimum form of
1 .
g2(t) is [Forney, 1972; Wozencraft and Jacobs, 1965]
(2.19a)
(2.19b)
The output of g2(t) sampled at a rate Rc forms a set of sufficient stat-istics for estimating £ and hence~. This is known as matched filtering.
An equivalent operation to the matched filter is the correl-ation receiver [Haykin, 1978]. With this latter method each symbol in the received signal r(t) is multiplied by a stored replica of the symbol shape. The product is integrated over the duration of the received symbol, after which time the integrator output is sampled and processed by the decoder as for matched filtering.
2.3.4 Optimum Decoding
The desired signal at the output of 92(t) is
x( t) = c( t)
*
g( t). (2.20)This is, however, perturbed by the filtered AWGN
a(t) = n(t) *9
2(t), (2.21)
giving the composite signal
xl(t)
=
x(t)
+ a(t). (2.22)The noise a(t) will be Gaussian with autocorrelation function
(2.23)
=
G(f), (2.24)therefore
(2.25)
or in normalised form
RI h)
=
R (-r)/R (0)aa aa aa
(2.26)
An optimum decoder will make use of the noise statistics given by (2.26) in arriving at its estimate.
The signal input to the decoder is in discrete samples
(2.27)
where the sequence of samples can be considered in vector form
Xl
=
X + a. (2.28)1\ 1\
coded symbols £ and samples ~ to relate x to an estimate d.
Wozencraft and Jacobs [1965] show that for a received vector ~I ,
• 1\
the optimum decoder is one which sets estlmate ~ equal to the hypothesis x which maximises the conditional probability function
P(~/~I) =
P (~) P (~I / x )
p{~1 ) (2.29)
This is termed maximum a posteriori probability decoding. Since Xl is fixed and independent of the ~ alternative chosen, maximising (2.29) is equivalent to maximising
P(x)p(xl/x).
-
- -
(2.30)If ~ is determined using the term p(~I/~), without regard for factor P(~) in (2.30), the operation is known as maximum-likelihood (ML) decoding. If each possible alternative of ~ is equally likely, then ML decoding
1\
will yield the minimum probability of error in estimate ~.
Using variable transformation, maximising p(~I/~) is equivalent to maximising p(~1 - ~/~). From (2.28L the term (~I - ~) is simply the Gaussian noise which is independent of ~, so
(2.31)
For the special case where the components of a are statistically
fndependent, i.e.,
RI (lT
c)
aa
= {
0, 1,l
=
0l =I 0,
then
_
1
[M
(-ai\l
p(~) - 2 (M+l)/2 exp
I
\-:2)J'(2TI 0 ) l=O \20
a a
(2.33)
where 02 is the variance or power of the noise a(t). Equ. (2.33) can be
a
simplified by using the log-likelihood representation of the ML decoding operation. Since the logarithm is a monotonic function of its (always positive) argument, maximising (2.33) is equivalent to minimising
(2.34)
Kl and K2 are positive constants representing the terms independent of ~, therefore can be ignored. Thus, the ML decoder is required to minimise, with respect to hypothesis ~, the function
M I 2
=
l
(x - x )l=O l l
This operation minimises the Euclidean distance between Xl and x.
2.3.5 Symbol Shaping, Zero lSI and Eye-Patterns
(2.35)
The role of the transmitter filter gl(t) in determining the spectral efficiency of the signal in the channel was considered in section 2.3.2. It has an additional role, in conjunction with g2(t), in governing the shaping of each symbol prior to sampling and decoding.
inter-symbol interference (lSI). Original work in this area has been credited to Nyquist [1928]. Of interest here ;s Nyquist's first criterion for zero lSI which he derived for the case where the overall symbol shaping function G(f) has a restricted passband. A more general criterion for zero lSI was given by Gibby and Smith [1965] and requires G(f) to obey the relationships
00
I
Re[G(S + nRc)]= K/Rc' K
= real constant
(2.36a) n=-ooand
00
I
Im[G(s + nRc) 1=
0,n=-oo (2.36b)
where Rc equals the symbol, hence sampling rate, and S with units of Hz has a range
Equ. (2.36) is equivalent to requiring
(2.37)
With matched filtering,G(f) will have no imaginary part. Also, if both G
1(f) and G2(f) are real, then
(2.38)
hence
With this situation, two extremes in gl(t) and g2(t) are possible. These are illustrated in Fig. 2.4. The rectangular pulse in Fig. 2.4(a) is usually set to extend for the duration of the symbol period, with T
= Tc'
It has an advantage of being easily generated, however, as shown by its Fourier transform, it has poor spectral efficiency with the slowly decay-ing rolloff. The rectangular passband in Fig. 2.4(b) offers maximum spectral efficiency, but has a disadvanta~e that its realisation Would
require an infinite time delay [Sunde, May 1954J.
gl (t) = g2(t) G1(f) = G2(f)
'-If
rect(l),T T
T ~ Tc t
fT
(a) -~ 0 ~ T
G1(f)=G2(f)
j
K s inc(-.!.. '\Tc Tcl
/
IKT
c rect( tTc),..--_ _ +-...1:...--,
t
~~~~~-+~~+-~~~~~-'Tc --4----+---+--__ fTc
-~ 0 ~
-5 -4 -3 -2 -1 0 1 2 3 4 5 (b)
Fig. 2.4 Two extremes in signal shaping which confirm with zero lSI criterion. Fourier transform pair shown for each. (a) Rectangul ar pul se. (b) Rectangul ar passband.
as follows [Haykin, 1978]:
1
2B
o
If I < f
u
fu < If I < 2B-fu (2.40)
The value B Hz in (2.40) gives the -6 dB points in the filter1s rolloff. U(f) can have different rates of rolloff defined by the rolloff factor
(2.41)
The·time response of the raised-cosine filter is
u(t)
= F[U(f)]
= sinc(2Bt)cos(2~pBt) (2.42)
1 - 16p2B 2t2
Fig. 2.5 shows examples of U(f) and u(t) for different p values. The
un-realisable rectangular passband results when p =-0. ror zero lSI
trans-mission using raised-cosine filtering, then
with
G(f) = K U(f),
_ 1
B -~.
c
(2.43)
(a)
(b)
2B U(f)
p=O
p=lj2
p=l
fB 3
-1 1
°
1 1 3-2
--
--
22 2 2 2
U(t)
1
Fig. 2.5 Raised-cosine' rolloff filters. (a) Frequency response. (b) Time response.
A visual indication of the extent of lSI is the eye-pattern. This is obtained by displaying, on sayan oscilloscope, each symbol period of x(t) overlapped on the same time base. An example of this is shown in Fig. 2.6 for the case of random data, two-level symbols and with G(f) a raised-cosine filter with p
=
0.5. Normally a display ofFi g. 2.6
Tc sec.
~I
o
Two level eye-pattern. Computer simulated using a raised-cosine passband with p
=
0.5The amplitude of the eye opening is an indication of a system's margin over noise and its width indicates the allowable timing error in sampling the signal. Van den Elzen [1975] gives a detailed analysis of the worst-case eye openings for several data transmission systems. Smith
[1982] studies the distortion of aye openings for the particular case of a raised-cosine shaping filter when timing and carrier phase errors in . carrier-modulated systems are present.
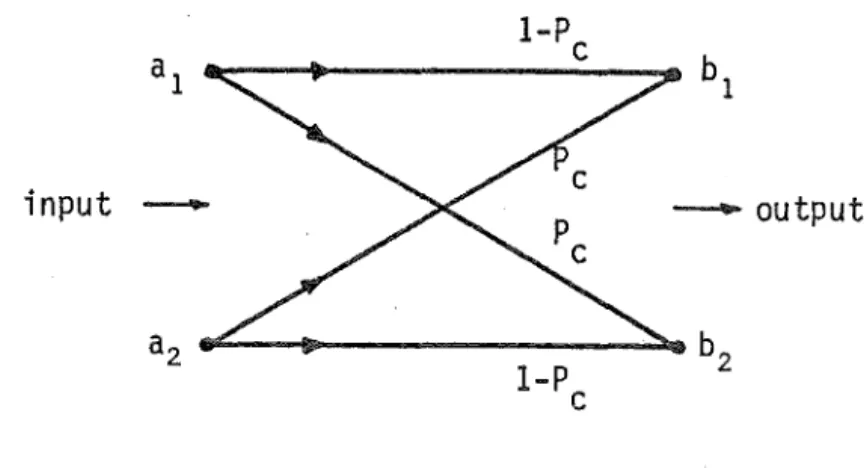
2.4 BASEBAND ANTIPODAL SIGNALLING OVER A£INARY SYMMETRIC CHANNEL
The performance of the baseband system which uses antipodal signalling over a binary symmetrical channel (BSC) is genera11y used as a datum against which other transmission systems are compared. A BSC can be described by the transition diagram shown in Fig. 2.7 [Wozencraft and Jacobs, 1965]. It has no memory and transmits and receives two symbols. Correct reception occurs if bl is received when a
l is transmitted, or if
b2 is received when a2 is transm~tted. This has a probability (1 - Pc)' where Pc is the probability of an error. An error occurs if b
I is
input - - output
Fig. 2.7 Transition diagram for a BSe.
Of interest here is the performance of the baseband system where. noencoding;sused; i.e.,
=
±1, (2.45)and
(2.46)
Zero lSI requires
(2.47)
where the time delay between symbol transmission (an information bit in this case) and reception has been ignored since this time is fixed.
end of section 2.3.4. With zero lSI the signal samples ~ are also stat-istically independent, so the optimum decoder can make its estima~es on a bit-by-bit basis. Thus, for each sample the decoder makes the
decision
A
{+1'
dk
=
-1,(2.48)
With
i
consisting of a random sequence, the probability of a bit error is=
p(xk
< Oldk=
1). (2.49)X
k
consists of the Gaussian noise term'ak' with zero mean and varianceo!, which is offset by the desired signal xk' The probability density
I
function of xk is therefore
Using (2.50), (2.49) becomes
where K is given in (2.47). Making the substitution
(X
k -
K)y =
-120
a(2.50)
(2.51)
(2.51) reduces to
co
K
2';;-a
=
1.
erfc( K ),2 Il a
a
(2.53)
where erfc(·) is known as the complementary error function [Haykin, 1978].
From (2.37),
K
=
g(O)co
-co co co
(2.54)
-00 -00
and since matched filtering is assumed, (2.54) reduces to
co co
-co -co
co
(2.55)
-co
Sinceg1(t) is real, Rayleigh's energy theorem [Haykin, 1978] enables
(Z.55)
to be rewritten asco
(2.56)
-co
-00 00
__ N
20I
2I
G1 (f)I
df-00
=
~O
K. (2.57)Calculation of Eb was considered in section 2.3.2. By using (2.56) the relationship between Eb and K becomes simply
(2.58)
Substituting (2.57) and (2.58) into (2.53) gives
-- 1
(fEb)
Pb =
'2
erfc J~.
(2.59)The BER curve given by (2.59) is shown in Fig. 2.8.
In arriving at (2.59) the only restrictions placed on gl(t) and g2(t) were that they are matched and conform with the zero lSI criterion. Any of the filter shapes discussed in section 2.3.5 will, under ideal conditions, give a BER performance as shown in Fig. 2.8. Maximum spectral efficiency of 2 bits/sec/Hz would be achieved with the rectangular pass-band shown in Fig. 2.4(b). However, in practice, when realisable filters must be used, the spectral efficiency will be less than 2 bits/sec/Hz.
2.5 CODING FOR INCREASED EFFICIENCY
Coding of the information bits using the encoding stage and in some cases the signal passband g(t) (see Fig. 2.3) can be used to
anti-~
~ ~
,
~ erfc(/Eb/No)
---~
V
r-\
~
1\
\
!1
~
2 4 6 8 10 12 14
Fig. 2.8 BER curve for baseband antipodal signalling over a BSe.
podal transmission system in section 2.4 as a datum, a power efficient system could be considered as one with a BER performance curve to the left of that shown in Fig. 2.8, and a spectrally efficient system as one which requires less bandwidth per information bit.
2.5.1 Coding for Increased Power Efficiency
If a channel is power limited the encoder is used to add intent-ional redundancy to the information bits to effect a lower Pb for a given
Eb/No' The redundancy is added in a time-wise manner resulting in a
Since there are more symbols transmitted than information bits input, not all of the possible symbol combinations need to be used to convey the bit information. The reduction in Pb for a given Eb/No is achieved by making the sequence of symbols used to convey a given sequence of information bits as different as possible from any symbol sequences used for other bit combinations. There are two basic methods of encoding this redundancy into the symbols; namely, block codes and convolutional codes.
As the name suggests,block encoding entails coding 0 information bits into C binary symbols, with C > O. C symbols comprise a block which is independent of other symbol blocks. There are 2C alternative blocks available, but only 20 are required for coding. Clearly, the greater the difference or distance between the blocks used, the less likelihood of the decoder making a decision error in which block, hence which bits, were transmitted. Berlekamp [1980] and Pless [1982] give detailed discussion on some of the block codes avaflable. A
With convolutional encoding, the coded symbols are obtained by effectively convolving the information bits with a shift register stage
[Heller, 1971; Ristenbatt, 1973; Viterbi, 1971]. One or more informat-ion bits are sequentially moved into a shift register, with the coded symbols taken from exclusive-OR operations on the shift register outputs. A simple example of this is shown in Fig. 2.9. With this example, 2 symbols are output each time 1 information bit is input. The decoder makes use of the fact that not all possible symbol combinations can occur
(i.e., there is redundancy), and it has knowledge of these allowable alternatives as determined by the exclusive-OR connections on the shift
2.5.2
001101010010 .... {
coded symbols
010001 ....
011100 ....
011010 •....
information bits
Fig. 2.9 Example of a convolutional coder. Logical levels "0" and "I" corres-pond to data bit levels -1 and +1, respectively.
Coding for Increased Spectral Efficiency
2.5.2.1 Basic multi-amplitude coding
With baseband systems the only method by which spectral effic-i.ency can be improved is to increase the number of amplitude levels in the symbol alphabet beyond 2.
The simplest form of amplitude coding is where successive blocks of M information bits are each encoded into 1 of 2M different symbols. An example of a 4-symbol alphabet is shown in Table 2.1. This simple coding method gives a 2-fold reduction in the channel signalling rate, hence a corresponding increase in spectral efficiency compared with 2-level signalling.
right of the curve in Fig. 2.8 by the value of the EblNo degradation. As an example, a 4-level system will suffer a 4 dB EblNo degradation com-pared with antipodal signalling [Oetting, 1979].
TABLE 2.1
EXAMPLE OF AMPLITUDE CODING USING A 4-SYMBOL ALPHABET
Information Bits Encoding Symbols
(-1, -1) -3A
(-1, 1) -A
( 1, 1) +A
( 1, -1) +3A
2.5.2.2 Partial response signalling (PRS)
PRS is often referred to under the alternative name of correl-ative level coding. The latter name more suitably describes the form of a PRS system which uses multi-amplitude coding where the coded symbols are correlated. This method relaxes the restraint of zero lSI by allow-ing lSI in a controlled manner and since this form of interference is known its effect can be removed by the decoder.
Lender [1963, 1964, 1966] introduced PRS as a data transmission method. Kretzmer [1966] categorised the characteristics of several PRS schemes and compared them with the ideal antipodal signalling system. Kabal and Pasupathy [1975] presented a unified study of PRS system, extending the analysis by Kretzmer. Initial studies into the BER perfor-mance of PRS systems were based on the precoding technique devised by Lender [1963] which enables bit-by-bit decoding without regard for the correlation among symbol levels. This form of decoding suffers an EblNo
Kobayashi [Jan., Sept., Dec., 1971] recognised this and applied ML decod-ing to make full use of the information contained in the correlations, thus recovering a large portion of the Eb/No degradation the PRS system would otherwise suffer. Both precoding and ML decoding are discussed in more detail in Chapter 6 when they are applied to the QVSB system. An alternative to these two decoding methods is ambiguity zone detection which was introduced by Kobahashi and Tang [Aug., 1971]. This method makes use of the symbol correlations to reconstruct unreliable samples. If a sample contaminated with noise is in an "a.mbiguity zone" halfway between noiseless levels, it is rejected and the neighbouring samples are used to reconstruct the signal.
The encoding operation for PRS can be described by the system polynomial [Kabal and Pasupathy, 1975]
L-1
W(O)
=
I
wOn,
n=O n (2.60)
where 0 is the delay operator. More specifically, the encoding operation will have the form
W(D) = 1 + D, (2.62)
which describes the duobinary, or class-I, PRS system. A transversal filter with transfer function given by (2.62) has spectral characteris-tics shown by the solid line in Fig. 2.10(a). Since, for this PRS system, the symbol rate equals the information bit rate, a rectangular passband shown by dashed lines in Fig. 2.10(a) would avoid any further lSI. Combining both the transversal and rectangular filters into the one filter shown in Fig. 2.10(b) gives a system passband G(f) that is more easily realised than the rectangular filter and incorporates the duobinary encoding. For optimum noise immunity, G(f) will be divided equally between transmitter and receiver. The time response g(t) for the duobinary system is shown in Fig. 2.1O(c). The dashed lines in this figure illustrate-the controlled lSI that would occur at the sampling points if bit sequence ( ... ,-1,1,1,-1,1, ... ) was transmitted.
2.6 DIGITAL CARRIER-MODULATED SYSTEMS
In many instances the frequency spectrum available in the trans-mission channel does not match that of the baseband data. The baseband data system analysed in the previous sections can be modified to include modulation/demodulation stages. In carrier-modulated systems the amplit-ude, frequency and phase of a sinusoidal carrier are the parameters
available for modification by the baseband data. Numerous modulation techniques using each of these parameters and their various combinations have been devised [Bennett and Davey, 1965; Clark, 1976; Haykin, 1978; Lucky et al., 1968].
(c)
o
Nyquist passband for symbol shaping
~Transversal filter F[o(t-T/2) + o(t+T/2)]
g(t)
=
F[G(f)] ,-,, ..
,
,
,
,
"
\,
,
....
't
t
sampl ing times for decodingFig. 2.10 Duobinary system signal shaping. (a) Separate transversal and symbol shaping filters which com-bine to give (b), and the result-ing time response (c).
systems is used to introduce several techniques which, in addition to those used with baseband systems, increase spectral efficiency.
2.6.1 Genera 1 Mode 1
Carrier-modulated data systems can be described by the general model shown in Fig. 2.11. Considered here are linear systems employing coherent demodulation. By combining the quadrature related modulation paths all such modulation schemes can be treated using this model
S-O) "'0
d ( t) -+----'"'1 0
~ b(t) qs(t)
I
g,s(t)I
·0
I
1
I: 12 sin(w1t + 61(t)) I
L _ _ _ _ _ _ _ _ _ _ _ _ _ _ _ _ _ _ _ _ _ _ _ .J
Transmitter
Channel
r--- --- --- --- --,
, I
,l2cos(w2t + 6
2(t)) I
I
~
, II
I
y' ( t )Y.e.:
I x . gzc (t) ~ s- I
I . . . t=.tT ----" 0) I
I
c " 8
t--t-I_-a(
t),
~ z.tz' (t)
t-
I
g2S(t)I -
t-.tr +Td~
I C
: .fl sin(w2t + 62(t))
I I
L ____________________________ ---~
Recei ver
Fig. 2.11 General model 'for carrier-modulated data transmission systems.
In Fig. 2.11 glC(t), glS(t), g2C(t) and g2S(t) are all baseband filters which govern the symbol shaping. y'(t) and z'(t) are given by
yl(t)
=
y(t) + ny(t) (2.63)and
Zl(t)
=
z(t) + nz(t), (2.64)interference due to the AWGN in the channel. The coded symbols are
and
a(t)
=
l
aoo(t - iT )i ,(.. c (2.65)
(2.66)
where Td represents any time offset between the quadrature paths. With most carrier-modulated systems the local oscillators at the transmitter and receiver are set to the same frequency, with wI
=
w2• With coherent demodulation there is, ideally, no phase error so 81(t)
=
82(t). On this Iassumption there is no loss of generality in letting 8
1(t)
=
82(t)=
O.2.6.2 Binary Phase-Shift Keying (BPSK)
BPSK is the carrier system eq~ivalent of the baseband antipodal signalling system given in section 2.4. It requires only a single
modulation/demodulation path, with b(t)
= z(t)
=
0 and a(t)=
d(t). The channel signal is given byis
(2.67)
After coherent demodulation by
1:2
cos(wlt), the received signalY I ( t)
=
d ( t)*
g I C ( t)*
g 2 C ( t) + {n ( t) 12" cos ( wIt) }*
g 2 C ( t) .Multiplying n(t) by 1:2 cos(w1t) does not change the resulting AWGN spectral density from No/2, thus (2.68) describes identical filtering operations to those used with baseband systems. The same requirements for matched filtering, zero lSI and decoding therefore hold and the same BER performance is achieved (see Fig. 2.8).
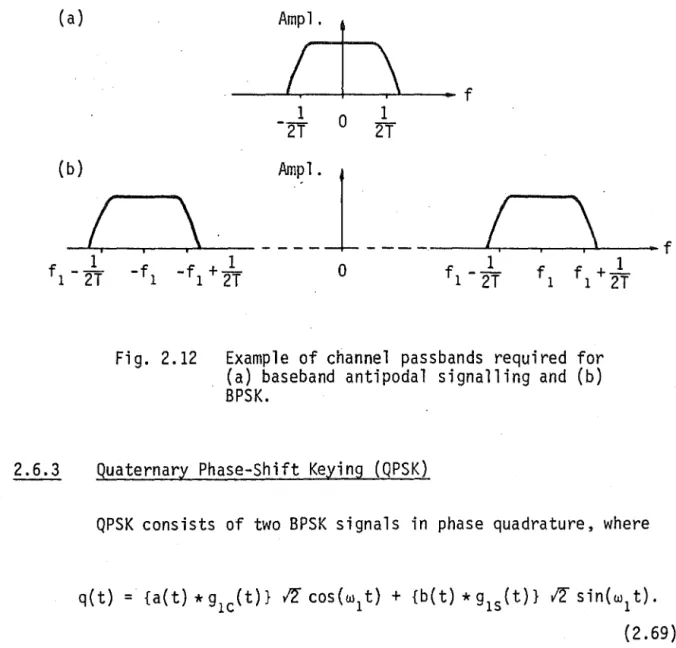
BPSK, however, is a double sideband (DSB) signalling technique, so as shown by the example in Fig. 2.12 its spectral efficiency is halved compared with its equivalent baseband system.
(a)
(b)
L
1f 1 - 2T
Ampl.
I
L
j
.. f1 0 1
-2'F
2'F
~
----
~P1.1
----
L
j
-f 1 -f 1 2T +-1 0 f 1 - 2T 1 fl f 1 + 2T 1
Fig. 2.12 Example of channel passbands required for (a) baseband antipodal signalling and (b) BPSK.
2.6.3 Quaternary Phase-Shift Keying (QPSK)
QPSK consists of two BPSK signals in phase quadrature, where • f
q(t) = {a(t) *glC(t)} 12" cos(w1t) + {b(t) *glS(t)} 12 sin(w1t). (2.69)
(2.70)
and
(2.71)
In general, glC(t) and glS(t) are identical filters, which are in turn matched to, respectively, g2C(t) and g2S(t).
The quadrature related channels are independent of each other as long as there is no phase error in the demodulating carriers. Each quad-rature related channel of the QPSK signal will therefore have identical BER performance to BPSK and hence to baseband antipodal signalling. For a given information rate, encoding d(t) 'for QPSK transmission involves dividing the information bits equally between a(t) and b(t). With the symbol rate in each path at half that for BPSK, a doubling of spectral efficiency is possible.
A particular form of QPSK is offset QPSK (OQPSK), where symbol sequences a(t) and b(t) are offset by Td
=
T seconds. The offset avoids nulls in the envelope of q(t) when narrow band filtering is used. As shown in Chapter 5, this is an advantage when nonlinear channel distort-ion is present.2.6.4 Multi-Amplitude and Multi-Phase Signals
An increase in spectral efficiency can also be achieved by keeping the envelope of the modulated carrier fixed and encoding the data using the carrier phase. This is the form of M-ary PSK. In Fig. 2.11, q(t) can be written as
q(t)
= A(t)
~ cos(w1t + e(t)), (2.72a)where
A(t)
-
{q2(t) c + q2(t)}~ s (2.72b)and
e(t)
=
-tan Lqc(tJJ' -lrqs(t)l (2.72c)With M-ary PSK, A(t) is kept fixed and the symbol alphabet is derived from different values of e(t). QPSK with rectangular symbol shaping is a particular form of M-ary PSK, where four phases 0, ±TI/2 and TI radians make up the symbol alphabet.
The combined use of amplitude and phase-shift keying (APK) has i
been used to produce numerous signal encoding formats. Thomas et al. [1974] analyses the performance of several APK signalling schemes with large symbol alphabets. An excellent comparison and bibliography on various signalling schemes has been presented by Oetting [1979].
2.6.5 Single Sideband (SSB) and Vestigial Sideband (VSB) Signalling
(a) DSB
Amp 1.
1
(
i
\
--- - - - - -!
i\
. f-f 1 0 fl
(b) SSB
-~:~J_----LJ
D
f-f 1 0 fl
(c) VSB
AmPl'l
0
------ - - ---Q
.
f-f 1
a
flFig. 2.13 Reducing (a) DSB spectrum to (b) SSB 'and (c) VSB.
SSB and VSB signal shaping are generally applied only to DSB data signals which have the form
(2.73)
BPSK and multi-amplitude signalling, where no quadrature component is present, are included in this general form. They typically have a DSB spectrum as shown in Fig. 2.13(a) and unless special coding and/or filtering is used the DSB signal will have a significant amount of
signal power at and around its carrier frequency fl Hz. Complete removal of one sideband while retaining the other for SSB signalling, as shown in Fig. 2.13(b), would therefore require unrealisable vertical rolloff
SSB and VSB signals can be defined as follows:
q ( t)
= {a ( t)
*
g 1 C ( t)} 12 cos ( wIt) ± {b ( t)*
g 1 S ( t)} 12 sin (w 1 t) ,(2.74a)
with
a(t)
=
b(t), (2.74b)where for SSB
(2.75)
and for VSB
(2.76)
In (2.74a) the plus sign applies to transmitting the lower sideband, whereas the minus sign applies to transmitting the upper sideband. m(t)
in (2.76) is used to modify the Hilbert transform function, hence the filtering characteristics from SSB to VSB. The VSB signal is analysed in detail in the following chapter.
Equ. (2.74a) indicates that SSB/VSB shaping introduces a quad-rature component'to the signal. This is usually regarded as an unwanted component which can only be removed with coherent demodulation by
CHAPTER 3
METHODS OF GENERATING AND DETECTING VSB SIGNALS
3.1 INTRODUCTION
The basic concepts of VSB data transmission are generally well understood. Several alternatives for transmitter and receiver configur-ations have appeared in literature, but in separate presentconfigur-ations. This chapter is intended as a concise reference to these alternatives, incl-uding some methods which have not specifically appeared in previous literature. Multi-level signalling is not considered here, since it is a simple extension of the antipodal case with performance degradations as for baseband signalling.
This study of various VSB techniques stems from attempts to design and construct a 9600 bits/sec duplex modem for operation over the subscriber telephone loop. Discussion of the modem design and difficul-ties encountered are given at the end of this chapter.
3.2 CONVENTIONAL VSB SYSTEM
The model for the conventional VSB data system is given in Fig. 3.1. Signal shaping can be shared by the lowpass filters l(t) and band-pass filters h1(t) and h2(t), but in this analysis it will be assumed the bandpass filters perform the signal shaping and the presence of the low-pass filters is simply to remove unwanted high frequency terms.
With reference to Fig. 3.1, let
wh€re v(t) is the desired signal at the output of h
2(t) and S(t) is the
noise. Likewise, let
x'(t)
= x(t)
+ a(t) (3.2)where x(t) is the desired baseband signal at the receiver and a(t) is the noise.
r--- - - - - ---,
AWGN n(t)
I
Iq(t) q'(t)d(t)--+~ _ _ _ --' I
I
, .f'l cos (to 1 t) :
L ___ , __________ .J
Transmitter
r---- -- - - --,
I x~ I
'----f'--.j
--i
Decoder~
a(
t),
I
12 cos (wI t) I
I ,
~---~ Receiver
Fig. 3.1 Conventional VSB system.
3.2.1 Complex Representation
Since a VSB signal consists of both in-phase and quadrature com-ponents, it is convenient to make use of complex notation in its mathemat-i ca 1 treatment.
The bandpass filters at the transmitter and receiver can be
T
(3.3)
and
(3.4)
where the terms h1C(t), h1S(t), hzc(t) and hzs(t) are baseband functions which make up the complex envelopes of the filter responses. Letting
(3.5)
then
(3.6a)
(3.6b)
The signal at the output of the transmitter filter is
Il [ jw
tl
=
-t
Re { d ( t)*
(h 1 c ( t ) + j hIS ( t)) }e 1 j (3.7)(3.8)
After demodulating v(t) by 12 cos(w1t) the recovered baseband signal will be
x (t)
= {v ( t)
12 cos (w 1 t) }*
l ( t)(3.9)
Equ. (3.9) indicates that to a~hieve zero lSI, hc(t) must obey the same criterion as given in section 2.3.5 for baseband transmission.
Since the VSB system in Fig. 3.1 is linear, maximising the SNR of xl(t) implies the SNR at the output of h2(t) must also be maximised. Match filtering therefore requires
(3.10)
corresponding to the frequency domain relationship
(3.11)
Now, from (3.5) and (3.11)
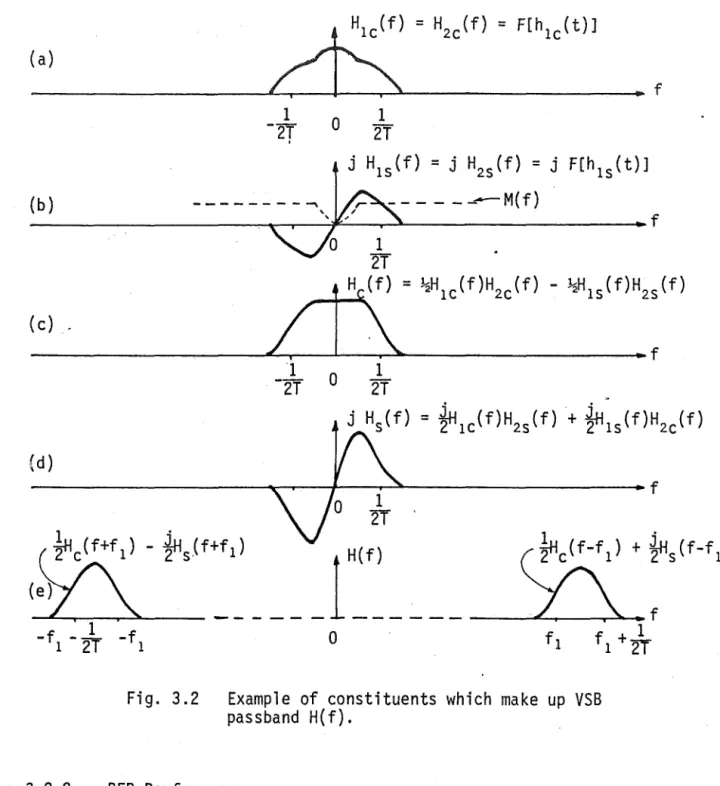
so a requirement for maximising SNR at the receiver is that H(f) contains no imaginary part.
An example of how H(f) is made up of its various constituents is given in Fig. 3.2. In this case H(f) is a raised-cosine passband, so H1(f) and H2(f) will be identical cosine rolloff filters.
£:
=
H2C(f)=
__________________
~~~
__
_+--~~---~~
f (a)1 1
- 2T 0 2T
I
j H1S(f)
=
j H2S (f)=
j F[h1S(t)](b) F ---....-M(f)
---~~r-~~~~---f
(c),
(d)
---~~-+--~~---f
Fig. 3.2 Example of constituents which make up VSB
passband H(f). .
3.2.2 BER Performance