ORIGINAL RESEARCH
Reversible Changes in Brain Glucose Metabolism
Following Thyroid Function Normalization in
Hyperthyroidism
Q. Miao S. Zhang Y.H. Guan H.Y. Ye Z.Y. Zhang Q.Y. Zhang R.D. Xue M.F. Zeng C.T. Zuo Y.M. Li
BACKGROUND AND PURPOSE:Patients with hyperthyroidism frequently present with regional cerebral metabolic changes, but the consequences of endocrine-induced brain changes after thyroid function normalization are unclear. We hypothesized that the changes of regional cerebral glucose metabolism are related to thyroid hormone levels in patients with hyperthyroid, and some of these changes can be reversed with antithyroid therapy.
MATERIALS AND METHODS: Relative regional cerebral glucose metabolism was compared between 10 new-onset untreated patients with hyperthyroidism and 20 healthy control participants by using brain FDG-PET scans. Levels of emotional distress were evaluated by using the SAS and SDS. Patients were treated with methimazole. A follow-up PET scan was performed to assess metabolic changes of the brain when thyroid functions normalized.
RESULTS: Compared with controls, patients exhibited lower activity in the limbic system, frontal lobes, and temporal lobes before antithyroid treatment. There were positive correlations between scores of depression and regional metabolism in the cingulate and paracentral lobule. The severity of depression and anxiety covaried negatively with pretreatment activity in the inferior temporal and inferior parietal gyri respectively. Compared with the hyperthyroid status, patients with normalized thyroid functions showed an increased metabolism in the left parahippocampal, fusiform, and right superior frontal gyri. The decrease in both FT3 and FT4 was associated with increased activity in the left parahippocampal and right superior frontal gyri.
CONCLUSIONS:The changes of regional cerebral glucose metabolism are related to thyroid hormone levels in patients with hyperthyroidism, and some cerebral hypometabolism can be improved after antithyroid therapy.
ABBREVIATIONS:BA⫽Brodmann area;value⫽standardized coefficients; FDG⫽ fluorodeoxy-glucose;18F-FDG ⫽ fluorine 18 fluorodeoxyglucose; FDR ⫽ false discovery rate; FT3 ⫽ free triiodothyronine; FT4⫽ free thyroxine; GLUT-1 ⫽glucose transporter protein type 1; MNI ⫽ Montreal Neurological Institute; MRS⫽MR spectroscopy; PET⫽positron-emission tomography; SAS⫽Self-Rating Anxiety Scale; SDS⫽Self-Rating Depression Scale; SPECT⫽single-photon emission tomography; SPM⫽statistical parametric mapping; SPSS⫽Statistical Package for the Social Sciences; T1⫽ before antithyroid therapy; T2⫽after antithyroid therapy; TRAb⫽ anti-thyroid stimulating hormone receptor antibody; TSH⫽thyrotropin; VOI⫽volume of interest
T
hyroid dysfunctions may be accompanied by numerous neurologic and psychiatric changes. The most well known is cognitive impairment and depression in patients withhypo-thyroidism as well as an increased risk of cerebrovascular ac-cidents. Also, thyrotoxicosis induces a wide range of cognitive and affective-emotional impairments1 and is considered 1 common cause of emotional distress.2Nervousness,
irritabil-ity, impulsiveness, poor concentration, easy fatigabilirritabil-ity, and depressed moods are frequent symptoms in thyrotoxicosis, sometimes suggesting primary neuropsychiatric disease.3The
links between these clinical phenomena and brain metabolic function are poorly understood.
With advances in brain imaging techniques, a combination of endocrine and psychological testing as well as PET may provide further insight into the underlying mechanisms of the functional neuroendocrine relationships. Functional imaging may contribute to elucidating the potentially different back-grounds of psychiatric complications for patients with hyper-thyroidism. To date, there are very few studies on cerebral glu-cose metabolism dealing with hyperthyroidism-associated changes, which mostly report regional changes of cerebral glu-cose metabolism before therapy.4
Here, we present findings from neuropsychiatric evalua-tions and cerebral glucose metabolism measurements in indi-viduals with hyperthyroidism before and after antithyroid Received September 2, 2010; accepted after revision October 18.
From the Division of Endocrinology and Metabolism, Department of Internal Medicine (Q.M., S.Z., H.Y.Y., Z.Y.Z., Q.Y.Z., R.D.X., M.F.Z., Y.M.L.), and the PET Center, Department of Radiology (Y.H.G., C.T.Z.), Huashan Hospital, Shanghai Medical College, Fudan Univer-sity, Shanghai, China.
Qing Miao and Shuo Zhang contributed equally to this work.
This work was supported by grants from the National Natural Science Foundation of China (30771024, 30900502, 30800344, and 81070680); the Shanghai Committee of Science and Technology, China (10JC1401002); the Young Science Fund of Fudan University (09FQ71); the Institutes of Biomedical Sciences, Fudan University (2009056); and the Graduate Innovation Fund of Fudan University (EYF151063).
Please address correspondence to Chuan Tao Zuo, MD, PhD, PET Center, Division of Nuclear Medicine, Huashan Hospital, Department of Radiology, Shanghai Medical College, Fudan University, 518 Wuzhong East Rd, Shanghai 200235, China; e-mail: zuoct_cn@ hotmail.com; or Yi Ming Li, MD, PhD, Division of Endocrinology and Metabolism, Huashan Hospital, Department of Internal Medicine, Shanghai Medical College, Fudan University, 12 Wulumuqi Middle Rd, Shanghai 200040, China; e-mail: [email protected]
Indicates open access to non-subscribers at www.ajnr.org
therapy. Of particular interest was the possible correlation of subjective disability with abnormal function in specific brain regions, and the relationship of these changes to thyroid func-tion recovery. We hypothesized that the changes of regional cerebral glucose metabolism are related to thyroid hormone levels in patients with hyperthyroidism, and some of these changes can be reversed with antithyroid therapy.
Materials and Methods
Study Design
Screening procedures included complete medical examinations, rou-tine laboratory evaluations, MR imaging (Magnetom Verio 3T; Sie-mens, Erlangen, Germany) to exclude participants with potential sig-nificant brain diseases, and a neuropsychiatric evaluation. Patients with hyperthyroidism and healthy control subjects were assessed by measurements of behavioral and somatic symptoms and PET scan-ning twice. For the hyperthyroid group, assessments were performed before and after antithyroid therapy. The initial dose of methimazole was 10 mg, 3 times a day. During treatment, the thyroid hormone levels (FT3 and FT4) were measured every 20 days. The second PET scans were performed when the symptoms had disappeared and the thyroid hormone levels were normal. Then the dose of methimazole was reduced to 10 mg a day. Control subjects underwent the second scan on the same day as the corresponding patients with hyperthy-roidism, but they did not receive methimazole treatment. The index of brain glucose metabolism was normalized by using raw counts from the radiotracer FDG as a surrogate marker. Relative activity, as used in this report, refers to this measure. The protocols were ap-proved by the ethics committees of Huashan Hospital, Fudan Univer-sity in Shanghai, and all studies were performed after informed con-sent was obtained.
Patients
Ten consecutive patients with Graves disease⫺caused hyperthyroid-ism (mean age, 38.7⫾9.3 years; 5 women; mean TSH-receptor anti-bodies, 24.68⫾15.09 U/L; normal range,⬍1 U/L) were studied at the Endocrine Department of Huashan Hospital, Fudan University. All patients were newly diagnosed. Before entering the study, all subjects were screened and clinically examined by 2 senior investigators. The exclusion criteria were the following: endocrine or autoimmune dis-eases except for hyperthyroidism, hyperthyroidism crisis, pregnancy, no contraception, intake of any psychotropic medication or -block-ing agents in the 2 months before enrollment, history of bipolar or schizoaffective disorder, and suicide risk (determined on psychiatric interview).
Twenty control subjects underwent the same psychiatric screen-ing procedures as subjects with hyperthyroidism. Inclusion criteria for the age- and sex-matched control group were the following: con-traception; no intake of any psychotropic medication,-blocking agents, thyroid hormones, or antithyroid medication in the past 4 months; and no history of psychiatric, endocrine, neurologic, or other severe medical disease. In both groups, individuals with current de-pendence on alcohol and illegal drugs or a positive urine test for these substances were excluded.
Data Collection
Anthropometric and other information on age, sex, body-mass index, medication use, diagnosis, and smoking and drinking history were obtained for all patients and control participants. Serum FT3, FT4,
TSH, TRAb, and fasting plasma glucose levels were measured on the same investigation day. Fasting plasma glucose was measured by the glucose oxidase method (7600 automatic biochemical analyzer; Hita-chi High-Tech Science Systems Corporation, Osaka, Japan). Others were measured by radioimmunoassay with commercially available kits (Vitros Immundiagnostic Products; Ortho-Clinical Diagnostics, a Johnson & Johnson company, San Jose dos Campos, SP, Brazil).
Psychometric Tests
The emotional distress of each patient was investigated at the be-ginning and end of the study. Anxiety was assessed by the Zung SAS,5and depression was measured by the Zung SDS.6Using
ei-ther the SAS or SDS, we identified 20 items in factor analytic studies for anxiety or depression that corresponded with the defi-nition of theDiagnostic and Statistical Manual of Mental Disor-ders.7Positively and negatively worded items reduce response bias,
and reversed items act as a lie scale. Total standard scores ranged from 25 to 100, with higher scores indicative of greater anxiety or depression. Zung stated that total standard scores ofⱖ45 indi-cated that participants had “clinically significant” anxiety andⱖ50 indicated that respondents could be described as having “clinically significant depression.”8,9The SAS and SDS have been extensively
evaluated, showing good sensitivity, specificity, and reliability for diagnosing anxiety and depression.10-12
PET and Image Reconstruction
Every subject underwent a PET-CT (with18F-FDG) scan at the
begin-ning of the study, and all patients with hyperthyroidism underwent a second scan after recovery. Before the PET scan, patients were asked to fast for 8 hours but had free access to water. PET scans were per-formed with a Biograph 64 PET/CT scanner (Siemens, Erlangen, Ger-many) in 3D mode. A CT transmission scan was first obtained for attenuation correction. The PET scan was started 45 minutes after an intravenous bolus injection of 185 MBq of 18F-FDG and lasted for 10 minutes. Hanning filters were used during image reconstruction, giv-ing a transaxial and axial cutoff frequency of 0.5. We used normalized count images to measure relative changes in regional glucose metab-olism. All studies in patients and healthy controls were performed with the subject’s eyes open in a dimly lit room with minimal auditory stimulation.13
Data Analysis
Clinical data analysis was performed with the use of SPSS software, Version 11.5 (SPSS, Chicago, Illinois). For findings before and after therapy, variables were compared by means of a paired Studentttest for significant change. AllPvalues presented are 2-tailed, and val-ues⬍.05 were considered statistically significant.
PET images were preprocessed with SPM (SPM2; Wellcome De-partment of Cognitive Neurology, London, United Kingdom) imple-mented in Matlab 6.5.1 (MathWorks, Natick, Massachusetts). Scans from each patient were first realigned between pre- and posttherapy and spatially normalized into MNI brain space with linear and non-linear 3D transformations via the mean image obtained following the realignment. The normalized PET images for patients and healthy volunteers were filtered with a Gaussian kernel of 10 mm (full width at half maximum) in the x, y, and z axes, respectively. Mean signal-intensity differences over the whole brain were removed by propor-tional scaling.
BRAIN
ORIGINAL
Effect of Antithyroid Therapy on Regional Glucose Metabolism
To characterize pretherapeutic metabolism in patients with hyperthy-roidism with respect to healthy subjects, we performed a group com-parison by using a 2-samplettest in SPM2 according to the general linear model at each voxel. The effects of the antithyroid therapy on regional brain metabolism were also estimated by using a pairedttest. To evaluate significant differences, we used an approach with the peak threshold set atP⫽.001 (uncorrected) for whole brain regions.14,15
For hypothesis generation, we reported only clusters that survived an FDR correction atP⬍.05. Significant regions were localized by Ta-lairach Daemon software (Research Imaging Center, University of Texas, Austin, Texas) after using a MNI-to-Talairach conversion tool.16SPM maps for increased or decreased metabolism were
over-laid on a standard MR imaging brain template.
Correlation of Emotional Distress with Glucose Metabolism in Patients with Hyperthyroid before Antithyroid Therapy
Using SPM2, we correlated baseline SAS and SDS scores with PET images to evaluate whether specific brain regions would correlate with the measures of emotional distress in patients with hyperthy-roidism. As an exploratory analysis, hypothesis-driven searches were conducted and considered significant atP⬍.001, uncorrected for multiple comparisons. SPM maps showing significant correlation be-tween glucose metabolism and emotional distress were overlaid on a standard MR imaging brain template.
Correlation between Changes in Glucose Metabolism and Clinical Outcome in Patients with Hyperthyroidism
To quantify regionally specific metabolic changes, we constructed a 4-mm-radius VOI within the image space, centered at the peak voxel of clusters that were significant in SPM analysis. The VOIs were pre-defined on the basis of brain regions that were significant in both 2-samplettest results of decreased glucose metabolism compared with normal controls and pairedttest results of increased glucose metabolism after antithyroid therapy in patients. We then calculated the relative glucose metabolic rates in pretherapy and posttherapy PET images respectively with ScAnVP software, Version 5.9.1 (Center for Neurosciences, The Feinstein Institute for Medical Research, Manhasset, New York).17Multiple variable regression analysis was
performed to determine the relationship between changes in the
rel-ative glucose metabolic rates and the clinical measures (including thyroid hormone levels and psychometric scores). Absolute values of standardized coefficients represent the effect of independent variables on the dependent variable. For all analyses, the significance level was set atP⬍.05. Statistical analyses were performed by using SPSS soft-ware, Version 11.5.
Results
Clinical Results
All patients with Graves disease⫺caused hyperthyroidism had nervousness, irritability, increased heart rate and per-spiration, tremors, easy fatigability, heat intolerance, cyn-orexia, and weight loss. One patient experienced a low white blood cell count secondary to methimazole and was prescribed radioisotopes, (Iodine 131). All others who re-ceived the methimazole treatment completed the study. Thyroid-related hormones of all patients are shown in Ta-ble 1. For patients with Graves disease, when most of the symptoms had disappeared and all laboratory test results were normal, the second set of PET scans was performed. The metabolic state became normal within a mean of 77 days (range, 58 –102 days).
The SAS showed that the mean score for anxiety was 48.19⫾9.12 (range, 36.25– 60). Six of 9 patients showed scores⬎45, indicating an anxiety spectrum disorder. The mean score for depression was 44.75⫾6.63 (range, 35– 56.25). Two patients had scoresⱖ50, and both of them also had enhanced anxiety. The questionnaire showed signifi-cantly increased physical symptoms, especially heart prob-lems, dyspnea, perspiration, tremors, and fatigue. After an-tithyroid therapy, all psychometric scores returned to normal levels (P⬍.005).
[image:3.594.53.534.57.203.2]The control subjects underwent the second scans on the same day as the corresponding patients with hyperthyroid-ism, and the average time between PET scans was also 77 days (range, 58 –102). All control participants had normal levels of TSH, FT3, FT4, and TRAb throughout the study; results of the behavioral assessments did not change signif-icantly in the control group between the 2 PET scans (data not shown).
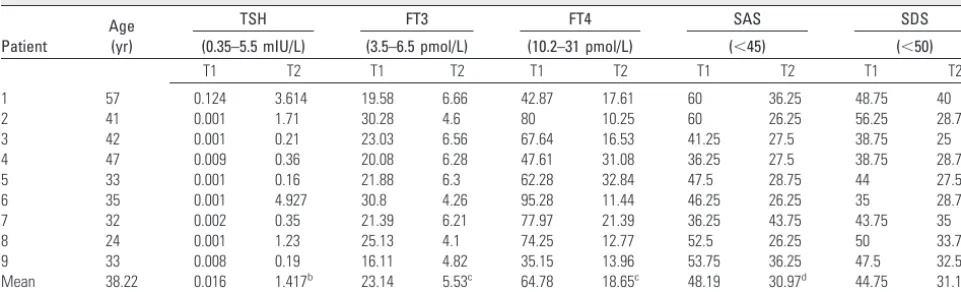
Table 1: Thyroid measurements and psychological scales in patients with hyperthyroidism before and after antithyroid therapya
Patient
Age (yr)
TSH FT3 FT4 SAS SDS
(0.35–5.5 mIU/L) (3.5–6.5 pmol/L) (10.2–31 pmol/L) (⬍45) (⬍50)
T1 T2 T1 T2 T1 T2 T1 T2 T1 T2
1 57 0.124 3.614 19.58 6.66 42.87 17.61 60 36.25 48.75 40
2 41 0.001 1.71 30.28 4.6 80 10.25 60 26.25 56.25 28.75
3 42 0.001 0.21 23.03 6.56 67.64 16.53 41.25 27.5 38.75 25
4 47 0.009 0.36 20.08 6.28 47.61 31.08 36.25 27.5 38.75 28.75
5 33 0.001 0.16 21.88 6.3 62.28 32.84 47.5 28.75 44 27.5
6 35 0.001 4.927 30.8 4.26 95.28 11.44 46.25 26.25 35 28.75
7 32 0.002 0.35 21.39 6.21 77.97 21.39 36.25 43.75 43.75 35
8 24 0.001 1.23 25.13 4.1 74.25 12.77 52.5 26.25 50 33.75
9 33 0.008 0.19 16.11 4.82 35.15 13.96 53.75 36.25 47.5 32.5
Mean 38.22 0.016 1.417b 23.14 5.53c 64.78 18.65c 48.19 30.97d 44.75 31.11c
a
Significant differences were observed between baseline values (T1) and second values (T2) by the Student pairedttest. bP⬍.05.
Group Differences in Relative Brain Activity before Treatment
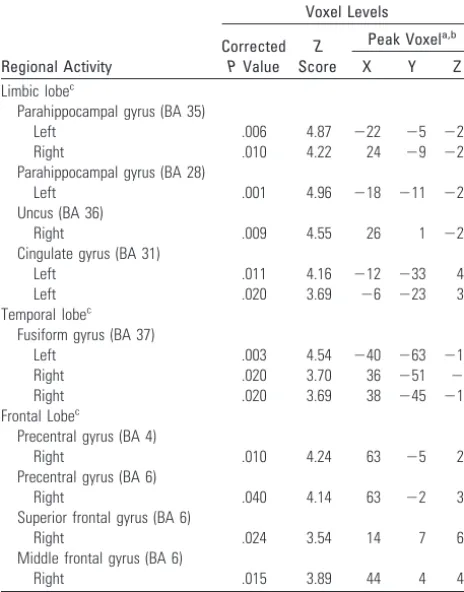
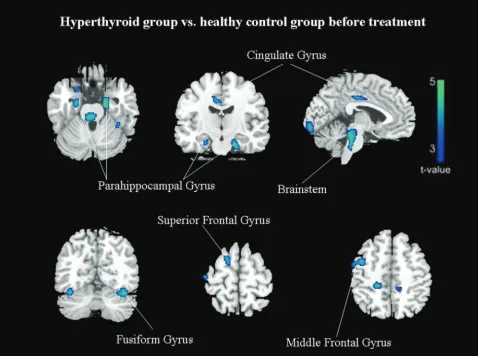
Compared with euthyroid controls, patients with hyperthy-roidism showed no significant increases of regional cerebral glucose metabolism. In contrast, patients with hyperthyroid-ism showed a significantly decreased metabolhyperthyroid-ism in the limbic system, temporal lobe, and frontal lobe, mainly in the para-hippocampal gyrus (bilateral BA 35 and left BA 28), right un-cus (BA 36), left cingulate gyrus (BA 31), bilateral fusiform gyrus (BA 37), right precentral gyrus (BA 4/6), right superior and middle frontal gyrus (BA 6) (FDR-correctedP⬍.05; Ta-ble 2 and Fig 1).
Correlation of Emotional Distress with Relative Brain Activity in Patients with Hyperthyroidism before Treatment
The correlation analysis yielded a significantly negative correlation between the anxiety score in the SAS and the metabolic activity in the left inferior parietal gyrus (BA 40), while the depression score was positively correlated to the metabolic activity of the left cingulate gyrus (BA 31) and paracentral lobule (BA 5). A negative correlation was found between the depression score and the left temporal lobe, mainly the inferior temporal gyrus (BA 20) (uncorrected P⬍.001; Table 3 and Fig 2).
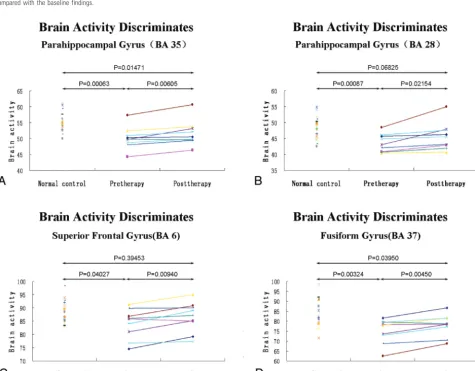
Treatment-Related Changes in Relative Cerebral Activity
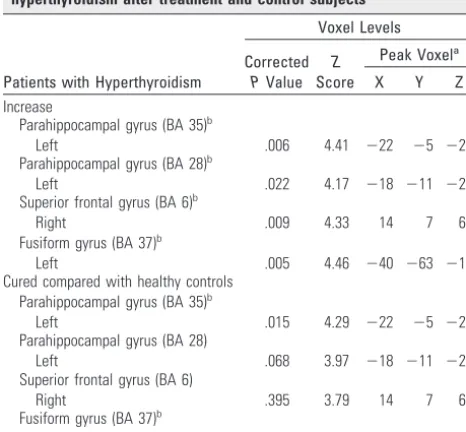
The second set of PET scans was performed in all patients when the symptoms had disappeared and the thyroid hor-mone levels (FT3 and FT4) were normal. Compared with the baseline findings in the hyperthyroid state, the treatment in-duced a significant cluster of increased metabolic activity in the left parahippocampal gyrus (BA 28/35), right superior frontal gyrus (BA 6), and left fusiform gyrus (BA 37). How-ever, compared with euthyroid controls, the glucose metabo-lism was still significantly decreased in the left parahippocam-pal gyrus (BA 35) and fusiform gyrus (BA 37) (FDR-corrected P⬍.05; Table 4 and Figs 3 and 4). No significant increase was identified for other regions.
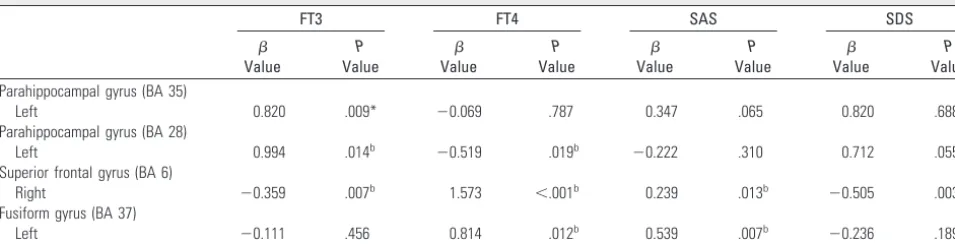
The Associations between the Relative Brain Activity and Thyroid Hormone Levels and Emotional Symptoms of Patients
The decrease in both FT3 and FT4 was associated with in-creased relative glucose metabolic rates in the left parahip-pocampal gyrus (BA 28) and the right superior frontal gyrus (BA 6) (P⬍.05; Table 5). Other rehabilitation regions were affected by a single thyroid hormone. An increase in the left parahippocampal gyrus activity (BA 35) was positively corre-lated with a decrease in FT3 (⫽0.820,P⫽.009), and an increase in the left fusiform gyrus activity (BA 37) was posi-tively correlated with a decrease in FT4 (⫽0.814,P⫽.012). Furthermore, the increase in activity from the first scan to the second in the right superior frontal gyrus (BA 6) (⫽0.239, P⫽.013) and the left fusiform gyrus (BA 37) (⫽0.539,P⫽ .007) was positively correlated with a decrease of anxiety symptoms. There was also a negative correlation between the decrease in depressive symptoms and the increase in relative activity in the right superior frontal gyrus (BA 6) (⫽ ⫺0.505, P⫽.003).
Discussion
This is the first brain functional imaging study about the cere-bral metabolic changes in Graves disease before and after an-tithyroid treatment. In this study, adult patients with previ-ously untreated hyperthyroidism showed less relative activity in multiple brain regions than healthy control subjects. The differences reached statistical significance in the limbic system (parahippocampus, cingulate gyrus, and uncus), temporal and frontal cortices, and all brain centers integral to the neuro-circuitry of clinical behavior, mood, and memory regula-tion.18-20 After antithyroid therapy, the patient group
dis-played a normalization of brain metabolism in some regions, and statistical differences between the 2 groups were no longer detected. Treatment with methimazole specifically increased regional activity in the left parahippocampus and the right superior frontal gyrus. There also was an association between changes in relative brain activity and disease severity, mea-sured by FT3, FT4, and psychometric scores. The findings sug-gest that thyroid hormones participate in the modulation of cerebral glucose metabolism in the mature brain. The cerebral changes induced by thyrotoxicosis could recover when thy-roid hormone levels were normal.
[image:4.594.53.285.81.377.2]First reported in the 1950s, the effects of hyperthyroidism on cerebral activity described as cerebral blood flow with nor-mal oxygen consumption increased.21,22These early findings Table 2: The difference at baseline between patients with
hyperthyroidism and control subjects in relative regional cerebral activity
Regional Activity
Voxel Levels
Corrected
PValue
Z
Score
Peak Voxela,b
X Y Z
Limbic lobec
Parahippocampal gyrus (BA 35)
Left .006 4.87 ⫺22 ⫺5 ⫺25
Right .010 4.22 24 ⫺9 ⫺25
Parahippocampal gyrus (BA 28)
Left .001 4.96 ⫺18 ⫺11 ⫺21
Uncus (BA 36)
Right .009 4.55 26 1 ⫺29
Cingulate gyrus (BA 31)
Left .011 4.16 ⫺12 ⫺33 42
Left .020 3.69 ⫺6 ⫺23 38
Temporal lobec Fusiform gyrus (BA 37)
Left .003 4.54 ⫺40 ⫺63 ⫺14
Right .020 3.70 36 ⫺51 ⫺8
Right .020 3.69 38 ⫺45 ⫺15
Frontal Lobec
Precentral gyrus (BA 4)
Right .010 4.24 63 ⫺5 22
Precentral gyrus (BA 6)
Right .040 4.14 63 ⫺2 30
Superior frontal gyrus (BA 6)
Right .024 3.54 14 7 60
Middle frontal gyrus (BA 6)
Right .015 3.89 44 4 48
a
Talairach coordinates.
bPositive values of the x, y, and z coordinates approximately represent millimeters to the right, anterior, and superior relative to the anterior commissure.
were interpreted as the result of decreased vascular resistance, instead of primary changes in brain function. Only decades later did investigators discover significant abnormalities in brain metabolism in the hyperthyroid state. MR spectroscopy
was used to demonstrate a relatively decreased choline/crea-tine ratio of the right prefrontal cortex in patients with hyper-thyroidism, a finding thought to reflect an altered brain cho-linergic-adrenergic balance in hyperthyroidism.18 Recent functional brain imaging studies by using SPECT and FDG-PET demonstrated that thyroid hormones affect regional brain metabolism in patients with hyperthyroidism.4,23These
studies showed a significantly reduced blood flow of the bilat-eral temporal-parietal cortex or a decreased metabolism of the uncus and the inferior temporal gyrus. Increased breathing and heart rates might inhibit metabolism of the brain stem. Also, in our study, hyperthyroidism-associated regional hypo-metabolism was noted.
Compared with previous imaging studies of hyperthyroid-ism, our study detected altered metabolism in regions beyond the uncus, temporal cortex, and prefrontal cortex. In addition to the posterior cingulate and the inferior parietal lobe, new cerebral regions correlated with anxiety and depression scales were identified. These may be due to differences in patient samples, severity of disease, and imaging methodology. In the previous studies, the number of patients was relatively small or the state of hyperthyroidism was mild.4,18,23Furthermore,
[image:5.594.56.535.49.405.2]dif-ferent neuroimaging techniques, (eg, proton MR spectroscopy and SPECT with lipophilic radiotracers) were used in the stud-ies of patients with hyperthyroidism.18,23Most interesting, the Fig 1.Group differences in regional cerebral activity before treatment (FDR-corrected atP⬍.05). The figures are depicted in neurologic orientation. The gray-scale image is a T1 structural MR image that is representative of MNI space. Blue areas represent where the patients with hyperthyroidism exhibited lower activity relative to control subjects.
Table 3: The relationship of cerebral activity with SAS and SDS in patients with hyperthyroidisma
Relationship
Voxel Levels
Uncorrected
PValue
Z
Score
Peak Voxelb
X Y Z
SAS Parietal lobe
Inferior parietal gyrus (BA 40)
Left ⬍.001 4.83 ⫺48 ⫺41 44
Left ⬍.001 3.63 ⫺57 ⫺33 37
SDS Limbic lobe
Cingulate gyrus (BA 31)
Left ⬍.001c 4.25 ⫺12c ⫺29c 44c
Frontal lobe
Paracentral lobule (BA 5)
Left ⬍.001c 3.44c ⫺6c ⫺40c 55c
Temporal lobe
Inferior temporal gyrus (BA 20)
Left ⬍.001 3.86 ⫺55 ⫺45⫺15
aUncorrectedPvalue⬍.001. b
Talairach coordinates.
[image:5.594.52.285.468.653.2]methods used to analyze data from the PET studies varied. Many PET studies were based on a region-of-interest ap-proach that examined select regions originally reported by ear-lier studies.19,24,25The region-of-interest method requires that
regions be manually delineated, a subjective and technically
laborious process for which operators must be rigorously trained.
Also, methods for manually defining anatomic landmarks differed among studies; this difference may have lead to incon-sistencies in reported volume changes. Additionally, an a pri-ori hypothesis is required because researchers must choose specific regions to investigate on the basis of prior evidence. Therefore, critically implicated regions may have been over-looked in most previous studies using region-of-interest ap-proaches. However, a whole brain⫺based analysis by using a voxel-level analysis method was performed in our study to localize more areas not previously examined in earlier region-of-interest studies. A key feature of this rapid and automated method of analysis is that it examines differences in gray mat-ter throughout the brain, without the need to prespecify re-gions of interest for investigation. This unbiased approach is of value both to confirm the validity of the hypothesis devel-oped in region-of-interest studies and to reveal gray matter differences in areas not previously considered.
Our findings are also different from neuroimaging studies of mood disorders in euthyroid humans. Neuroimaging stud-ies of major emotional dysfunction in euthyroid humans have identified neurophysiologic abnormalities in multiple areas of the frontal and temporal cortices, the insula, the amygdala, and related parts of the striatum and thalamus.19,26-28Some of
these abnormalities persist following symptom remission, and postmortem studies demonstrated that these regions had cor-tex volume reductions and histopathologic changes.19,20
[image:6.594.52.538.47.336.2]Be-sides these regions, we found significant hypoactivity in the cingulate gyrus, involved in behavior, learning, and memory. Some of the hypoactive regions, such as the left parahip-Fig 2.Covariation of relative brain activity before treatment in the hyperthyroid group with psychometric scores (uncorrectedP⬍.001). Blue areas exhibit negative correlation and red areas exhibit positive correlation between the psychometric score and normalized glucose metabolism in the patients with hyperthyroidism.
Table 4: Treatment effects: comparison of changes in relative cerebral activity between the first and second PET assay in patients with hyperthyroidism (effect of treatment with methimazole) and differences between patients with hyperthyroidism after treatment and control subjects
Patients with Hyperthyroidism
Voxel Levels
Corrected
PValue
Z
Score
Peak Voxela
X Y Z
Increase
Parahippocampal gyrus (BA 35)b
Left .006 4.41 ⫺22 ⫺5 ⫺25
Parahippocampal gyrus (BA 28)b
Left .022 4.17 ⫺18 ⫺11 ⫺21
Superior frontal gyrus (BA 6)b
Right .009 4.33 14 7 60
Fusiform gyrus (BA 37)b
Left .005 4.46 ⫺40 ⫺63 ⫺14
Cured compared with healthy controls Parahippocampal gyrus (BA 35)b
Left .015 4.29 ⫺22 ⫺5 ⫺25
Parahippocampal gyrus (BA 28)
Left .068 3.97 ⫺18 ⫺11 ⫺21
Superior frontal gyrus (BA 6)
Right .395 3.79 14 7 60
Fusiform gyrus (BA 37)b
Left .040 4.09 ⫺40 ⫺63 ⫺14
aTalairach coordinates. b
[image:6.594.52.285.428.644.2]pocampal gyrus (BA 28) and the right superior frontal gyrus (BA 6), became normal and correlated positively with the de-crease of FT3 and FT4 (Tables 4 and 5). This finding may implicate primary effects of thyroid hormones that result in the emotional, motivational, cognitive, and behavioral
mani-festations of affective disorders. Also, the observed correla-tions to the cerebral metabolism may be directly induced by the elevated thyroid hormone concentrations and were not a secondary epiphenomenon due to hyperthyroid-associated mood changes. The effect on the cerebrum was mediated by Fig 3.Effects of antithyroid treatment on regional cerebral activity (FDR-corrected atP⬍.05). Red areas represent where brain activity increased after treatment in the hyperthyroid group compared with the baseline findings.
[image:7.594.52.538.45.232.2] [image:7.594.58.534.256.627.2]actions of thyroid hormones on thyroid hormone nuclear re-ceptors. Therefore, with increased disease severity, there is lower metabolism in high-concentration regions of T3 nuclear receptors.18,29Thyroid hormones (age-dependent) also
mod-ulate the expression of the cerebralGLUT-1, suggested by the reduced 55-kDaGLUT-1isoform in both hyperthyroid and hypothyroid young rats. TheGLUT-1isoform located at the blood-brain barrier is essential for glucose uptake, and a hy-perthyroidism-induced decrease in its expression might ex-plain the cortical hypometabolism noted in patients with thyrotoxicosis.30
There were 2 unexpected findings in our study. One was that the emotional distress⫺associated regions were not com-pletely consistent with hypoactive regions before treatment. This finding might be due to the fact that global cerebral me-tabolism is affected by multiple factors, so a single correlation analysis could not reflect the changes of the whole brain. The other finding was that treatment with methimazole improved memory and constructive abilities when the euthyroid state was established. Uptake defects in the left parahippocampal gyrus, the fusiform gyrus, and the superior frontal gyrus re-gions also responded significantly to the medication (FDR-corrected atP⬍.05). However, other regions were still hypo-active. This might be due to the insufficient length of treatment (mean, 77 days). Some brain regions had not turned to normal. More important, all of these recovered re-gions were correlated significantly with the decrease of FT3 or FT4 (Tables 4 and 5). This correlation implicated that the hy-poactivity of these regions resulted from thyrotoxicosis and could increase to normal after antithyroid therapy. Other re-gions that could not recover might be a secondary epiphenom-enon involving other interference factors, such as primary mood disorders. Therefore, the regions mentioned in previous studies on hyperthyroidism4,31may not only reflect the effect
of thyroid hormones. In view of the above-mentioned finding, single-correlation analysis could not reflect the changes of global brain metabolism. In the future, we may need to explore the hyperthyroidism network on the basis of multivariate sta-tistical analysis, such as primary component analysis.
Conclusions
Our major finding includes the association of somatic and depressive symptoms in the hyperthyroid state with decreased activity in the limbic system and the frontal and temporal lobes and the association between improved symptoms and
activity changes when the euthyroid state is reached. Thyroid hormones are active in modulating metabolic function in the adult brain, and abnormal cerebral metabolism might be one of the possible mechanisms in mood disorder. The behavioral symptoms and subjective disturbances that many patients with hyperthyroidism have may be an integral part of the symptoms of the illness, just as perspiration and heat intoler-ance are. Our findings indicate that the mood changes caused by Graves disease respond favorably to treatment with regard to clinical symptoms and PET findings, and functional imag-ing may contribute to elucidatimag-ing the potentially different background of psychiatric complications.
Acknowledgments
We sincerely thank the patients who participated.
References
1. Fahrenfort JJ, Wilterdink AM, van der Veen EA.Long-term residual
com-plaints and psychosocial sequelae after remission of hyperthyroidism. Psy-choneuroendocrinology2000;25:201–11
2. Sait Gonen M, Kisakol G, Savas Cilli A, et al.Assessment of anxiety in
subclin-ical thyroid disorders.Endocr J2004;51:311–15
3. Bauer M, Szuba MP, Whybrow PC, eds.Psychiatric and Behavioral
Manifesta-tions of Hyper- and Hypothyroidism.Washington, DC: American Psychiatric Press; 2003
4. Schreckenberger MF, Egle UT, Drecker S, et al.Positron emission tomography
reveals correlations between brain metabolism and mood changes in hyper-thyroidism.J Clin Endocrinol Metab2006;91:4786 –91
5. Zung WW. A rating instrument for anxiety disorders. Psychosomatics
1971;12:371–79
6. Zung WW.A self-rating depression scale.Arch Gen Psychiatry1965;12:63–70
7. American Psychiatric Association.Diagnostic and Statistical Manual of Mental
Disorders.Washington, DC: American Psychiatric Association; 2000
8. Zung WW.From art to science: the diagnosis and treatment of depression.
Arch Gen Psychiatry1973;29:328 –37
9. Zung WW, ed.How Normal is Anxiety? Current Concepts.Durham, North
Carolina: Upjohn; 1980
10. Sharpley CF, Christie DR.An analysis of the psychometric profile and
fre-quency of anxiety and depression in Australian men with prostate cancer.
Psychooncology2007;16:660 – 67
11. Sharpley CF BV, Christie DR.Understanding the causes of depression among
prostate cancer patients: development of the Effects of Prostate Cancer on Lifestyle Questionnaire.Psychooncology2009;18:162– 68
12. Schaefer A, Brown J, Watson CG, et al.Comparison of the validities of the Beck,
Zung, and MMPI Depression Scales. J Consult Clin Psychol1985;53:415–18
13. Wang J, Ma Y, Huang Z, et al.Modulation of metabolic brain function by
bilateral subthalamic nucleus stimulation in the treatment of Parkinson’s disease.J Neurol2009;257:72–78
14. Saxena S, Brody AL, Ho ML, et al.Differential brain metabolic predictors of
response to paroxetine in obsessive-compulsive disorder versus major de-pression.Am J Psychiatry2003;160:522–32
15. Smith GS, Kramer E, Hermann C, et al.Serotonin modulation of cerebral
[image:8.594.54.532.57.179.2]glucose metabolism in depressed older adults.Biol Psychiatry2009;66: 259 – 66
Table 5: Associations between the relative brain activity and thyroid hormone levels as well as emotional symptoms of patientsa
FT3 FT4 SAS SDS
 Value P Value  Value P Value  Value P Value  Value P Value Parahippocampal gyrus (BA 35)
Left 0.820 .009* ⫺0.069 .787 0.347 .065 0.820 .688
Parahippocampal gyrus (BA 28)
Left 0.994 .014b ⫺0.519 .019b ⫺0.222 .310 0.712 .055
Superior frontal gyrus (BA 6)
Right ⫺0.359 .007b 1.573 ⬍.001b 0.239 .013b ⫺0.505 .003b
Fusiform gyrus (BA 37)
Left ⫺0.111 .456 0.814 .012b 0.539 .007b ⫺0.236 .189
16. Lancaster JL, Woldorff MG, Parsons LM, et al.Automated Talairach atlas labels for functional brain mapping.Hum Brain Mapp2000;10:120 –31
17. Huang C, Tang C, Feigin A, et al.Changes in network activity with the
progres-sion of Parkinson’s disease.Brain2007;130:1834 – 46
18. Bhatara VS, Tripathi RP, Sankar R, et al.Frontal lobe proton
magnetic-reso-nance spectroscopy in Graves’ disease: a pilot study.Psychoneuroendocrinology
1998;23:605–12
19. Drevets WC.Neuroimaging studies of mood disorders.Biol Psychiatry2000;
48:813–29
20. Rosen HJ, Levenson RW.The emotional brain: combining insights from
pa-tients and basic science.Neurocase2009;15:173– 81
21. Sokoloff L, Wechsler RL, Mangold R, et al.Cerebral blood flow and oxygen
consumption in hyperthyroidism before and after treatment.J Clin Invest
1953;32:202– 08
22. Sensenbach W, Madison L, Eisenberg S, Ochs L.The cerebral circulation and
metabolism in hyperthyroidism and myxedema. J Clin Invest 1954;33: 1434 – 40
23. Fukui T, Hasegawa Y, Takenaka H.Hyperthyroid dementia:
clinicoradiologi-cal findings and response to treatment.J Neurol Sci2001;184:81– 88
24. Davidson RJ, Lewis DA, Alloy LB, et al.Neural and behavioral substrates of
mood and mood regulation.Biol Psychiatry2002;52:478 –502
25. Bauer M, Silverman DH, Schlagenhauf F, et al.Brain glucose metabolism in
hypothyroidism: a positron emission tomography study before and after thyroid hormone replacement therapy. J Clin Endocrinol Metab
2009;94:2922–29
26. Marangell LB, Ketter TA, George MS, et al.Inverse relationship of peripheral
thyrotropin-stimulating hormone levels to brain activity in mood disorders.
Am J Psychiatry1997;154:224 –30
27. Bench CJ, Friston KJ, Brown RG, et al.Regional cerebral blood flow in
depres-sion measured by positron emisdepres-sion tomography: the relationship with clin-ical dimensions.Psychol Med1993;23:579 –90
28. Mayberg H.Depression. II. Localization of pathophysiology.Am J Psychiatry
2002;159:1979
29. Wilcoxon JS, Nadolski GJ, Samarut J, et al.Behavioral inhibition and impaired
spatial learning and memory in hypothyroid mice lacking thyroid hormone receptor alpha.Behav Brain Res2007;177:109 –16
30. Mooradian AD, Girgis W, Shah GN.Thyroid hormone-induced GLUT-1
ex-pression in rat cerebral tissue: effect of age.Brain Res1997;747:144 – 46
31. Lass P, Slawek J, Derejko M, et al.Neurological and psychiatric disorders in