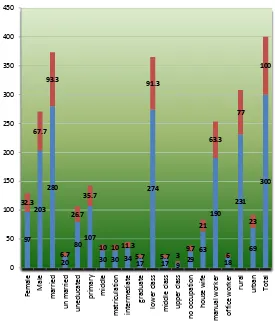
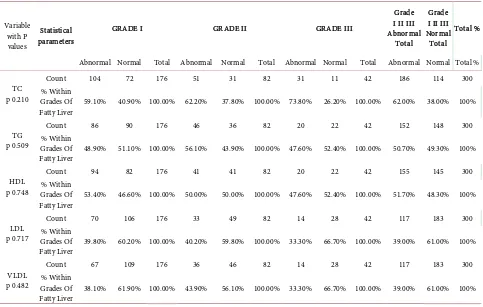
Non Alcoholic Fatty Liver Disease: Assessment of Lipid Profile Estimation in Different Grades of Fatty Liver on Ultrasound
Full text
Figure


Related documents
At the heart of this design BHS uses the Lenze servo drives series 9400 with integrated PLC for the main drive of the unwind and for the braking roller.. This solution
India is pioneer in constructing the social account matrices for its economy for various years, but limited efforts have been made to construct a SAM for India with detailed
Spline nodes are created to allow for a piecewise linear relation between the two variables, growth in dividends payout and the ownership structure, this technique allows the slope
Study and Evaluation of Groundwater Quality of malwa Region, Punjab (North india) Table 5 continued P arameters Mohali Bar nala P atiala Moga Mansa P.. ermissible limit
This necessitated the use of combined finite----disc disc discrete element method to generate disc rete element method to generate rete element method to generate rete element
Some of the examples of Health Information Technology tools used for diabetes management include Mobile Health Technology; Internet/cloud-based technology; Electronic
I approach this terrain by engaging with a film work, Blind Spot , by the contemporary video artist Gary Hill, in the twin contexts of, initially, a phenomenology