ISSN Online: 2153-1242 ISSN Print: 2153-1234
DOI: 10.4236/jis.2018.91004 Dec. 20, 2017 33 Journal of Information Security
DDoS Attack Detection Using Heuristics
Clustering Algorithm and Naïve Bayes
Classification
Sharmila Bista, Roshan Chitrakar
Department of Graduate Studies, Nepal College of Information Technology, Lalitpur, Nepal
Abstract
In recent times among the multitude of attacks present in network system, DDoS attacks have emerged to be the attacks with the most devastating ef-fects. The main objective of this paper is to propose a system that effectively detects DDoS attacks appearing in any networked system using the clustering technique of data mining followed by classification. This method uses a Heu-ristics Clustering Algorithm (HCA) to cluster the available data and Naïve Bayes (NB) classification to classify the data and detect the attacks created in the system based on some network attributes of the data packet. The cluster-ing algorithm is based in unsupervised learncluster-ing technique and is sometimes unable to detect some of the attack instances and few normal instances, therefore classification techniques are also used along with clustering to over-come this classification problem and to enhance the accuracy. Naïve Bayes classifiers are based on very strong independence assumptions with fairly simple construction to derive the conditional probability for each relationship. A series of experiment is performed using “The CAIDA UCSD DDoS Attack 2007 Dataset” and “DARPA 2000 Dataset” and the efficiency of the proposed system has been tested based on the following performance parameters: Ac-curacy, Detection Rate and False Positive Rate and the result obtained from the proposed system has been found that it has enhanced accuracy and detec-tion rate with low false positive rate.
Keywords
DDoS Attacks, Heuristic Clustering Algorithm, Naïve Bayes Classification, CAIDA UCSD, DARPA 2000
1. Introduction
In today’s world of high speed internet and network system, security of system How to cite this paper: Bista, S. and
Chi-trakar, R. (2018) DDoS Attack Detection Using Heuristics Clustering Algorithm and Naïve Bayes Classification. Journal of In-formation Security, 9, 33-44.
https://doi.org/10.4236/jis.2018.91004
Received: October 31, 2017 Accepted: December 17, 2017 Published: December 20, 2017
Copyright © 2018 by authors and Scientific Research Publishing Inc. This work is licensed under the Creative Commons Attribution International License (CC BY 4.0).
DOI: 10.4236/jis.2018.91004 34 Journal of Information Security from various threats has been a major concern world widely. Among various possible network threats and attacks, Distributed Denial of Service attack is the attack with most devastating effects. A Denial of Service attack is the type of at-tack that typically uses a single computer and one internet connection to flood a targeted system or resources [1] so as to prevent the legitimate users from ac-cessing the system or the resources. A distributed denial of service attack is one in which a multitude of compromised systems attack a single target, thereby causing denial of service for users of the targeted system.
Intrusion detection is “the process of monitoring the events occurring in a computer system or network and analyzing them for signs of intrusions, defined as attempts to compromise the confidentiality, integrity, availability, or to bypass the security mechanisms of a computer or network” [2]. There are generally two types of Intrusion detection system: Misuse detection and Anomaly detection. In misuse detection, each instance in a data set is labeled as “normal” or “intrusion” and a learning algorithm is trained over the labeled data. Whereas an anomaly detection technique builds models of normal behavior, and automatically detects any deviation from it, flagging the latter as suspect [2].
For developing an effective intrusion detection system, data mining tech-niques have been very helpful and a lot of research is ongoing these days because data mining approach is useful for extracting a wide range of features from net-work flow which can be helpful for distinguishing the attack packet from normal packet. In this proposed system, clustering followed with classification technique of data mining has been used. Clustering is the unsupervised technique that is used to group together the similar items to extract new knowledge from a largely data set. While classification is a data mining technique that assigns categories to collection of data in order to aide in more accurate predictions and analysis.
DOI: 10.4236/jis.2018.91004 35 Journal of Information Security transactions.
Classification technique categories the available set of data for accurate analy-sis. The category can be termed as class label. In case of anomaly detection, it will classify the data generally into two categories namely normal or abnormal
[4]. A Naïve Bayes classifier is a simple probabilistic classifier based on applying Bayes’ theorem with strong (naïve) independence assumptions. A Naïve Bayes classifier assumes that the presence (or absence) of a particular feature of a class is unrelated to the presence (or absence) of any other feature. Depending on the precise nature of the probability model, Naïve Bayes classifiers can be trained very efficiently in a supervised learning setting.
Bayes Theorem can be expressed as:
(
|)
(
|) ( ) ( )
P H X =P X H P H P X (1)
Let X be the data record, H be some hypothesis representing data record X, which belongs to a specific class C. For classification, we would like to determine
P(H|X), which is the probability that the hypothesis H holds, given an observed data record X. P(H|X) is the posterior probability of H conditioned on X. In contrast, P(H)is the prior probability. The posterior Probability P(H|X), is based on more information such as background knowledge than the prior probability
P(H), which is independent of X. Similarly, P(X|H)is posterior probability of X
conditioned on H. Bayes theorem is useful because it provides ways to calculate the posterior probability P(H|X)from P(H), P(X), and P(X|H) [5].
Therefore, the use of Heuristic Clustering Algorithm followed by Naïve Bayes Classification in this paper has contributed to overcome the problem of degene-racy, has developed as DDoS attack detection system that takes into account of both the character and numerical attributes of the network data packet. The proposed hybrid learning approach has lead into better performances in terms of Accuracy, Detection Rate and False Positive Rate and has proved that hybrid learning approach is better than Clustering and Classification technique alone.
2. Related Work
DOI: 10.4236/jis.2018.91004 36 Journal of Information Security T. Velmurugan and T. Santhanam have analyzed the efficiency of k-Means and k-Medoids clustering algorithms by using large datasets in the cases of nor-mal and uniform distribution; and found that the average time taken by k-Means algorithm is greater than that of k-Medoids algorithms for both the cases [2].
M. Jianliangetall has implemented K-means algorithm to cluster and analyze the data of KDD-99 dataset. This algorithm can detect unknown intrusions in the real network connections. The simulations results that run on KDD-99 data set showed that the K-means method is an effective algorithm for partitioning large data set. Jose F. Nieves presented a comparative study with more emphasis on the unsupervised learning methods for anomaly detection. K-means algo-rithm with KDD Cup 1999 network data set is used to evaluate the performance of an unsupervised learning method for anomaly detection. High detection rate can be achieved while maintaining a low false alarm rate is the results of this work evaluation [6].
K. Sarmila, G. Kavin has introduced the Heuristic clustering algorithm to cluster the data and detect DDoS attacks i; n DARPA 2000 datasets and has ob-tained better results in terms of detection rate and false positive rate in compar-ison to K-Means and K-Medoids algorithm. Chitrakar R and Huang chuanhe has proposed a hybrid learning approach of combining k-medoids clustering and naive bayes classification that has grouped the whole data into clusters more accurately than K-means such that it results in better classification. The hybrid approach was tested in Kyoto 2006+ datasets.
[image:4.595.214.538.544.705.2]3. Proposed Method
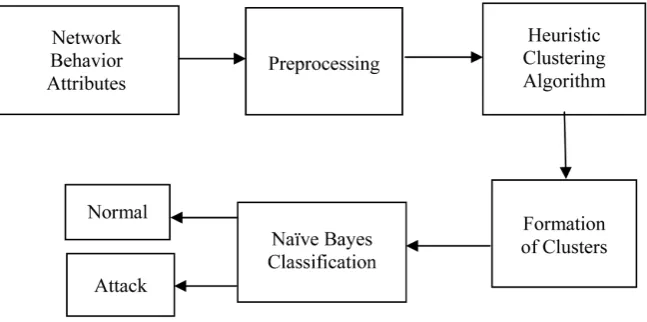
Figure 1 here shows the system block diagram of the proposed algorithm .Here, the workflow starts with the extraction of nine network attributes from the da-tasets followed by the preprocessing of data to eliminate those data values that would ultimately result in wrong output. Once, the dataset is prepared after pre-processing, those datasets are fed into Heuristics Clustering Algorithm that results
DOI: 10.4236/jis.2018.91004 37 Journal of Information Security in cluster formation. After the cluster formation dataset is then classified as ei-ther Attack or Normal instances using Naïve Bayes Classification.
The proposed method uses Heuristic Clustering Algorithm for clustering of data which is then followed by Naïve Bayes Classification for classifying the clusters into either Normal or Attack instances. For comparison of the results obtained from the proposed method with the result from existing system of ref-erence paper, labelling scheme defined in the paper is also performed after clus-tering. Finally, the result obtained is compared using the performance parame-ters namely Accuracy, Detection Rate and False Positive Rate. The algorithm used is discussed below.
3.1. Heuristic Clustering Algorithm
1) Some Notations
Notation1: Let H=
{
H H1, 2,,Hm}
be a set of attribute values, the m is number of attribute valuesNotation 2: Let H=HNHS and HNHS= ∅, where HN is the subset of numerical attribute and HS is the subset of character attribute.
Notation 3: Let, ei=
(
h hi1, i2,,him)
, ei is a record, the m is number of attribute values and hij is the value of Hm.Notation 4: E=
{
e e1, 2,,en}
, E is the set of records; n is the number of packets [2].The Center of Cluster
A cluster is represented by its cluster center. In the HCA algorithm, we use the algorithm Count ( ) to compute the cluster center. The center of a cluster is composed of the center of numerical attributes and character attribute. Let P = (PN + PS), and P = (P1, P2, ∙∙∙, Pm) where PN is the center of numerical attribute, the PS is the center of character attribute,
(
)
1
1
, 1, 2, ,
n
N j
P hji i p p m
n =
=
∑
= ≤ (2)The hji is the numerical attribute and PS is the frequent character attribute set which consists of q most frequent character attribute [2].
2) The Initial Center of Cluster
In the beginning of clustering, we should confirm two initial center of clus-tering by the algorithm Search ( ).
Algorithm: Search_m(E,l).
Input: E = data set
l = number of sampling Output: Initial center m1, m2. Pseudocodes:
1) From the set of data E, get samples S1, S2, ∙∙∙,Sl
2) For i ← 1 to L
DOI: 10.4236/jis.2018.91004 38 Journal of Information Security 3) Computing Similarity
The dataset consists of numerical attribute and character attribute. The simi-larity of character attributes is calculated through attribute matching.
Let ei and ej be two records in the E. all containing m attributes (including P
character attributes), the nhik and nhjk is the number of hik and hjk respective-ly.
(
,)
1p P
k i j
nhik nhjk
A nhik nhjk
Sim e e = = + ∗
∗
∑
(3)If (hik = hjk) then A =0else A = 1.
The similarity of numerical attribute (to the numerical attribute, still use the classical Euclidean distance to computer similarity.
(
,)
1 2q k N
i j hik hjk
Sim e e =
∑
= − (4)The similarity of two records (including similarity of numerical attribute and similarity of character attribute) is calculated as:
(
i, j)
N(
i, j)
P(
i, j)
Sim e e =Sim e e +Sim e e (5) [2]
4) Heuristic Clustering Algorithm
Step 1. Confirm two initial cluster centers by algorithm search ( ). Step 2. Import a new record.
Step 3. Compute the similarity between the new record and the centers of clusters by algorithm Similar ().
Step 4. Compute the similarity between the centers of clusters.
Step 5. If the minimum similarity between the record and centers of clusters is greater than the minimum similarity between the centers of clusters, create a new cluster with the record as the new center until no change [2].
5) Labelling
In the labeling method, we assume that center of a normal cluster is highly close to the initial cluster center vh which are created from the clustering. In other words, if a cluster is normal, the distance between the center of the cluster and vh will be small, otherwise it will be large. Thus, we first, for each cluster center Cj, calculate the maximum distance to vh. We then calculate the average distance of the maximum distances. If the maximum distance from a cluster to
vh is less than the maximum average distance, we label the cluster as normal. Otherwise, label as attack. Here the similarity measure is used as the distance measure i.e. Attribute Matching for character attributes and Euclidean distance measure for numerical attributes [2].
3.2. Naïve Bayes Classification
Input: D: Data set having n data objects
C: Set of classes e.g. {Normal; Attack}
X: Data record to be classified
DOI: 10.4236/jis.2018.91004 39 Journal of Information Security Output: The predicted class CNB where X should be classified into.
Pseudocodes:
For j ← 1 to no. of classes
Cj_count ← no. of Di where Di.class_label = j; P(Cj) ← Cj_count/n;
For each attribute value Xl in X Xl_count ← no. of Xl in Cj;
P(Xl |Cj) ← Xl_count / Cj_count; EndFor
P(X) ← average (P(Xl |Cj)); Endfor
For j ← 1 to no_of_classes
P(Cj|X) ← P(Cj/H) * P(Cj) / P(X) CNB = max(P(Cj|X)) [5]
4. Experiments and Results
Two sets of experiments are performed as:
1) Heuristics Clustering Algorithm with Labelling
2) Heuristics Clustering Algorithm with Naïve Bayes Classification a) Selection of Experimental Data
To perform the series of experiments 12 samples of two different datasets namely “CAIDA UCSD DDoS Attack 2007 Dataset” and DARPA 2000 Dataset” with each sample consisting of 10,000 datasets are selected.
b) Extraction of Network Attributes
The set of 9 data packet attributes are extracted from the dataset. The attributes are Source IP Address, Destination IP Address, Protocol, Source Port, Destination Port, Sequence number, Acknowledgment number, length, and Window size.
c) Data Pre-processing
Data pre-processing is done to eliminate all those data packets that would ul-timately lead to wrong results using data analysis tools: Wireshark Tool.
d) The Experimental Procedure
Using the selected sets of data samples, both the programs are executed si-multaneously and the number of true positive, true negative, false positive and false negative values of both the programs are recorded and used in the perfor-mance evaluation of both the programs.
e) Performance Parameters
The performance of the proposed algorithm is evaluated using the Perfor-mance parameters namely Accuracy (A), Detection Rate (DR) and False Positive Rate (FPR) using following equations:
( ) (
) (
)
Accuracy A = TP+TN TP+TN+FP+FN (6)
( ) ( ) (
)
Detection Rate DR = TP TP+FP (7)
(
) ( ) (
)
DOI: 10.4236/jis.2018.91004 40 Journal of Information Security where,
True Positive (TP) = Attacks that are correctly detected as attack True Negative (TN) = Normal data that are correctly detected as normal False Positive (FP) = Normal data that are incorrectly detected as attack False Negative (FN) = Attack that are incorrectly detected as normal
[image:8.595.210.537.530.739.2]The below shown tables illustrates the improvement of accuracy, detection rate and false positive rate of the proposed algorithm i.e. Heuristics Clustering Algorithm with Naïve Bayes Classification over Heuristics Clustering algorithm with Labelling.
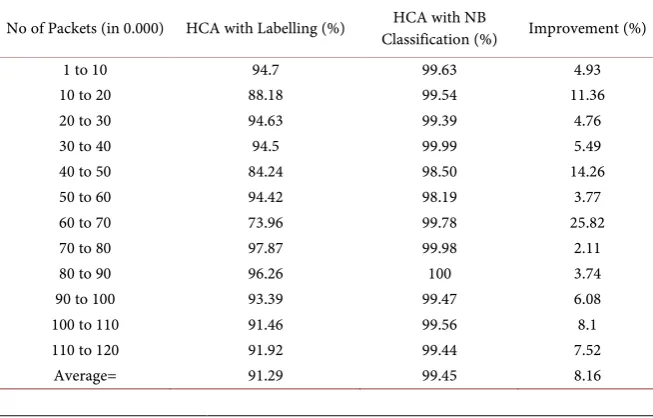
Table 1 here shows the improvement in Accuracy with HCA Clustering with NB Classification in UCSD DDoS attack 2007 dataset where we can see the av-erage improvement of 8.16% with highest improvement of 25.82% and lowest as 2.11%.
Table 2 here shows the improvement in Accuracy with HCA Clustering with NB Classification in DARPA 2000 dataset where we can see the average im-provement of 14.31% with highest imim-provement of 29.67% and lowest as 0.8%.
Table 3 here shows the improvement in Detection Rate with HCA Clustering with NB Classification in UCSD DDoS attack 2007 dataset where we can see the average improvement of 32.21% with highest improvement of 66.35% and low-est as 1.71%.
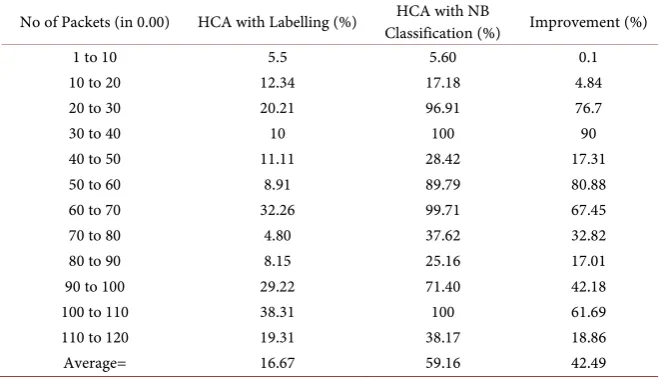
Table 4 here shows the improvement in Detection Rate with HCA Clustering with NB Classification in DARPA 2000 dataset where we can see the average improvement of 42.49% with highest improvement of 90% and lowest as 0.1%.
Table 5 here shows the reduction in False Positive Rate with HCA Clustering with NB Classification in UCSD DDoS attack 2007 dataset where we can see the average reduction of 1.22% with highest reduction of 2.6% and lowest as 0.04%.
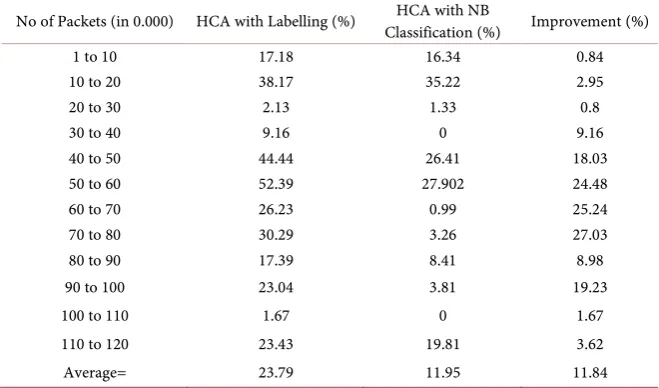
Table 6 here shows the reduction in False Positive Rate with HCA Clustering with NB Classification in DARPA 2000 dataset where we can see the average re-duction of 11.84% with highest rere-duction of 27.03% and lowest as 0.8%.
Table 1. Comparison of accuracy in CAIDA UCSD DDoS attack 2007 dataset.
No of Packets (in 0.000) HCA with Labelling (%) Classification (%) HCA with NB Improvement (%)
1 to 10 94.7 99.63 4.93
10 to 20 88.18 99.54 11.36
20 to 30 94.63 99.39 4.76
30 to 40 94.5 99.99 5.49
40 to 50 84.24 98.50 14.26
50 to 60 94.42 98.19 3.77
60 to 70 73.96 99.78 25.82
70 to 80 97.87 99.98 2.11
80 to 90 96.26 100 3.74
90 to 100 93.39 99.47 6.08
100 to 110 91.46 99.56 8.1
110 to 120 91.92 99.44 7.52
DOI: 10.4236/jis.2018.91004 41 Journal of Information Security Table 2. Comparison of accuracy in DARPA 2000 dataset.
No of Packets (in 0.000) HCA with Labelling (%) Classification (%) Improvement (%) HCA with NB
1 to 10 82.99 83.79 0.8
10 to 20 62.5 67.04 4.54
20 to 30 69.15 98.82 29.67
30 to 40 90.15 100 9.85
40 to 50 55 75.67 20.67
50 to 60 41.14 58.72 17.58
60 to 70 69.01 89.41 20.4
70 to 80 69.86 96.80 26.94
80 to 90 81.77 91.74 9.97
90 to 100 78.96 96.52 17.56
100 to 110 95.33 100 4.67
110 to 120 73.21 82.34 9.13
[image:9.595.209.540.310.499.2]Average= 72.42 86.73 14.31
Table 3. Comparison of Detection Rate in CAIDA UCSD DDoS Attack 2007 Dataset.
No of Packets (in 0.000) HCA with Labelling (%) Classification (%) HCA with NB Improvement (%)
1 to 10 28.57 90.46 61.89
10 to 20 85.50 97.09 11.59
20 to 30 72.11 92.62 20.51
30 to 40 33.33 99.68 66.35
40 to 50 33.03 72.49 39.46
50 to 60 3.59 8.58 4.99
60 to 70 32.89 99.12 66.23
70 to 80 70.42 100 29.58
80 to 90 98.29 100 1.71
90 to 100 75.64 92.28 16.64
100 to 110 61.16 93.33 32.17
110 to 120 48.70 84.13 35.43
Average= 53.60 85.81 32.21
Table 4. Comparison of detection rate in DARPA 2000 dataset.
No of Packets (in 0.00) HCA with Labelling (%) Classification (%) HCA with NB Improvement (%)
1 to 10 5.5 5.60 0.1
10 to 20 12.34 17.18 4.84
20 to 30 20.21 96.91 76.7
30 to 40 10 100 90
40 to 50 11.11 28.42 17.31
50 to 60 8.91 89.79 80.88
60 to 70 32.26 99.71 67.45
70 to 80 4.80 37.62 32.82
80 to 90 8.15 25.16 17.01
90 to 100 29.22 71.40 42.18
100 to 110 38.31 100 61.69
110 to 120 19.31 38.17 18.86
[image:9.595.209.539.532.722.2]DOI: 10.4236/jis.2018.91004 42 Journal of Information Security Table 5. Comparison of false positive rate in CAIDA UCSD DDoS attack 2007.
No of Packets (in 0.000) HCA with Labelling (%) Classification (%) HCA with NB Improvement (%)
1 to 10 0.52 0.38 0.14
10 to 20 2.08 0.32 1.76
20 to 30 3.24 0.64 2.6
30 to 40 1.05 0.01 1.04
40 to 50 1.76 1.54 0.22
50 to 60 2.76 1.81 0.95
60 to 70 2.72 0.29 2.43
70 to 80 0.64 0 0.64
80 to 90 0.04 0 0.04
90 to 100 1.78 0.56 1.22
100 to 110 2.82 0.46 2.36
110 to 120 1.71 0.57 1.14
[image:10.595.209.539.310.504.2]Average= 1.76 0.54 1.22
Table 6. Comparison of false positive rate in DARPA 2000 dataset.
No of Packets (in 0.000) HCA with Labelling (%) Classification (%) HCA with NB Improvement (%)
1 to 10 17.18 16.34 0.84
10 to 20 38.17 35.22 2.95
20 to 30 2.13 1.33 0.8
30 to 40 9.16 0 9.16
40 to 50 44.44 26.41 18.03
50 to 60 52.39 27.902 24.48
60 to 70 26.23 0.99 25.24
70 to 80 30.29 3.26 27.03
80 to 90 17.39 8.41 8.98
90 to 100 23.04 3.81 19.23
100 to 110 1.67 0 1.67
110 to 120 23.43 19.81 3.62
Average= 23.79 11.95 11.84
Performance Analysis
From the above experiments and results, it is seen that the Accuracy and De-tection Rate has been improved with corresponding reduction in False Positive Rate. Therefore, the proposed algorithm has justified it’s intend of improving the results in terms of performance parameter of Heuristics algorithm alone.
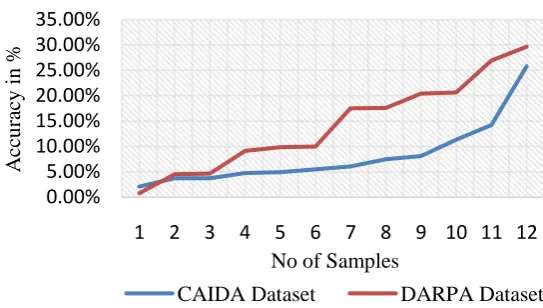
Figure 2 shows the improvement in Accuracy with HCA clustering followed by NB classification where we can see that the highest improvement is 25.82% and lowest improvement is 3.74% for CAIDA dataset. Whereas, the highest im-provement is 29.67% and the lowest imim-provement is 0.80% for DARPA dataset.
DOI: 10.4236/jis.2018.91004 43 Journal of Information Security
Figure 4 shows the improvement in False Positive Rate with HCA clustering followed by NB classification where we can see that the highest improvement is 2.60% and lowest improvement is 0.04% for CAIDA dataset. Whereas, the high-est improvement is 27.03% and the lowhigh-est improvement is 0.80% for DARPA dataset.
[image:11.595.234.504.374.509.2]Figure 2. Improvement in Accuracy with HCA Followed by NB Classification.
Figure 3. Improvement in Detection Rate with HCA Clustering followed by NB Classifi-cation.
Figure 4. Improvement in false positive rate with HCA clustering followed by NB classi-fication.
0.00%
5.00%
10.00%
15.00%
20.00%
25.00%
30.00%
35.00%
1 2 3 4 5 6 7 8 9 10 11 12
A
ccu
racy
i
n
%
No of Samples
Improvement in Accuracy with HCA Clustering
followed by NB Classification
CAIDA Dataset
DARPA Dataset
0.00% 50.00% 100.00%
1 2 3 4 5 6 7 8 9 10 11 12
D
et
ect
io
n
R
at
e i
n
%
No of Samples
Improvement in Detection Rate with HCA Clustering followed by NB Classification
CAIDA Dataset DARPA Dataset
0.00% 10.00% 20.00% 30.00%
1 2 3 4 5 6 7 8 9 10 11 12
F
als
e P
o
sitiv
e
R
ate
in
%
No of Samples
Improvement in False Positive Rate with HCA Clustering followed by NB Classification
[image:11.595.235.509.554.694.2]DOI: 10.4236/jis.2018.91004 44 Journal of Information Security
5. Conclusions and Future Works
From the above analysis we can infer that for both the datasets, Heuristic Clus-tering Algorithm followed by Naïve Bayes Classification results in better result in terms of higher Accuracy, higher Detection Rate and lower False Positive Rate in comparison to result obtained from Heuristic Clustering Algorithm with Label-ling.
In this work, we have performed all the experiments by taking a uniform sample size for both the datasets and 10% attack data is used collectively for the 12 data samples i.e. attack percentage is taken at random for 12 different data samples to reach the total 12 percentage margins. We have used Naïve Bayes Classification method that works very well for good data distributions but data distribution model varies from environment to environment for intrusion detec-tion system.
Therefore in future, this work can be extended as:
1) Data distribution can be changed i.e. both small size and large data size samples can be taken instead of equal size uniform samples for testing the result.
2) Equal percentage of attack data can be taken for each data samples.
3) Since, Naïve Bayes Classification works well only for good data distribution another classification technique like Support Vector Machine that works better for small sized samples as well can be taken into consideration for future work.
Acknowledgements
The authors would like to extend their gratitude to Department of Graduate Studies, Nepal College of Information Technology for its constant support and motivation. We would also like to thank the Journal of Information Security for its feedbacks and reviews.
References
[1] SANS Institute InfoSec Reading Room (2011) Denial of Service Attacks and Mitiga-tion Techniques: Real Time ImplementaMitiga-tion with Detailed Analysis. SANS Institute Reading Room Site.
[2] Sarmila, K. and Kavin, G. (2014) A Clustering Algorithm for Detecting DDoS At-tacks in Networks. International Journal of Recent Engineering Science, 1, ISSN: 2349-7157.
[3] Bhaya, W. and Manaa, M.E. (2014) Review Clustering Mechanisms of Distributed Denial of Service Attacks. Journal of Computer Science, 10, 2037-2046, ISSN: 1549-3636. https://doi.org/10.3844/jcssp.2014.2037.2046
[4] Shikha, A. and Jitendra, A. (2015) Survey on Anomaly Detection using Data Mining Techniques. 19th International Conference on Knowledge Based and Intelligent In-formation and Engineering Systems.
[5] Chitrakar, R. and Chuanhe, H. (2012) Anomaly Based Intrusion Detection Using Hybrid Learning Approach of Combining k-Medoids Clustering and Naïve Bayes Classification. Proceedings of 8th IEEE International Conference on Wireless Communications, Networking and Mobile Computing (WiCOM).