ORIGINAL RESEARCH
Diffusion Tensor Imaging of Commissural and
Projection White Matter in Tuberous Sclerosis
Complex and Correlation with Tuber Load
G. Simao C. Raybaud S. Chuang C. Go O.C. Snead E. Widjaja
BACKGROUND AND PURPOSE:Cortical and white matter changes have been identified outside the MR imaging–visible cortical/subcortical tubers in the tuberous sclerosis complex. The aim of this study was to evaluate DTI changes in the corpus callosum and internal capsules and to correlate the DTI changes with cortical/subcortical tuber load.
MATERIALS AND METHODS: Twelve TSC patients and 23 controls underwent MR imaging including DTI. FA, trace, D储, and DⲚof genu and splenium of corpus callosum and right and left internal capsules were assessed. The number and volume of cortical/subcortical tubers were correlated with DTI indices of corpus callosum and internal capsules.
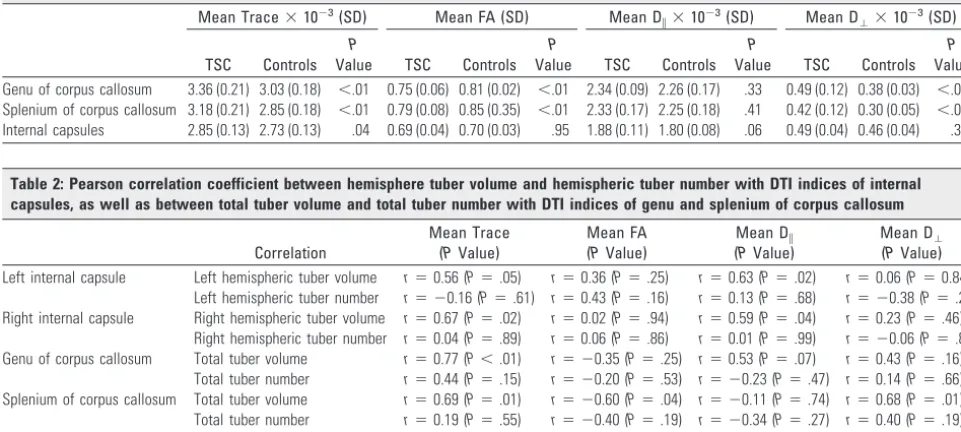
RESULTS: In the genu and splenium, FA was lower and trace (P⬍.01) and DⲚwere higher (P⬍.01), and in the internal capsules, trace was higher (P⫽.04) in TSC patients compared with controls. The total tuber volume correlated positively with trace of genu (r⫽0.77,P⬍.01) and splenium (r⫽0.69, P⫽.01) and with DⲚof splenium (r⫽0.68,P⫽.01), and negatively with FA of splenium (r⫽ ⫺0.60, P⫽.04) of corpus callosum. The left and right hemispheric tuber volume correlated positively with trace of left (r⫽0.56,P⫽.05) and right (r⫽0.67,P⫽.02) internal capsules.
CONCLUSIONS:Our findings of reduced FA, elevated trace, and elevated DⲚin the corpus callosum and internal capsules may be related to abnormalities in myelin. The correlations between tuber volume and DTI indices in corpus callosum and internal capsules suggested that more extensive malformation as demonstrated by larger tuber load was more likely to be associated with more severe DTI changes in the commissural and projection white matter.
ABBREVIATIONS:ADC⫽apparent diffusion coefficient; D储⫽axial diffusivity; D⬜⫽radial diffusivity; DTI⫽diffusion tensor imaging; DWI⫽diffusion-weighted imaging; FA⫽fractional anisotropy; FLAIR⫽fluid-attenuated inversion recovery; NAWM⫽ normal-appearing white matter; ROI⫽ region of interest; TSC⫽tuberous sclerosis complex
T
uberous sclerosis complex is an autosomal dominant dis-order, characterized by a variety of hamartomatous lesions in various organs, including the brain.1Two distinct mutated or deleted genes have been identified in patients with TSC, that is, 9q34 (TSC1) and 16q13 (TSC2), and are responsible for the disease.2,3The brain is the most frequently affected organ inTSC, and neurologic manifestations are a common cause of morbidity and mortality, including seizures, developmental delay, and neurobehavioral abnormalities, and are present in
⬎80% of TSC patients.1Four major neuroimaging and
neu-ropathologic findings are observed in TSC patients: sub-ependymal nodules, cortical tubers, subsub-ependymal giant cell astrocytomas, and white matter abnormalities. Besides the classic MR imaging findings, cortical and white matter changes have been identified outside the MR imaging–visible cortical/subcortical tubers on histology.4
DTI provides information on the microstructure of tissues and white matter tracts in vivo and therefore can be used to evaluate alterations in the microstructure of white matter in disease states, even when the white matter appears normal on structural imaging.5Previous reports on quantitative MR
im-aging methods by using DWI and DTI in cerebral TSC have mostly concentrated on cortical tubers and white matter le-sions.6-8Recently, abnormalities in the NAWM have been
re-ported by using DWI and DTI.9,10However, it is uncertain if
the changes in the NAWM are related to tuber load. Cortical tubers are a type of malformation of cortical development,11
and malformations affecting the cortex could affect the white matter as well.5,12The corpus callosum is the largest commis-sural tract connecting the 2 cerebral hemispheres. The internal capsules contain major white matter tracts projecting from different lobes of the cerebrum to the thalami, brain stem, and spinal cord.13Any lesions affecting the cortex and adjacent
subcortical white matter could potentially affect the distal commissural and projection white matter. We hypothesize that the abnormalities in the normal-appearing white matter of commissural and projection pathways such as the corpus callosum and internal capsules are related to the cortical/sub-cortical tuber load. The aim of this study was to evaluate the DTI changes in the corpus callosum and internal capsules and to correlate the DTI changes with cortical/subcortical tuber load.
Materials and Methods
Patients
The study protocol had the approval of our institutional research ethics board. The inclusion criteria for the study were children be-Received October 14, 2009; accepted after revision November 20.
From Diagnostic Imaging (G.S., C.R., S.C., E.W.), Division of Neurology (C.G., O.C.S.), Hospital for Sick Children, Toronto, Ontario, Canada.
Please address correspondence to Elysa Widjaja, Diagnostic Imaging, Hospital for Sick Children, Toronto, ON, M5G 1X8, Canada; e-mail: [email protected] DOI 10.3174/ajnr.A2033
PEDIATRICS
ORIGINAL
tween the ages of 4 and 18 years with established diagnosis of TSC according to clinical and imaging criteria.14Twelve patients (9 boys and 3 girls; mean age, 9.2 years; age range, 4.8 –16 years) underwent MR imaging including DTI between March 2008 to March 2009. All the patients had typical TSC findings in the brain, including cortical/ subcortical tubers, white matter abnormalities, and subependymal nodules. Eleven patients had seizures, 8 had developmental delay, 4 had autistic spectrum disorder, and 1 had attention deficit/hyperac-tivity disorder. Twenty-three control subjects (13 boys and 10 girls; mean age, 11.1 years; age range, 5–17 years) with normal MR imaging and no histories of neurologic disorders were included in the study.
MR Imaging
MR imaging was performed with a 3T magnet (Achieva; Phillips Medical System, Best, the Netherlands) and an 8-channel head coil. Imaging protocol consisted of a variety of sequences, including sagit-tal 3D T1-weighted sequence (TR/TE, 4.9/2.3 ms; section thickness, 1 mm; FOV, 22 cm; matrix, 220⫻220), axial and coronal T2-weighted images (TR/TE, 4200/80; section thickness, 3 mm; FOV, 22 cm; ma-trix, 400⫻272), and axial FLAIR (TR/TE, 10,000/140; section thick-ness, 3 mm; FOV, 22 cm; matrix, 316⫻290).
Diffusion Tensor Imaging
Axial DTI was performed on the same MR imaging by using single-shot diffusion-weighted echo-planar imaging in both patients and controls. The imaging parameters included 15 spatially isotropically arranged noncollinear directions, TR/TE of 11,000/55, section thick-ness of 2 mm, FOV of 22 cm, matrix of 112⫻112, and b-value of 1000 s/mm2and 0 s/mm2. Echo-planar image distortion was corrected au-tomatically on the scanner.
Data Analysis
FLAIR was used to identify and assess the cortical/subcortical tubers, as FLAIR has previously been shown to be sensitive at identifying tubers in TSC patients.15The number of cortical/subcortical tubers and their lobar distribution in the right and left cerebral hemispheres were assessed. The margins of the cortical/subcortical tubers were manually outlined on each section on the PACS system (GE Health-care, Milwaukee, Wisconsin) (Fig 1) by a neuroradiologist (G.S.). The volume of each cortical/subcortical tuber was calculated by multiply-ing the area of each of the tubers by the section thickness. The
hemi-spheric tuber volume was the sum of the volume of each tuber in 1 cerebral hemisphere. The total cerebral tuber volume was the sum of the volume of each tuber in both hemispheres.
DTI data processing was performed with DTIStudio (version 2.4; Johns Hopkins University, Baltimore, Maryland; http://www. mristudio.org). Diagonalization of the diffusion tensor yielded 6 in-dependent tensor elements, 3 eigenvalues (1,2, and3) and 3 eig-envectors, which provide 3D information about the diffusivity of wa-ter molecules per voxel that can be represented graphically by an ellipsoid.16From these data, the FA and trace maps were calculated. D储and D⬜, which were the average of2and3, were also evaluated. ROIs were carefully drawn to outline the genu and splenium of corpus callosum, and right and left internal capsules on the directionally color-coded map (Fig 2). The same ROIs were then transposed onto FA, trace, and eigenvalue maps.
Statistical Analysis
Data were analyzed by using SAS 9.1 (SAS Institute, Cary, North Carolina). The age of patients and controls was compared by using a
ttest. Generalized estimating equations were used to compare FA, trace, D储, and DⲚof the genu and splenium of corpus callosum, as well as internal capsules of the patients versus controls, after adjusting for age and side of measurements. The right and left hemispheric tuber volume and the number of cortical/subcortical tubers were correlated with FA, trace, D储, and DⲚof the right and left internal capsules, respectively, in patients with TSC by using the Pearson correlation coefficient. The total tuber volume and the total number of the cor-tical/subcortical tubers were also correlated with FA, trace, D储, and D⬜of the genu and splenium of corpus callosum by using the Pearson correlation coefficient. Due to the exploratory nature of this study, no correction for type I error was made, and statistical significance was set atP⬍.05.
Fig 1.Axial FLAIR showing outlines of the MR imaging–visible cortical/subcortical tubers,
which have been outlined manually to calculate the volume of the cortical/subcortical tubers.
Fig 2.Selected ROIs are carefully drawn over the fractional anisotropy color-encoded
[image:2.594.54.288.41.213.2] [image:2.594.302.536.43.320.2]Results
Patients
There was no significant difference between the age of TSC patients and controls (P⬎.05).
MR Imaging
There were 314 cortical/subcortical tubers assessed in the 12 patients, varying from 3 to 39 tubers in each patient (mean of 26 cortical/subcortical tubers per subject). The distribution of cortical/subcortical tubers was as follows: 144 in frontal lobes, 64 in parietal lobes, 42 in temporal lobes, 57 in occipital lobes, and 7 in insular cortex. The mean right hemispheric cortical/ subcortical tuber volume was 75.4⫾84.7 cm3and the mean
left hemispheric cortical/subcortical tuber volume was 66.3⫾ 63.4 cm3. The mean total cerebral cortical/subcortical tuber volume was 141.7⫾141.0 cm3. The mean number of cortical/
subcortical tubers in the right hemisphere was 13.0⫾6.2 and in the left hemisphere was 13.1⫾7.4.
Diffusion Tensor Imaging
Patients with TSC had significantly higher trace in the genu (P⬍.01) and splenium (P⬍.01) of corpus callosum, as well as in the internal capsules (P⫽.04), compared with controls (Table 1). FA was significantly lower in the genu (P⬍.01) and splenium (P⬍.01) of corpus callosum in TSC patients than in controls. D⬜was higher in the genu (P⬍.01) and splenium (P⬍.01) of corpus callosum in TSC patients compared with controls. There were no significant differences in D储 in the
genu and splenium of corpus callosum and internal capsules in TSC patients compared with controls (P⫽.33,P⫽.41, and
P⫽.06, respectively).
The total tuber volume correlated positively with trace of the genu (r⫽0.77,P⬍.01) and splenium (r⫽0.69,P⫽.01) of corpus callosum, and with D⬜of the splenium of corpus callosum (r⫽0.68,P⫽.01) (Table 2). The total tuber volume correlated negatively with FA of the splenium of corpus callo-sum (r⫽ ⫺0.60,P⫽.04). There was a tendency for left hemi-spheric tuber volume to correlate positively with trace (r⫽
0.56,P⫽.05) of the left internal capsule. There was significant positive correlation between left hemispheric tuber volume and D储(r⫽0.63,P⫽.02) of the left internal capsule. The right hemispheric tuber volume correlated positively with the trace (r⫽0.67,P⫽.02) and D储(r⫽0.59,P⫽.04) of the right internal capsule. There were no significant correlations be-tween total tuber number or hemispheric tuber number and trace, FA, DⲚ, and D储 of the genu and splenium of corpus
callosum or internal capsules, respectively.
Discussion
White matter abnormalities are a well-recognized finding on conventional MR imaging of TSC patients.17,18DWI and DTI
give additional, quantitative information about the micro-structure of the brain, in particular of the white matter, and they have been used to evaluate brain abnormalities in TSC patients. Several studies have found altered diffusion index in the cortical tubers and white matter lesions associated with TSC.4,6,7,19Piao et al7assessed 14 children and adults with TSC
and found reduced FA and increased ADC in the white matter lesions in patients with TSC. Karadag et al6evaluated 7
chil-dren with TSC and also found reduced FA and higher ADC values in the white matter lesions. Using diffusion-weighted MR imaging, Firat et al19found elevated ADC in white matter lesions in 6 children with TSC. The reduced FA and elevated ADC could be related to hypomyelination, gliosis, and heter-otopic cells,20which may lead to loss of structural barriers to
water motion.
In this study, we have found reduced FA, increased trace and DⲚin the NAWM in the genu and splenium of corpus
callosum, as well as increased trace in the internal capsule in children with TSC. Our findings of abnormal DTI indices in these areas of NAWM were similar to findings by other inves-tigators. Makki et al10 evaluated 6 children with TSC and
found significant increase in mean diffusivity, decrease in an-isotropy, and increase in DⲚthat was greater than the increase in D储in the NAWM of corpus callosum, internal capsules, and
[image:3.594.53.534.57.273.2]external capsules. Garaci et al21 evaluated 18 children and
Table 1: Mean trace, FA, D储, and D⬜of the genu and splenium of corpus callosum and internal capsules of patients with TSC and controls
Mean Trace⫻10⫺3(SD) Mean FA (SD) Mean D
储⫻10⫺3(SD) Mean D⬜⫻10⫺3(SD)
TSC Controls
P
Value TSC Controls
P
Value TSC Controls
P
Value TSC Controls
P
[image:3.594.51.534.166.270.2]Value Genu of corpus callosum 3.36 (0.21) 3.03 (0.18) ⬍.01 0.75 (0.06) 0.81 (0.02) ⬍.01 2.34 (0.09) 2.26 (0.17) .33 0.49 (0.12) 0.38 (0.03) ⬍.01 Splenium of corpus callosum 3.18 (0.21) 2.85 (0.18) ⬍.01 0.79 (0.08) 0.85 (0.35) ⬍.01 2.33 (0.17) 2.25 (0.18) .41 0.42 (0.12) 0.30 (0.05) ⬍.01 Internal capsules 2.85 (0.13) 2.73 (0.13) .04 0.69 (0.04) 0.70 (0.03) .95 1.88 (0.11) 1.80 (0.08) .06 0.49 (0.04) 0.46 (0.04) .35
Table 2: Pearson correlation coefficient between hemisphere tuber volume and hemispheric tuber number with DTI indices of internal capsules, as well as between total tuber volume and total tuber number with DTI indices of genu and splenium of corpus callosum
Correlation
Mean Trace (PValue)
Mean FA (PValue)
Mean D储 (PValue)
Mean D⬜ (PValue) Left internal capsule Left hemispheric tuber volume r⫽0.56 (P⫽.05) r⫽0.36 (P⫽.25) r⫽0.63 (P⫽.02) r⫽0.06 (P⫽0.84)
Left hemispheric tuber number r⫽ ⫺0.16 (P⫽.61) r⫽0.43 (P⫽.16) r⫽0.13 (P⫽.68) r⫽ ⫺0.38 (P⫽.22) Right internal capsule Right hemispheric tuber volume r⫽0.67 (P⫽.02) r⫽0.02 (P⫽.94) r⫽0.59 (P⫽.04) r⫽0.23 (P⫽.46)
Right hemispheric tuber number r⫽0.04 (P⫽.89) r⫽0.06 (P⫽.86) r⫽0.01 (P⫽.99) r⫽ ⫺0.06 (P⫽.84) Genu of corpus callosum Total tuber volume r⫽0.77 (P⬍.01) r⫽ ⫺0.35 (P⫽.25) r⫽0.53 (P⫽.07) r⫽0.43 (P⫽.16)
adults with TSC by using DWI, and they found increased ADC in the supratentorial NAWM, specifically in the occipital white matter, frontal white matter, centrum semiovale, pari-etal white matter, and corona radiata. Using DWI, Arulrajah et al9also found increased ADC in the NAWM within the
fron-tal, pariefron-tal, and occipital lobes and pons in 23 children and adults with TSC.
We have found increased DⲚin the NAWM in the genu and splenium of corpus callosum. Animal models with absent my-elin have demonstrated an increase in DⲚ,22suggesting that
changes in DⲚcould potentially be used to differentiate myelin loss from axonal injury, which was associated with elevated D储.
Diffuse hypomyelination of the cerebral white matter was thought to occur in TSC patients.9,10,23The white matter
mi-crostructural changes in NAWM in TSC patients may be re-lated to an abnormal myelin packing due to giant cells, gliosis, and myelination defects.10Using ex vivo postmortem MR
im-aging and neuropathologic examination, Boer et al24reported
that all areas of T2 high signal intensity on MR imaging were found to correspond with areas of demyelination. However, the areas of reduced myelin attenuation appeared to be more extensive on histologic examination compared with the MR imaging visible abnormality.
In this study, there was a positive correlation between trace in the genu and splenium of corpus callosum and total corti-cal/subcortical tuber volume, as well as between trace in the internal capsules and hemispheric cortical/subcortical tuber volume. Peng et al23observed a negative correlation between D储in the superior longitudinal fasciculus and the number of tubers in the frontal and parietal lobes. Any malformation that traversed the cerebral mantle could disrupt the white matter tracts.12Corpus callosum is the major commissural tract in the brain connecting the right and left cerebral hemispheres, and the internal capsules contain projection tracts connecting the cerebrum to the thalamus, brain stem, and spinal cord.13
Mal-formations in the cortical/subcortical tubers may exert sec-ondary changes in the commissural and projection white mat-ter tracts projecting to/from these lesions, and therefore account for the significant correlation between trace in the corpus callosum and internal capsules with cortical/subcorti-cal tuber volume. Previously, we have investigated children with malformations of cortical development and found ab-normal white matter tracts projecting to/from malformations of cortical development,5,12even when the deep white matter
demonstrated normal signal intensity on structural MR imag-ing. Similarly, Lee et al25 also found abnormal association
white matter tracts projecting to/from focal cortical dysplasia. There were greater correlations between FA and DⲚof the splenium of corpus callosum with total cortical/subcortical tuber volume compared with FA and DⲚof the genu of corpus callosum with total cortical/subcortical tuber volume. The genu of corpus callosum contains white matter tracts from the prefrontal and premotor area,26,27and the splenium of corpus
callosum contains white matter tracts from the parietal, tem-poral, and occipital lobes.27The total number of
cortical/sub-cortical tubers in the parietal, temporal, and occipital lobes combined was greater than the total number of tubers in the frontal lobes. The greater correlations between FA and DⲚof
the splenium of corpus callosum with cortical/subcortical
tu-ber volume could be related to the greater tutu-ber load within the parietal, temporal, and occipital lobes combined.
Ridler et al28found a significant reduction in the white
matter volume involving the longitudinal fasciculi and other major intrahemispheric tracts of 10 patients with TSC com-pared with controls. However, they did not find a correlation between white matter volume and number of cortical/subcor-tical tubers. We have also not found a significant correlation between tuber number and DTI indices of NAWM in the cor-pus callosum and internal capsules, suggesting that tuber number was a less sensitive indicator of tuber load than tuber volume. We have assessed the white matter by using DTI, as DTI indices were a more sensitive marker of abnormal micro-structure of the white matter compared with white matter volume.
One of the potential weaknesses of our study was that we have used the MR imaging–visible lesion to define the cortical/ subcortical tuber volume. The histologic abnormalities of cor-tical/subcortical tubers frequently extend beyond the MR im-aging–visible lesion. By using the abnormal signal intensity on MR imaging to define the margin of the cortical/subcortical tuber, we may have underestimated the volume of the cortical/ subcortical tuber. The relationship of abnormal DTI indices in NAWM with neurocognitive performance or autism is not clear at present; future studies are required to elucidate this relationship. At present it is not known if these white matter changes are reversible. Novel therapeutic agents such as rapa-mycin have been reported to improve cognitive performance and reduce seizure frequency in patients with TSC.29,30 Fur-ther studies are necessary to determine if such Fur-therapeutic agents could affect cortical/subcortical tuber load and reduce or reverse the changes in NAWM.
Conclusions
This study showed reduced FA, elevated trace, and elevated DⲚ
in the genu and splenium of corpus callosum and internal capsules. These findings may be related to abnormalities in myelin. There was a positive correlation between total cortical/ subcortical tuber volume and trace of the genu and splenium of corpus callosum, as well as hemispheric cortical/subcortical tuber volume and trace of the internal capsules. Malforma-tions within the cortical/subcortical tubers could result in mi-crostructural changes in the commissural and projection white matter tracts connecting to/from the abnormal cortex, with larger tuber load demonstrating more severe changes in the distal white matter.
References
1. Crino PB, Nathanson KL, Henske EP.The tuberous sclerosis complex. N Engl J Med2006;355:1345–56
2. European Chromosome 16 Tuberous Sclerosis Consortium.Identification and characterization of the tuberous sclerosis gene on chromosome 16.Cell
1993;75:1305–15
3. van Slegtenhorst M, de Hoogt R, Hermans C, et al.Identification of the tuber-ous sclerosis gene TSC1 on chromosome 9q34.Science1997;277:805– 08 4. Chandra PS, Salamon N, Huang J, et al.FDG-PET/MRI coregistration and
diffusion-tensor imaging distinguish epileptogenic tubers and cortex in pa-tients with tuberous sclerosis complex: a preliminary report.Epilepsia
2006;47:1543– 49
6. Karadag D, Mentzel HJ, Gullmar D, et al.Diffusion tensor imaging in children and adolescents with tuberous sclerosis.Pediatr Radiol2005;35:980 – 83 7. Piao C, Yu A, Li K, et al.Cerebral diffusion tensor imaging in tuberous
scle-rosis.Eur J Radiol2009;71:249 –52
8. Sener RN.Tuberous sclerosis: diffusion MRI findings in the brain. Eur Radiol
2002;12:138 – 43
9. Arulrajah S, Ertan G, Jordan L, et al.Magnetic resonance imaging and diffu-sion-weighted imaging of normal-appearing white matter in children and young adults with tuberous sclerosis complex.Neuroradiology2009;51:781– 86 10. Makki MI, Chugani DC, Janisse J, et al.Characteristics of abnormal diffusivity in normal-appearing white matter investigated with diffusion tensor MR im-aging in tuberous sclerosis complex.AJNR Am J Neuroradiol2007;28:1662– 67 11. Barkovich AJ, Kuzniecky RI, Jackson GD, et al.A developmental and genetic classification for malformations of cortical development. Neurology
2005;65:1873– 87
12. Widjaja E, Blaser S, Miller E, et al.Evaluation of subcortical white matter and deep white matter tracts in malformations of cortical development.Epilepsia
2007;48:1460 – 69
13. Wakana S, Jiang H, Nagae-Poetscher LM, et al.Fiber tract-based atlas of human white matter anatomy. Radiology2004;230:77– 87
14. Roach ES, Gomez MR, Northrup H.Tuberous Sclerosis Complex Consensus Conference: revised clinical diagnostic criteria.J Child Neurol1998;13:624 –28 15. Takanashi J, Sugita K, Fujii K, et al.MR evaluation of tuberous sclerosis: in-creased sensitivity with fluid-attenuated inversion recovery and relation to severity of seizures and mental retardation. AJNR Am J Neuroradiol
1995;16:1923–28
16. Pierpaoli C, Jezzard P, Basser PJ, et al.Diffusion tensor MR imaging of the human brain. Radiology1996;201:637– 48
17. Braffman BH, Bilaniuk LT, Naidich TP, et al.MR imaging of tuberous sclerosis: pathogenesis of this phakomatosis, use of gadopentetate dimeglumine, and literature review.Radiology1992;183:227–38
18. Griffiths PD, Bolton P, Verity C.White matter abnormalities in tuberous scle-rosis complex. Acta Radiol1998;39:482– 86
19. Firat AK, Karakas HM, Erdem G, et al.Diffusion weighted MR findings of brain involvement in tuberous sclerosis.Diagn Interv Radiol2006;12:57– 60 20. Yagishita A, Arai N.Cortical tubers without other stigmata of tuberous
sclerosis: imaging and pathological findings.Neuroradiology1999;41:428 –32 21. Garaci FG, Floris R, Bozzao A, et al.Increased brain apparent diffusion
coeffi-cient in tuberous sclerosis.Radiology2004;232:461– 65
22. Song SK, Sun SW, Ramsbottom MJ, et al.Dysmyelination revealed through MRI as increased radial (but unchanged axial) diffusion of water.Neuroimage
2002;17:1429 –36
23. Peng SS, Lee WT, Wang YH, et al.Cerebral diffusion tensor images in children with tuberous sclerosis: a preliminary report.Pediatr Radiol2004;34:387–92 24. Boer K, Troost D, Jansen F, et al.Clinicopathological and
immunohistochem-ical findings in an autopsy case of tuberous sclerosis complex.Neuropathology
2008;28:577–90
25. Lee SK, Kim DI, Mori S, et al.Diffusion tensor MRI visualizes decreased subcor-tical fiber connectivity in focal corsubcor-tical dysplasia.Neuroimage2004;22:1826 –29 26. Witelson SF.Hand and sex differences in the isthmus and genu of the human
corpus callosum: a postmortem morphological study.Brain1989;112:799 – 835 27. Hofer S, Frahm J.Topography of the human corpus callosum revisited:
com-prehensive fiber tractography using diffusion tensor magnetic resonance im-aging.Neuroimage2006;32:989 –94
28. Ridler K, Bullmore ET, De Vries PJ, et al.Widespread anatomical abnormali-ties of grey and white matter structure in tuberous sclerosis.Psychol Med
2001;31:1437– 46
29. Wong M.Mammalian target of rapamycin (mTOR) inhibition as a potential antiepileptogenic therapy: from tuberous sclerosis to common acquired epi-lepsies.Epilepsia2009;51:27–36