PEAK
SHIFT
AND
INHIBITORY
STIMULUS
CONTROL
A thesis preseated to the Department of Psychology, University of Canterbury
In fulfilment of the requirements for the Degree of Doctor of Philosophy
by
Jacqueline Horn
; 3(0
,H'6! ;
I
q
~O ACKNOWLEDGEMENTSSeveral people gave much help in the production of this thesis. In particular, the support and
adv.ice of my supervisors, Mr N. M. Blampied and Mr J. S. Pollard, is gratefully acknowledged.
Mr Blampied's persistence, guidance and assistance at all stages of the endeavour was invaluable in enabling i t to reach fruition. Thanks are due to
Dr R. G. Paddick for his support; and also to the
.
technical staff of the Department of Psychology,
CHAPTER
I.
CONTENTS
PAGE
ABSTRACT 1
INTRODUCTION 2
2 1. Stimulus control
(i) Positive behavioural
contrast 8
(ii) Spence's gradient
interaction theory 14
(iii) ak shift 15
(iv) Inhibitory dimensional
stimulus control 16
(v) Behavioural contrast, peak shift, and inhibitory
stimulus control 17
(vi) Hearst, Besley and
Farthing (1970) 17
2. The current series of experiments 19 (i) Signalled reinforcement
19
(ii) The line orientation
dimension 22
II. GENERAL METHOD 23
1. Subjects 23
2. Apparatus 23
3.
Procedure 24(i) Preliminary training 25
(ii) Baseline training 26
(iii) Baseline generalization
test 27
(iv) Discrimination training 28 (v) Post-discrimination
training generalization
test in extinction 28
4. Discussion of General Method 29
III. EXPERIMENT 1 39
1 • Aim 39
2. Method 39
(i) Subjects 39
(ii) Proced ure 39
a. Baseline training 39
b. Pre-discrimination
training generalization
test 39
c. Di scri mina ti on training... 39
d. Post-discrimination training generalization
test 41
IV.
V.
(ii) Generalization testing 44
4.
Discussion48
EXPERIMENT 2 51
51 51
51
51
51 1. Aim
2. Method
(i) Subjects (ii) Procedure
a. Baseline training b. Pre-discrimination
training general-ization test , ••
c. Discrimination 52
training 52
d. Post-discrimination training
general-ization test .•. 52
3. Results 52
(i) Baseline and discrimination
e training 52
(ii) Generalization testing
57
4.
Discussion61
EXPERIMENT
3
66
66
66
1. Aim (i) (ii)
Interdimensional training Types of generalizatiion tests
2. Method
68
71
71
71
71
71
(i) Subjects ( i i ) Procedure
a. Preliminary training b. Baseline training ... c. Pre-discrimination
training general-ization test .••
d. Discrimination 72
training 72
e. Post-discrimination training
general-ization test ••. 72 f. Discrimination training
(Part II) 72
g. Combined cues
general-ization tests 72
h. Discrimination training
(Part III)
73
i. Resistance-to-reinforce-ment generalization
tests
73
j. Discrimination training...
75
k. Second generalizationtest in extinction
75
VI.
VII.
(ii) (iii) (iv)
Baseline and discrimination training (Part I)
Generali za ti on te sting ..• Combined cues general-ization tests
Resistance-to-reinforce-ment tests
(v) Discrimination training (Part IV)
(vi) Second generalization test in extinction 4. Discussion
(i) Discrimination training (ii) Generalization testing (iii) Combined cues test
(iv) Resistance-to-reinforce-ment tests
EXPERIMENT
4
1 . Aim2. Method
(i) Subjects (ii) Procedure
a. Preliminary training b. BaSeline training c. Pre-discrimination
training general-ization test ... d. Discrimination
training
e. Post-discrimination training general-ization test . . . f. Discrimination
76 76 76
84
89
94
94
94
98
100 101 107 107 107 107 108 108 108 108 109 109 training (Part II) 112 g.Resistance-to-reinforce-ment tests 112
3. Results 112
(i) Baseline and discrimination
training 112
(ii) Generalization tests in extinction
(iii) Discrimination training (Part II)
(iv)
Resistance-to-reinforce-116 119 ment generalization tests 122
4. Di scussi on 125
(i) Generalization tests in
extinction 125
(ii) Resistance-to-reinforcement
tests 129
EXPERIMENT 5 1 . Aim
2. Method
(i) Subjects (ii) Procedure
VIII.
IX.
c. Pre-discrimination training general-ization test ... d. Discrimination
training
e. Post-discrimination training general-ization tests f. Discrimination
132 133
133 training (Part II)... 133 g.
Resistance-to-reinforce-ment tests 136
3. Results 136
(i) Baseline and discrimination
training 136
(ii) Generalization tests in
extinction 140
(iii) Resistance-to-reinforcement
generalization tests 143
4. Discussion 143
(i) Discrimination training 143 (ii) Generalization tests in
extinction 149
(iii) Resistance-to-reinforcement
tests 150
EXPERIMENT 6 153
1. Aim 153
2. Method 155
(i) Subjects 155
(ii) Procedure 155
a. Preliminary training 155 b. Discrimination training . . . 155 c. Generalization tests
in extinction
d. Resistance-to-reinforce-ment generalization
156
tests 156
3. Results 156
(i) Discrimination training 156 (ii) Generalization tests in
extinction
(iii) Resistance-to-reinforce-ment generalization tests
4. Discussion
(i) Discrimination training (ii) Generalization test in
extinction
(iii) Generalization test in presence of house light (iv)
FIGURE
3.1
3.2
4 • 1
4.2
5 • 1
5.2
5.3
5.4.1
5.4.2
5.5.1
LIST OF FIGURES
Experiment 1: Normalised response rates of each subject in each component on successive days of discrimination
PAGE
tra~ning. 42
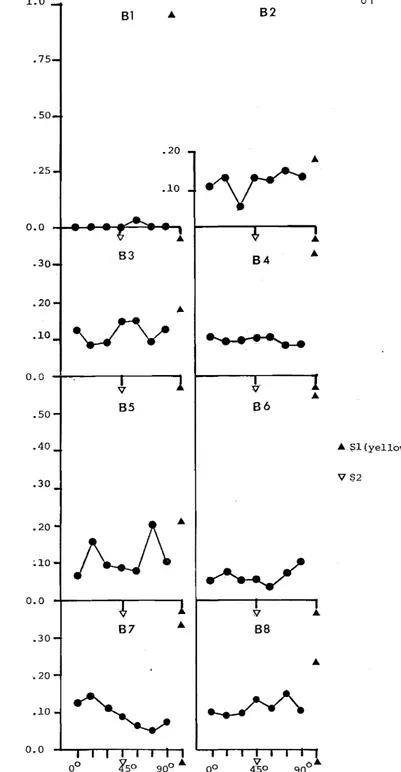
Experiment 1: Pre- and post-discrim-ination training generalization gradients along the line orientation dimension
expressed as relative response rates for
all subjects. 46
Experiment 2: Normalised response rates of each subject in each component on
successive days of discrimination trainig. 55 Experiment 2: Pre- and
post-discrim-ination training generalization gradients
along the flicker rate dimension. 59 Experiment
3:
Response rates of allsubjects. to Sl and S2 during discrimin~
ation training (Part I). 77
Experiment
3:
Relative response ra s during the post-discrimination training generalization test in extinction along theoline orientation dimension around S2(45 black line on white background),
including responses to S1 (yellow key). 80 Experiment
3:
Combined cuesgeneral-ization tests: relative response rates of each subject on two combined-cues tests along the line orientation dimension:
(a) with a yellow background,
(b) with a green background. 82 Experiment
3:
Resistance-to-reinforce-ment neralization tests: grouped relative response rates of subjects Bl
to B4 over nine successive days' training. 85 Experiment
3:
Resistance-to-reinforce-ment generalization tests; grouped relative response rates of subjects B5
to B8 over nine successive days' training. 87 Experiment
3:
Discrimination training(Part IV): individual response rates in both, components during mult VI-60sec VI-60sec(SIG) with oS1 as-a-blank white key and S2 as a 45 black line on a
5.6
both during mult VI-60sec EXT withoS1 as a blank whi e y and S2 as a 45 black line on a white background. Experiment 3: Relative response rates of all subjects during second generaliz-ation test in extinction along the line orientation dimension using a finer grain of analysis.
6.1 Experiment 4: Normalised response rates
92
96
for all subjects during mult VI~60sec EXT. 114 6.2 6.3 6.4 6.5
6.6
6.7Experiment 4: Generalization tests in extinction: relative response rates of
subjects C2, C4, C6 and C7 along the line orientation dimension both be forb and after mult VI-60sec EXT with a 45 white line on a black background as S1 and a blank key as S2.
Experiment 4: Generalization tests in extinction; re tive response rates of
subjects C2, C4, C6 and C7 along the brightness di~ension after mult VI-60sec EXT with a 45 white line on a black background as S1 and.a blank key of 70 lux as S2.
Experiment 4: Generalization tests in extinc on: relative response rates of subjects Cl, C3, C5 and C8 along the line orientation dimension before and after It VI-60seg EXT with a blank key as and a 45 white line on a black background as S2.
periment 4: Relative response rates of subjects C1, C3, C5 and C8 during the post-discrimination training generaliz-a on test in extinction along the brightness dimension following mult VI-60sec EXT wbth a blank key of 70 lux as S1 and a 45 white line on a black background as S2.
Experiment 4: Grouped relative response rates of subjects C1, C3, C5 and c8
during four sessions of re stance-to-reinforcement generalization testi along the line orientation dimen on. Experiment 4: Grouped relative response rates of subjects C2, C4, c6 and C7
during four sessions of resistance-to-reinforcement generalization sting along the brightness dimension.
7.1. Experiment 5: Normalised response rates to S1 and S2 during It VI-60sec VI-60sec
(SIG).
13B
7.2 Experiment 5: Relative response rates of subjects D2, D3, D4 and D6 along the line orientation dimension around S1
during both pre- and post-discrimination training generalization tests in
extinction. 141
7.3 Ex riment 5: Relative response rates of subjects D1, D5, D7 and
DB
along the line orientation dimension around S2 during both pre- and post-discrimination training generalization tests inextinction. 142
7.4 Experiment 5: Relative response rates of subjects D1, D5, D7 and DB along the brightness dimension during post-discrimination training generalization
test in extinction. 144
7.5 Experiment 5: Relative response rates of subjects D2, D3, D4 and D6 along the brightness dimension around S2 during post-discrimination training
general-ization test in extinction. 145 7 • 6 Experi ment .5: Grouped re ti ve re sponse
rates of subjects D1, D5, D7 and
DB
along I orientation dimension during four sessions ofresistance-to-reinforce-ment generalization testing. 146 7.7 Experiment 5: Grouped re tive
response rates of subjects D2, D3, D4 and D6 along the line orientation dimension during three sessions of resistance-to-reinforcement
general-ization testing. 147
B.1
Experiment 6: Responses per minute of all subjects during discrimination training, which was mult VI-60sec EXT for all subjects E1 to E4, and mult VI-60sec VI-60sec(SIG) for sub ec sE5 to EB. 159
B.2.1
Experiment 6: Relative response rates of subjects E1, E2, E3 and E4 around S2 along the line orientation8.3. 1
8.3.2
8.4
8.5
S2 along the line orientation dimension
after mult VI-60sec VI-60sec(SIG). 162 Experiment 6: Relative response
rates of subjects E1 to E4 during generalization test in extinction along line orientation dimension
in presence of houselight. 63 Experiment 6: Relative response rates
of subjects E5 to E8 during general-ization test in extinction along line orientation dimension in presence of
houselight. 164
Experiment 6: Grouped relative
response rates of subjects E1 to E4 during six sessions of resistance-to-reinforce-ment generalization testing along the
line orientation dimension around S2. 167 periment 6: Grouped relative response
rates of subjects to E8 during six ses ons of resistance-to-reinforcement generalization testing along the line
TABLE
3. 1
3.2
4 • 1
LIST OF TABLES
Experiment 1: Stimuli and reinforcement in effect during discrimination training. Experiment 1: Discrimination indices for the final six sessions of baseline and discrimination training.
Experiment 2: The rates of flicker used as stimuli.
4.2 Experiment 2: Stimuli and reinforcement schedules in effect during discrimination training.
4.3
5. 1
5.2
5.3
6. 1
6.2
6.3
Experiment 2: Discrimination indices for all subjects for the final six
sessions of baseline and discrimination training.
Experiment
3:
Combined cues procedure: order of generalization testing using either S1 (i.e. a yellow background)or a novel stimulus (i.e. a green background) superimposed on the test stimuli.
Experiment
3:
Discrimination indices for all subjects for the final six sessions of discrimination training (Part I).Experiment
3:
Discrimination indices for all subjects for the final six sessions of discrimination training (Part IV).Experiment
4:
Stimuli associated with each component of the mult VI-60sec EXT schedule during discrimination training. Experiment 4: Stimuli presented during brightness dimension generalization testing.Experiment 4: Discrimination indices for all subjects for the final six
7.2
7.3
8.
1VI-60sec(SIG) schedule during discrimination training.
Experiment
5:
Stimuli presented during generalization testing along thebrightness dimension.
Experiment 5 : Discrimination indices for the final six sessions of baseline and discrimination training.
Experiment 6: Discrimination indices for the final six sessions of discrim-ination training.
134
135
137
1
ABSTRACT
Pigeons were exposed to discrimination training
procedures using one-key multiple schedules of reinforcement and to generalization testing along dimensions of the two training stimuli. In the first two experiments using intradimensional discrimination training, both extinction and signalled reinforcement suppressed key-peck rate in one component and produced positive behavioural contrast, but only the extinction~trained group showed peak shift.
Interdimensional training was used in the next four
experiments and again the effects of stimulus control were compared. Both procedures resulted in excitatory dimensional stimulus control around the stimulus associated with the
unchanged component but only the extinction procedure
resulted in inhibitory dimensional stimulus control around the conditioned inhibitory stimulus, during generalization testing in extinction. Dimensional stimulus control
was also investigated using two further types of
general-ization test, viz. combined-cue and resistance-to-reinforcement. However, these did not in general add anything to the
CHAPTER
INTRODUCTION
1. STIMULUS CONTROL
"Stimulus control refers to the extent to which the value of an antecedent stimulus determines the probability of occurrence of a conditioned response."
This definition of stimulus control given by
Terrace (1966a, p.271) describes an area of investigation in which much experimental and theoretical work has
been conducted, particularly in the last twenty years, in attempts to elucidate the factors influencing
changes in behaviour resulting from changes in the
stimulus conditions, within an operant learning paradigm. The area of study implied in stimulus control is the
discriminative function of a stimulus with respect to a response. The function of a discriminative
stimulus in an operant paradigm is to indicate to the organism whether or not reinforcement will follow a
in innumerable ways. Each stimulus, no matter how apparently simple, is made up of several elements. Each such element can be systematically changed while
3
all the other elements are held constant. The continuum along which this change is conducted is one of the
dimensions on which the s mulus lies. Because the stimulus is made up of several elements, it must lie concurrently at some point along several dimensions. The observed change in performance that occurs when the stimulus is changed along one, and only one, of the
dimensions on which it lies, gives a measure of dimensional stimulus control.
There are a number of different training procedures which all produce different response rates in the presence of the traini stimuli, thereby establishing stimulus control. These discrimination training procedures differ not only in the number and type of stimulus u but also in the way they are presented. In simultaneous discrimination training, the training stimuli are
present at the same time but at different loci. Usually these loci are alternated intermittently so that it is not the location of the stimuli that exerts control over responding. During successive discrimination training, however, only one of the training stimuli
Discrimination training refers to one or the other of the above procedures and usually only two training stimuli are used.
Discrimination training procedures can also be defined in terms of the relationship between the two training stimuli. Switalski, Lyons and Thomas (1966) distinguished between intra- and interdimensional training. Intradimensional training refers to the procedure used when the two stimuli are selected from the same dimension, and interdimensional training to
the situation where S1 and S2 are orthogonal with respect to the particular dimension under consideration. In
studies of stimulus control, much work has been done using multiple schedules as the discrimination training procedure. In two-component multiple schedules, one schedule is correlated with one of the training stimuli, and a second independent schedule is correlated with the other. Although the two components of a multiple schedule comprise independent reinforcement schedules and separate exteroceptive stimuli, the performance of the subject in one of these components is not the same as it would be if training involved that same schedule and stimulus alone. There are interactions between the behaviours controlled by each component. One such
interaction that occurs in successive discrimination training is positive behavioural contrast, first
5
It is of interest in the context of stimulus control
because it is counterintuitive: the subject works harder, i.e. responds at a higher rate, for the same amount of reinforcement as i t had received prior to discrimination training. It is an instance where the effect of a
manipulation on one behaviour is not independent from the other.
Definitions of contrast effects usually refer to the change in response rates in both components of a multiple schedule following a change in one of the two schedules. If the response rate in the unchanged component increases and the rate in the changed component decreases, this is called positive behavioural contrast. The opposite occurrence, i.e. a decreased response rate in the unchanged component and an increased response rate in the changed component, is called negative
behavioural contrast. Positive induction refers to an increase in response rate in both components, and negative induction to a decrease in both (Skinner, 1938).
However, more recently the terms "positive contrast" or "positive behavioural contrast" have been used when referring to the response rate in the unchanged
component only. Bloomfield (1969) thus refers to positive behavioural contrast if there is an increase in the rate of reinforced responding during one component when the consequence of responding in another component is changed from reinforcement to extinction. Negative contrast and both positive and negative induction could also be similarly defined in terms of response rate
was not altered. The advantage of defining such effects solely in terms of the response rate in the unchanged component, without reference to response rate changes in the other components, is that it acknowledges interactions between the components yet enables these to be investigated independently. Using Bloomfield's approach, if positive behavioural contrast is said to have occurred, this implies that the changed component has affected responding in the unchanged
component. It does not imply the reverse, that the unchanged component has affected the response ra in the changed component. Nor does the occurrence, or rather, labelling of a contrast effect, depend upon the occurrence or magnitude of response rate changes in the d component. Following discrimination training to some criterion of stimulus control, a generalization test can be conducted for evidence of dimensional stimulus control. Generalization gradients have n plotted along many stimulus dimensions, following
Pavlov's (1927) demonstration that the effectiveness of a new stimulus in eliciting a conditioned response was less the further away this stimulus was from the original conditioned stimulus, along some dimension of those
stimuli.
7
generalization gradient reflects the interaction
between the two training stimuli. After interdimensional training, neralization gradients can be obtained
which show dimensional stimulus control around one of the training stimuli, independently of the dimensional control around the other. The methods of generalization testing will be discussed later.
When the post-discrimination training generalization test is conducted along some dimension common to both traini stimuli, then that discrimination training
was intradimensional with respect to the test dimension. In conventional discrimina on learning terminology, these discriminative stimuli associated with each component
of the multiple schedule are usually referred as S+, the positive stimulus, and S-, the negative stimulus.
Usually, S+ refers to the stimulus of the unchanged component, and to the stimulus of the changed component. However, such terminology may not be appropriate when the stimuli involved are correlated with schedules or events other than reinforcement versus extinction. Therefore throughout this study, the terms S1 and S2 are used to replace S+ and
Following intradimensional training, the obtained generalization gradient often shows peak shift, i.e. the maximum response rate occurs in the presence of a stimulus displaced from S1 in a direction away from S2. The converse of this may also be observed, viz. the
displacement of the minimum rate of responding away from S2 in a direction opposite S1. This is often referred to as ne tive peak shift.
The following sections will deal in more detail with the phenomena related to stimulus control that
have been discussed so far. No attempt is made to provide comprehensive reviews here of the areas discussed, as
there are appropriate reviews already published which fulfil this purpose. Ins ad, the discussion is aimed at providing the context in which the current series of experiments is placed.
(i) Positive behavioural contrast
Reynold~(1961)procedure has provided a
paradigm adopted by later researchers investigating positive behavioural contrast. He first gave
nondifferential reinforcement in two components of a multiple schedule in a successive discrimination where responses in each component were reinforced on a variable interval of three minutes, i.e. a mult VI-3min VI-3min schedule. He then changed the schedule operating in one component to extinction, i.e. to mult VI-3min EXT. The response rate in the changed component decreased now that no
the unchanged component. This increase, i.e. positive behavioural contrast, is also observed when the initial baseline phase is not a multiple schedule with equal schedules in both components, but involves a single schedule. This is known as
ngle-stimulus training (Terrace, 1966b).
9
Contrast is a robust phenomenon that has been reported in several species, particularly pigeons
(e.g. Reynolds, 1961), but also in turtles (Pert and Gonzalez, 1974), rats (Guttman, Sutterer and Brush, 1975), humans (O'Brien, 1968; Nicholson and Gray, 1972), and gold sh (Pert and Gonzalez, 1974). It has also occurred not only when the schedule in the changed component is extinction (e.g. Reynolds,
1961), but also when this component is correlated with the differential reinforcement of low response rates (DRL) (e.g. oomfield, 1967; Terrace, 1968; Weisman, 1969); a lower variable-interval schedule (VI) (e.g. Thomas and Cameron, 1974); differential reinforcement of other behaviours (DRO) (e.g.
Reynolds and Catania, 1961; Weisman, 1970); delayed reinforcement (e.g. Keller, 1970; Richards, 1972; Wilkie, 1971; Wilkie, 1972); punished responding
(Brethower and Reynolds, 1972; Coates, 1972;
Terrace, 1978) and a reduced quality of reinforcement (Griffin and Cooper, 1971).
Much work has been reported On attempts at
that an animal emits a stable number of responses and that behavioural contrast keeps this constant. When the response rate decreases in one component, the subject must respond at a higher rate elsewhere (i.e. in the other component) in order to maintain a constant response output.
Another analysis is known as the "additivity theory", put forward by Gamzu and Schwartz (1973),
Keller (1974), and Ricci (1973), who propose that elicited pecking such as that which occurs during autoshaping (Williams and Williams,
1969),
accounts for the additional key pecks pigeons emit in the unchanged component during positive behaviouralcontras~ Keller developed the use of Catania's
(1973) "topographic tagging" technique, which
separates out two response classes that were
previously indistinguishable because they occurred to the same key, even though they were controlled by different variables. Keller separated elicited and operant key pecks by displacing the component stimuli away from the operant key, on to a second key. Operant key pecks were reinforced according to the schedule in effect during that particular component, but pecks to the second key were never reinforced. It was assumed that pecks to the first key reflected those controlled by the
response-reinforcer relation but pecks to the second key
1 1
positive behaviour contrast on ~he second key (called the signal key) but not in responding to the operant key. White and Thomas
(1979)
took this investigation further by looking at the dimensional stimulus control of responding to both keys. Using a generalization testing procedure that maintained higher rates of signal-key responding than would otherwise occur, they demonstrated reliabledimen onal stimulus control over signal-key pecking as well as over operant-key pecking. Peak shift also occurred for signal-key responding but not for operant-key responding.
The additivity theory of behavioural contrast does however appear limited to explanations of a speci c response (key-pecking) in a speci c species (pi ons). The results of Hemmes
(1973)
suggest that positive behavioural contrast does not always occur in multiple schedules but depends upon the nature of the operant response underinvestigation. While her pigeon subjects produced contrast using key pecking as the operant response, there was no evidence of any schedule interaction in the same subjects when they were required to press a treadle instead of pecking a key. Westbrook
(1973)
also used pigeons pressing a bar, and also reported a failure to demonstrate positive behaviouralcontrast. However, the occurrence of U-shaped
implied that the absence of contrast did not reflect an absence of inhibition. The results of Hemmes
and Westbrook suggest that the classical conditioning contingencies which strongly affect key pecking in pigeons and are the basis of the additivity account of contrast, do not extend to other response classes.
Reynolds (1961) proposed a kind of matching hypothesis, that the extent of positive contrast depended on the relative amounts of reinforcement in each component. However, ter work has contra-dicted this, e.g. Reynolds and Limpo (1968) using a multiple schedule where only low rates of responding were reinforced, i.e. a mult DRL DRL schedule.
Behavioural contrast occurred in the unchanged component but while the response rate decreased in the changed component, the reinforcement rate in that component actually increased.
Bloomfield (1969) and Premack (1969) proposed a "pre rencelf account of contrast, stating that positive behavioural contrast occurred when there
was a "change for the worse" in the changed component, and that what constituted such a c could be
shown in concurrent schedules, giving a measure of preference.
13
frequency or response suppression?" and sUited that the major problem in the interpretation of behavioural contrast studies is the confounding of response rate and reinforcement frequency in the changed component.
Terrace's formulation of behavioural contrast has had a major influence because he incorporated his analysis into a broader context and saw contrast as one of several manifestations of inhibition.
His theoretical basis developed out of Amsel's work on frustrative non-reward (e.g. Amsel 1958, 1962), and involved the assumption of an emotional state resulting from response suppression, leading to contrast and
to later generalization responding such as peak shift, which were indicative of inhibition. He evolved an errorless discrimination learning method which resulted in the emission of very few responses in the changed component, and postulated that
(ii) Spence's gradient interaction theory
Spence examined the role of differential responding in the development of stimulus control and developed a theory (Spence, 1937) to account for stimulus generalization, i.e. the empirical finding that stimuli other than one associated with
reinforcement of a response will also evoke that
response. His analysis was a development from Hull's earlier (1929) postulates about the "spread of habit strength". Spence's theory involved five assumptions summarised by Ril~ing (1977):
"1. Reinforcement of responding to a stimulus (S+) produces an excitatory tendency to respond to S+.
2. Excitation generalizes around S+.
3. Extinction of responding to a stimulus (S-) produces an inhibitory tendency opposite to the tendency associated with S+". 4. Inhibition generalizes around S-.
5. The predicted response to any test stimulus is obtained by subtracting the amount of inhibition to the stimulus from the amount of excitation to the stimulus."
(Rilling, in Honig and Staddon, eds, 1977, p.447) Operant procedures have been successfully applied to the analysis and isolation of the conditions
necessary for the establishment of stimulus control, providing a test of Spence's theory. The standard generalization testing procedure follows that of Guttman and Kalish (1956) who adapted a procedure devised by Skinner (1950, p.201). Following single-stimulus training, Guttman and Kalish's pigeons
were presented with eleven test stimuli of different wavelengths, and their response rates in the
15
original training stimulus. The further the test stimulus was from this training stimulus, the less responding it controlled. This evidence of dimen-sional stimulus control correlates with Spence's hypothesised gradients of excitation, and parallels Pavlov's (1921) earlier work using classically
conditioned responses.
This paradigm has been extended to the
analysis of gradients around two training stimuli simultaneously, following a multiple schedule discrimination training procedure.
(iii) Peak shift
Investigations of peak shift follow the
general procedure of Hanson (1959) who demonstrated its occurrence in pi ons tested along the wavelength dimension. An extensive review of the area by
Purtle (1973) shows it has also been reported along a variety of dimensions in several species, ranging from the octopus (Wells and Young, 1970) to humans (Nicholson and Gray, 1971).
Spence's (1937) postulates predict peak shift. According to his formulation, the obtained post-discrimination training generalization is a
consequence of the interaction of excitatory (inverted-D) gradients around S1 and inhibitory (D-shaped) gradients around S2. The summation of these tendencies around both stimuli predicts both positive and ne tive peak shift.
The occurrence of these hypothetical gradients around each stimulus needs to be ascertained
Guttman's (1959) procedure provides a measure of independent excitatory gradients around S1. A
comparable procedure has been developed as a direct measure of gradients around S2.
(iv) Inhibitory dimensional stimulus control The inhibitory equivalent of Guttman's procedure was reported by Jenkins and Harrison (1962) and Honig, Boneau, Burstein and nnypacker (1963). Jenkins (1965) suggested the label
"inhibitory" be assigned to the obtained U-shaped gradients around S2.
These gradients are obtained following the second type of discrimination training, viz. interdimensional training, in which the test
dimensions of S1 and S2 are psychologically indep-endent, thereby avoiding any of the interaction effects that occur during generalization testing after intradimensional training. Hearst (1969b) examined post-discrimination training, and the independent gradients obtained around S1 and
after interdimensional training. From any two of these three empirically derived gradients, the third could be predicted using Spence's gradient interaction theory. He found a "rather high" correspondence between these derived and actual gradients, thus providing support for Spence's
(v) Behavioural contrast, peak shift, and inhibitory stimulus control
Hearst (1969) is not alone in examining the relationship between peak shift and U-shaped gradients around S2. Thomas and Williams (1963) and Terrace (1966a) also suggest that peak shift is the result of the formation of an underlying
17
inhibitory gradient around S2, and Weisman (1969) and others have shown this to be so even when S2 is correlated with schedules other than extinction. Terrace (1966b) indicated the reverse of this using the errorless learning procedure and comparing this with the usual procedure of learning with errors. Not only had the errorless procedure failed to produce peak shift (Terrace 1966a) but i t also resulted in flat stimulus generalization gradients after interdimensional training (Terrace, 1966b).
Similarly, Terrace (1968) observed that
behavioural contrast was a necessary antecedent of peak shift and i t has also been described as a
necessary antecedent of inhibitory stimulus control after interdimensional training (Farthing and Hearst,
1968; Terrace, 1971; Weisman, 1969; Yarczower, 1970). (vi) Hearst, Besley and Farthing (1970)
The concept of inhibition has been frequently used to account for behavioural contrast, peak shift and U-shaped gradients around S2, despite the
of behaviour as a result of Skinner's (1938) criticism of its experimental basis and logical status. The important question is not whether inhibition is a physiological reality comparable with Pavlov's (1927) account implying waves of inhibition spreading across the cortex, but rather whether an inhibitory construct is essential for the prediction of behaviour. Skinner maintained it was nothing more than a reduction in excitation.
There are two main approaches: Terrace (1966a) defined inhibitory functions of stimuli in terms of their dimensional control over responding,
whereas Jenkins (1965) said it was the development of a response to S2 incompatible with the reinforced response. Hearst, Besley and Farthing's (1970)
monograph provided a much-needed resolution of this issue by delineating separa and distinct inhibitory processes that are empirically obtainable.
They defined an excitatory stimulus as one controlling a higher rate of responding than that which occurs in its absence, and an inhibitory stimulus as one that decreases the response rate
below what would occur in its absence. They distinguished these properties from those of excitatory and inhibitory dimensional control exerted by stimuli, where the
19
However, an incremental gradient on its own would not define that stimulus as inhibitory, but this must be demonstrated by an independent test (see Hearst, Besley and Farthing, 1970, p.p. 376-377). Their classification has been widely adopted in studies of stimulus control, as have the several
different types of generalization st they described, measuring different aspects of inhibitory stimulus control (see Rilling, 1977). A further discussion of these is ven in Experiment 3, Chapter V.
2. THE CURRENT SERIES OF EXPERIMENTS
While most studies on discrimination training have employed a mult VI EXT paradigm, S2 has also been
correlated with other schedules in the production of positive behavioural contrast, peak shift, or inhibitory dimensional stimulus control. The research reported here systematically compared stimulus control following two training procedures to see whether these two
procedures produced equivalent effects and also to see whether in fact the phenomena mentioned above did covary as predicted by Terrace (1966a).
The first of the two training procedures used was mult VI EXT, to provide comparability with the bulk of the stimulus control literature. The other training procedure involved the use of signalled reinforcement in the S2 component, a procedure which typically reduces response rates without altering the reinforcement density or interreinforcement interval.
(i) Signalled reinforcement
has been used in a variety of schedules. Brownstein and Newsom (1970) found it effectively reduced S2 responding in a fixed-interval (FI) schedule.
They obtained positive behavioural contrast during mult FI-2 FI-2(SIG). Contrast has also been reported following multiple schedules using variable interval reinforcement, by Baldock (1970), Baldock and
Blampied (1970), Brownstein and Hughes (1970), Lander (1971), Marcucella (1976) and Thompson and Corr (1974). Reynolds and Limpo (1968) obtained positive behavioural contrast in a mult DRL DRL
schedule where th~ unchanged component was associated with the reinforcement of interresponse times greater than 35sec (i.e. DRL 35-sec) and the other component included a clock indicating interresponse times. The use of the clock is a variation on signalled reinforcement, and contrast occurred even though there was a higher reinforcement rate in the changed component.
More complex schedules have also been used with signalled reinforcement. Blampied (1972) obtained positive behavioural contrast in the terminal link of a concurrent chains schedule. Others have reported the effect of this procedure on phenomena other than behavioural contrast. Bower, McLean and Meacham (1966) reported that choice was unaffected by signalling reinforcement availability in a concurrent chains schedule.
21
a preference for signalled reinforcement in terms of time spent in the presence of this condition although this preference was not matched by a higher response rate. They used a change-over key which may have accounted for the difference between their results and those of Bower et al (1966). Pliskoff and Green (1972) had also reported a preference for the key colour in the presence of which the reinforcer signal was operative, and Wilkie (1973) reported a failure to observe consistent preference for the
non-signalled component of a concurrent VI VI schedule, a finding which is also consistent with those of Lewis et al (1974) and Pliskoff and Green (1972).
Baldock and Blampied (1970) used
inter-dimensional training where S2 was three vertical black lines on a white background, and the signal, a 1000Hz tone. Generalization testing along the line orientation dimension did not reveal inhibitory gradients, whereas generalization testing along
this dimension in the presence of two tones produced excitatory gradients.
(ii) .The line orientation dimension
The line orientation dimension was used throughout these experiments, with the exception of Experiment 2. The use of this dimension in the investigation of stimulus control thereby provides comparability with the work of many others who have used i t in the context of either intra- or interdimensional discrimination. These researchers include Davis (1971), Farthing (1972), Farthing and Hearst (1968), Hanson (1959), Hearst (1968), Hearst, Koresko and Poppen (1964), Hearst, Taus and Koresko (1971), Hirota and Clarkson (1973), Honig, Boneau, Burstein and Pennypacker (1963), Malone and Staddon (1973), Nicholson and Gray (1971), Taus and Hearst (1972), Thomas and Lyons (1968), Weisman (1969),
CHAPTER II
GENERAL METHOD
1. SUBJECTS
The subjects were experimentally naive homing pigeons bred and reared in the Psychology Department of the University of Canterbury. For the duration of the experiment in which they were used, they were housed indoors in individual cages and maintained at
23
80% (±lOg) of their free-feeding body weights. Water and grit were freely available in the home cages, and prescribed body weights were maintained by supplementary feeding, comprising a mixture of pigeon peas and wheat. Forty-six subjects were used, six in Experiment 1 and eight each in Experiments 2 to 6.
2. APPARATUS
translucent plastic housing, 1 cm in diameter, 14 cm to the right of the centre key and 24 cm above the floor, was illuminated when a reinforcer was sched-uled and during its delivery. This signal had an illumination of 292 lx, measured by a Toshiba Photo-cell Illuminometer model BPI-S. These were the only sources of illumination in the chamber. During Exper-iments land 2, the key was transilluminated using a Grason-StadIer. multiple stimulus projector. For Experiments 3 to 6, stimuli were projected on to an opaque screen 1 cm behind the key by a Kodak Carousel projector (S-AV 2000, Type F) (for Experiment 3) or an Agfacolor 2S0W AV projector (Experiments 4 to 6)
mounted outside the chamber. The light source was a lSOW tungsten halogen lamp. The projector was set on low illumination and a 1.0 n.d. wratton filter no. 96 and an iris diaphragm were set in front of i t to reduce the light intensity impinging on the key to a standard 30 lux without slides. General masking noise was pro-vided by the exhaust fan used for ventilation.
Electromechanical relay control and recording equipment was located in an adjacent room.
3 .. PROCEDURE
This is an outline of the basic procedure followed in all the experiments. More detailed outlines of
(i) Prelirninarytraining
When subjects had reached 80% free feeding weight, they were adapted to the experimental chamber and magazine trained. All keys were dark and the houselight was off. In session 2 they were trained
25
to peck the key using a procedure similar to that of Brown and Jenkins (1968). The chamber was dark except during stimulus-food pairing trials, each of which comprised illumination of the key for 8 seconds. At the offset of the key light the hopper was raised for
4 seconds. Pecks to the l i t key turned the key light off and the hopper was immediately presented. Key pecks during the intertrial interval had no scheduled effect, whereas in the Brown and Jenkins study, such pecks delayed the next trial for 60 seconds. Brown and Jenkins scheduled trials on an average of one every 60 seconds, but in this study they were sched-uled on an average on one every 30 seconds(VT-30sec schedule) 1 a schedule also used by Tomie, Davitt and
(ii) Baseline training
A two-ply- mUltiple schedule with identical variable-interval 60-sec schedules associated with each component (MULT VI-60sec VI60sec) constituted the nondifferential or baseline phase for all exper-iments except Experexper-iments 3 and 6. The baseline training procedures for these experiments will be outlined later in the detailed Method section for each experiment. Each session lasted about35 minutes and comprised 15 I-minute presentations of each of the stimuli, Sl and S2, associated with the two com-ponents. Between stimuli presentations there was a
6-sec blackout during which the response key was dark and inoperative and the tapes controlling the rein-forcement schedule were stopped. The order of presen-tation of Sl and S2 during each sessions was determined using Gellermann series (Gellermann, 1933), which were developed for use in discrete-trial visual discrimin-ation experiments, giving
"orders of alternating stimuli in which the most probable chance score would be 50% correct" (p. 206)
stability:-'X(sessions 1 to 3) - x(sessians 4 to 6) <: 10% x(sessions 1 to 6)
This criterion was adapted from Schoenfeld, Cumming and Hearst (1956), who used 5% of the grand mean as their cutoff point.
(iii)· Baseline generalization test
A baseline generalization test was given to all subjects to provide a standard against which
27
to compare performance on the post-discrimination training generalization test, and thus assess the contribution of the pre-experimental factors to the final obtained gradient. The procedure adopted for the generalization testing followed as closely as was practicable, that in effect during baseline training, in terms of such parameters as deprivation level, and length of session, stimulus presentation, and blackout. The baseline generalization test was given on the day following the final session of baseline training. The test comprised an initial "warm-up" period constituting four I-minute presentations of each of the training
stimuli, Sl and S2, reinforced on the MOLT VI-60sec VI 60sec schedule. Immediately afterwards the test stimuli were
was a second testing series, again in extinction.
(iv) Discrimination training
On the day followi~9 the baseline general-ization test, the discrimination training phase began. The procedure was identical to that of the baseline training phase except for the reinforcement schedule in effect. One stimulus, Sl, remained associated with the VI-60sec schedule, but the other stimulus, S2, was now associated with either of two discrimination training procedures. For some subjects, S2 was now associated with extinction, giving a discrimination training proce-dure of MULT VI-60sec EXT. For other subjects, the discrimination training procedure involved signalled reinforcement. In this procedure the only difference between baseline and discrimination training was that in the latter, the availability of reinforcement in the S2 component was signalled by the onset of the house-light, which remained on until and during the delivery of the reinforcer. Key pecks were reinforced only in the presence of this added signal: for the rest of the time that the S2 component was in operation, no responses were reinforced. The signal light never came on during Sl presentations. This schedule is referred to as MULT VI-60secVI60sec(SIG).
Discrimination training continued until response rates had stabilised.
The procedure for the post-discrimination training generalization test, which was conducted on the day following the last session of discrim-ination training, was identical to that of the baseline generalization test, except for the rein-forcement schedule in effect during the warm-up phases. This now consisted of presentation of Sl and S2 associated with the appropriate schedule in effect during discrimination training, in either MULT VI-60sec EXT or MULT VI-60sec VI-60sec(SIG).
4. DISCUSSION OF GENERAL' METHOD
It is appropriate to discuss here the rationale behind the procedures adopted in the experiments to be described.
a. A two-ply MULT VI VI schedule was used because i t can be regarded as a standard training procedure for investigations of discrimination. Ferster and Skinner
(1957) pointed out that a VI schedule in contrast to fixed-interval (FI) and fixed-ratio (FR) schedules, typically produces
"a constant [response] rate by not permitting any of the bird's behavior: to ,acquire discrim-inative properties". (po 326)
Responding within each component of a MULT VI VI schedule develops into a steady and sustained rate, although with some small local changes produced by
29
a particular set of intervals this stable performance'
use of pigeons in a 2-component multiple schedule has provided a procedural paradigm for the invest-igation of stimulus control.
b. Baseline generalization test: Most experiments concerning dimensional stimulus control follow Hanson's
(1959) procedure of discrimination training followed by a generalization test, but without a previous base-line generalization test conducted prior to discrimin-ation training. However, the results obtained by
Peterson (1962) and Tracy (1970), among others, provide a salutary warning that previously acquired discrimin-ations may transfer to the testing situation and result in differential responding which is not related to the specific discrimination training procedure used.
It has become standard procedure when investigating the effects of discrimination training on dimensional
stimulus control to do generalization testing only after the training, without a baseline generalization test for comparison (e~g. Rilling, Capla1'), Howard and Brown, 1975; Rosen and Terrace, 1975; Terrace, 1975; Thomas and Burr, 1969; Winton, 1975).
However in the experiments to be described here, there was both a baseline nondifferential training
period to ensure equal responding to both training stimuli and a baseline generalization test thereafter, which
provided a measure of the extent of the contribution of pre-experimental or non-specific factors to the
in the shape of the baseline and post-discrimination training generalization tests could then confidently be said to result from the interpolated discrimination training.
c. Testing procedure: Thomas and Burr. (1969) showed that the length of the delay period between training and generalization testing affected the shape of the generalization gradients. They gave pigeons successive discrimination training and then tested along the wavelength dimension, and found that
"a 24-hr delay between training and testing for generalization produced both a greater peak shift and a flatter gradient than that obtained on an immediate test" (p. 108), but that. a 3-min warm-up period immediately before
testing eliminated such differences, i.e. the subse-quent generalization gradients were the same shape as those obtained when testing was conducted immediately following training. The warm-up period preceding each testing session lS usually about the three minute dura-tion discussed by Thomas and Burr, but there are excep-tions in the literature. Rilling, Caplan, Howard and Brown (1975) for example preceded each session of
testing with 28 trials of discrimination training. The great advantage in conducting the generalization test' on the day following the final training session was that the deprivation levels were the same during
training and testing. If testing had been carried out immediately following the final training session, the
deprivation level of the subjects would have been lower than during training, resulting in a lowering of absolute response rates. Thomas and Burr reported that absolute response rates during the generalization test were lower in the subjects tested immediately after training than in those tested one day later. However, they reported that the absolute rate diff-erence made no substantial diffdiff-erence to the shape of the obtained gradients.
Many studies of dimensional stimulus control follow the pattern set by Guttman and Kalish (1956) in having a shorter duration of stimulus present~tion during generalization testing than during training. In their study pigeons were given single-stimulus
training and then tested along the wavelength dimension. During training the stimuli were presented for 60 sec, separated by blackouts of 10-sec duration; but during generalization testing the stimuli were presented for only 30 sec, separated by 10-sec blackouts.
was also adopted by Thomas and Burr (1969).
This pattern Many
researchers adopt the pattern reported by Dysart, Marx, McLean and Nelson (1974), viz. 3-min stimulus presen-tations during training and 3D-sec presenpresen-tations during generalization testing. The literature on transient contrasts effects (e.g. Nevin and Shettleworth, 1966, Staddon, (1969) emphasizes the occurrence of local
the stimulus presentations were of equal length during training and testing to eliminate the differential
33
effects of such phenomena. Farthing and Hearst (196B),
Jenkins and Harrison (1962), Rilling, Caplan, Howard and Brown (1975), Rosen and Terrace (1975) and Terrace
(1975) are among those who have also adopted this approach.
d. The generalization test data are presented as relative response rates, which give the response rate to each stimulUS during testing as a fraction of the total number of responses to all test stimuli during that testing session. This procedure equates for dif-ferences in the number of responses made during testing and enabl,es direct comparison of the slopes of the
gradients, and location of maxima and minima, independent of the height of individual gradients. Various
trans-formations into relative gradients have been used for some time, as was noted by Lyons (1969):
"The use of percent gradients has become common practice in the scientific literature (cf. Hearst, Koresko and Poppen, 1964; Switalski et aI, 1966i Thomas and King, 1959)".
The choice of the measure of relative generalization appears to have been somewhat arbitrary, but the~e are two basic types. The first, as adopted here, is to
convert each response value on the gradient to a percentage or fraction of the total responses to all test stimuli during generalization testing. This procedure was also used by Hearst, Taus and Koresko (1971), Farthing (1972),
for converting absolute into relative response rates to enable the comparison of two g~eralization gradients, expresses responding to a test stimulus as a fraction of the responding to the training stimulus. Farthing and Hearst (1972), for example, assigned S:f: the value of 1, and all other stimuli fractions of this. Hearst
(1969, p. 238) used the highest response rate as the standard (i.e. not necessarily responses at S+) and expressed all other response frequencies as decimal
fractions of this value. The use of relative measures can be criticised particularly in situations where
comparisons are to be made between successive gradients obtained from the one subject rather than between
dif-ferent subjects, as the implied model of constant prob-abilities does not hold: Hearst (1969) showed that the ratio sometimes fails to remain constant, with sharpening relative gradients during extinction. If these gradients had been measured in absolute terms, the relative dif-ferences would have remained constant during extinction, and this would have avoided the absurd situation of a demonstration of improved discrimination ability as a
result of extinction. However, in the present experiments the need to transform generalization test data into
relative response rates is well justified as the only way to compare two or more different response rates
which all change as a result of experimental manipulation. This procedure tells us whether or not the difference
between the two response rates has changed. e. Stability of responding, during training:
35
could have been used, but all have their disadvantages. A frequently used measure of differential responding in each component is the Discrimination Index (DI):
D. I. = Rl Rl
+
R2Where Rl = response rate in 81 R2
=
response rate in 82Equal responding in both components gives aDI of 0.5. But the disadvantage in the context of these exPeriments, where comparisons are made between response rates during two conditions of training, is that a stable DI could be obtained while response rates in both components
are decreasing. Also, increases in DI during discrim-ination"training may result from an increased response rate in Sl, decreased response rate in 82# or some combination of these.
The discrimination ratio (DR):.
HI
has the R2advantage over the DI as a measure of stability of responding in that i t allows for increases in response rate to be recorded. If the response rate is the same in each component, DR
=
1. However, this still gives no indication of change i f the response rate in both components is increasing. A further problem is that when the response rate in 82 is zero, the DR approachesinfinity, for any size of R.
Therefore, the stability criterion adopted in this series of experiments (after 8choefeld, Cumming and Hearst, 1956), was chosen because i t provides a measure
relevant to experiments considering the occurrence of positive behavioural constrast,a defining characteristic of which is an increase in response rate in an unchanged component.
f. Measures of behavioural contrast:
There are several ways of assessing behavioural contrast reported in the literature, and the variety of measures used limits the comparability of studies adding to
the complexity of this area of research. Some workers (e.g. Couch, 1975; Hemmes, 1973; Keller, 1974; Richards, 1972; Vieth, 1972; Westbrook, 1973) report only
untransformed data, presenting graphs or tables of response rates and evaluating the contrast effect by inspection of these. Bilbrey and Winokur (1974) and Sadowsky (1973) presented percentage change in response rate between baseline and discriminative training.
Bilbrey and Winokur computed the percentage difference between the last four baseline sessions and the first
four extinction (discrimination training) sessions, and Sadowsky compared groups of subjects to determine the peak rate of responding by taking the highest daily rate in the first ten days of discrimination training as a percentage increase over the mean of the last ten days of pretraining. Kodera and Rilling (1976) defined behavioural contrast as a difference of one standard deviation between the response rate of the last five days of one phase and the first five days of the other.
and Champlin (1974), Pert and Gonzalez (1974), and Richards (1975), to evaluate'contrast effects. Kodera and Rilling (1976), however, warn against the use of parametric statistics on comparisons of group means if they violate the homogeneity of variance rule,
37
and they therefore used the Mann Whitney Utest to evaluate their data, as did Boakes, Halliday and Mole
(1976), and Halliday and Boakes (1974). The disadvantage of the use of such statistical measures is again that the data being analysed are not the same for different researchers: e.g. Boakes et al (1976) compared changes in median response rate from baseline to experimental conditions but Kodera and Rilling (1976) compared
group means. Gonzalez and Champlin (1974) and Richards (1975) both performed treatment by subject analyses, but Gonzalez and Champlin used five consecutive blocks of four days, and Richards, seven five-day blocks.
Statistical analyses such as these are not reported on the data of the experiments in this series. Rather, discrimination training data are presented so that an evaluation can be made not of grouped data, but of individual subjects in each group. These data are presented as normalised response rates. This trans-formation has been used previously: Brownstein and
Hughes (1970) and Brownstein and Newsom (1970) determined the mean response rate for the last five days of
of 1.00 to the mean of the last seven baseline sessions. In this series of experiments, the normalised
response rate is calculated by dividing the response rate in a component by the mean response rate in that component during the final six days of baseline training, for each subject. These were the same six days from
which discrimination indices were calculated. The mean of the six sessions was thus denoted as 1.00. The extent to which the 81 response rate rose above 1.00 during discrimination training gives a
measure of the amount of positive behavioural contrast exhibited by that subject, and the extent to which the 82 response rate decreased below 1.00 gives a measure of response suppression in the changed component. The purpose of presenting the data this way rather than as absolute response rates is to minimise inter-subject differences in response rates to get a direct comparison across subjects of the occurrence and extent of both positive behavioural contrast and response
suppression. The drawback of the use of normalised data is that high responders may then appear to
39
CHAPTER III
EXPERIMENT 1
1. AIM
To compare stimulus control following discrimin-ation training using either extinction or signalled reinforcement to suppress responding in S2.
2. METHOD
This was outlined in General Method, with the following specific characteristics:
(i) Subjects:
Jl J2 J3 J4 J5 and J6 ( i i) Procedure:
a. Baseline training
An intradimensional training procedure was used. The two components of the MULT VI-60sec VI-60sec sche-dule were denoted by two different orientations
(300 and 600) of a black line on a white background.
(All line orientations are labelled such that 00 denotes the horizontal and 900 the vertical.)
b. Pre-discrimination training generalization test The seven test stimuli were the following
orientations of a black line on a white background: