Munich Personal RePEc Archive
Uganda’s Access to Global and Regional
Markets
Walkenhorst, Peter
World Bank
March 2006
Online at
https://mpra.ub.uni-muenchen.de/23575/
Uganda’s Access to Global and Regional Markets
#
Peter Walkenhorst *
March 2006
ABSTRACT
As a landlocked country in East Africa, Uganda faces two major disadvantages
concerning access to foreign markets. It does not have an immediate gateway to low-cost
ocean transport, but first has to pass its imports and exports through neighboring
countries by road or rail. Nor does it share a common border with an industrialized
country that produces the goods and services that Uganda imports and that could absorb a
large share of the country‟s exports.
In this context it is all the more important to fully
exploit existing opportunities in regional and global markets, as well as opening new
export markets by negotiating trade barrier reductions on a preferential or multilateral
basis. These trade barrier-related aspects of regional and global market access are
analyzed in this paper. In particular, the discussion reviews market access policy in
Uganda and identifies a number of key issues and challenges for the country.
KEYWORDS
Trade, tariffs, regional integration, overlapping agreements, preferences, world markets
JEL CLASSIFICATION
F13; F14; F15; O24
#) This paper serves as a background document for the preparation of the “Uganda: Diagnostic Trade Integration Study.” Kampala and Washington DC: Ministry of Tourism, Trade, and Industry and World Bank. The findings, interpretations, and conclusions expressed in this study are entirely those of the author. They do not necessarily represent the view of the World Bank, its Executive Directors, or the countries they represent.
Table of Contents
1.
The Issue of Market Access ... 3
2.
Access to Regional Markets... 4
2.1
Importance of Formal and Informal Trade within the Region ... 7
2.2
Economic Effects of Regional Initiatives ... 10
2.3
Overlapping Membership in Regional Agreements ... 17
3.
Access to Global Markets ... 19
3.1
Trade Barriers in International Markets ... 21
3.2
Impact of Trade Preferences in Industrialized Country Markets ... 23
3.3
Negotiations of an Economic Partnership Agreement ... 28
3.4
Multilateral Trade Negotiations ... 30
4.
Recommendations for Policy Reform and Technical Assistance ... 32
References ... 33
1. THE ISSUE OF MARKET ACCESS
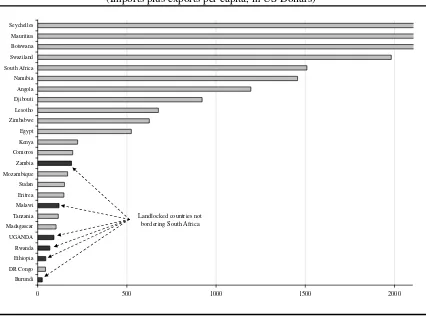
As a landlocked country in East Africa, Uganda faces two major disadvantages concerning access to foreign markets. It does not have an immediate gateway to low-cost ocean transport, but first has to pass its imports and exports through neighboring countries by road or rail. Nor does it share a common border with an industrialized country that produces the goods
and services that Uganda imports and that could absorb a large share of the country‟s exports. As
[image:4.612.95.521.225.541.2]a result and like other landlocked countries in the region that do not have a common border with South Africa, Uganda shows a very low degree of trade intensity, as measured by total trade per capita (Figure 1).
Figure 1: Trade Intensity in Eastern and Southern Africa
(Imports plus exports per capita, in US Dollars)
0 500 1000 1500 2000
Burundi DR Congo Ethiopia Rwanda UGANDA Madagascar Tanzania Malawi Eritrea Sudan Mozambique Zambia Comoros Kenya Egypt Zimbabwe Lesotho Djibouti Angola Namibia South Africa Swaziland Botswana Mauritius Seychelles
Landlocked countries not bordering South Africa
Note: Data for 2002. No comparable information available for Somalia. Source: World Bank, World Development Indicators.
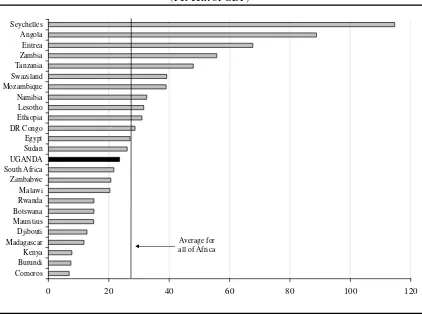
Figure 2: Stock of Foreign Direct Investment in Eastern and Southern Africa, 2004
(Per cent of GDP)
0 20 40 60 80 100 120
Comoros Burundi Kenya Madagascar Djibouti Mauritius Botswana Rwanda Malawi Zimbabwe South Africa UGANDA Sudan Egypt DR Congo Ethiopia Lesotho Namibia Mozambique Swaziland Tanzania Zambia Eritrea Angola Seychelles
Average for all of Africa
Note: No comparable information available for Somalia. Source: UNCTAD, 2005.
What can policy makers and development partners do to ameliorate the situation and reap larger benefits from increased trade? Efforts to reduce trade transactions costs through streamlining of border procedures and improved transit arrangements are one means. Such measures are discussed extensively in the chapter on transport and trade facilitation. Another avenue consists of trying to more fully exploit existing opportunities in regional and global markets as well as opening new export markets by negotiating trade barrier reductions on a preferential or multilateral basis. These trade barrier-related aspects of regional and global market access are analyzed in this chapter.
In particular, the subsequent discussion reviews market access policy in Uganda and identifies a number of key issues and challenges for the country. The analysis falls into three parts. First, the state of regional integration is described, with particular emphasis on the prospective effects of the recently concluded East African Community (EAC) customs union.
Then, Uganda‟s global market opportunities are examined, including an assessment of the degree
of preference utilization in industrialized country markets. And finally, some priorities for the attention of policy makers and international donors are identified based on the preceding analysis.
2. ACCESS TO REGIONAL MARKETS
Common Market for Eastern and Southern Africa (COMESA). Moreover, Uganda is a member of the Regional Integration Facilitation Forum, and has a number of bilateral agreements, even though the latter are not always thoroughly implemented.
Box 1: History of Regional Integration
East Africa has a long history of regional integration. Kenya and Uganda first formed a customs union in 1917, which the then Tanganyika (later Tanzania) joined in 1927. Subsequently, the three countries had close economic relationships in the East African High Commission (1948-1961), the East African Common Services Organization (1961-1967), the East African Community (1967-1977), and the East African Co-operation (1993-1999). In November 1999, the Treaty for the establishment of the (new) East African Community was signed, and entered into force in July 2000.
The EAC Trade Protocol was signed in March 2004. After subsequent ratification in national Parliaments, the customs union was launched in January 2005, establishing a common external tariff and removing all intra-regional trade barriers during a five-year transition period. Once the customs union is completed, the EAC partners envisage further integration steps with the creation of a common market, a monetary union, and ultimately a political federation, although no time table has been established yet.
Uganda is also an active member of COMESA, which was founded in 1994 to replace the
region‟s former Preferential Trade Area. In addition to Uganda, there are 19 other COMESA
members, namely Angola, Burundi, Comoros, Democratic Republic of Congo, Djibouti, Egypt, Eritrea, Ethiopia, Kenya, Libya, Madagascar, Malawi, Mauritius, Rwanda, Seychelles, Sudan, Swaziland, Zambia, and Zimbabwe. One of the main objectives of this regional arrangement was to establish a free trade area, which was (partly) achieved in October 2000, when nine
COMESA‟s members (Djibouti, Egypt, Kenya, Madagascar, Malawi, Mauritius, Sudan, Zambia
and Zimbabwe) removed their intra-regional trade barriers. Burundi and Rwanda joined the free trade area in January 2004, bringing the number of participating countries to eleven. A further integration step in the form of the establishment of a customs union, which had originally been planned for 2004, has been postponed, as the final structure of the common external tariff has yet to be agreed upon.
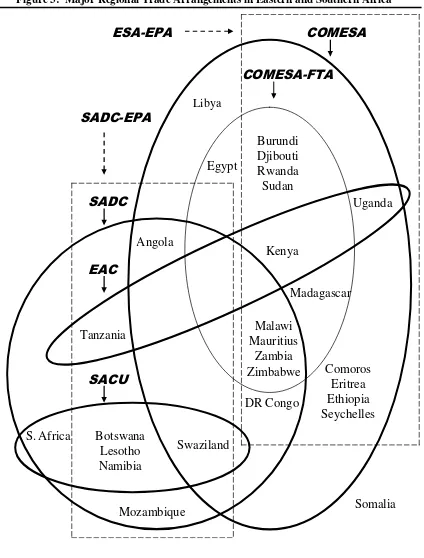
Figure 3: Major Regional Trade Arrangements in Eastern and Southern Africa
Source: World Bank Staff.
Uganda
Burundi
Djibouti
Rwanda
Sudan
Angola
Tanzania
DR Congo
Malawi
Mauritius
Zambia
Zimbabwe
Mozambique
Botswana
Lesotho
Namibia
Swaziland
Madagascar
Comoros
Eritrea
Ethiopia
Seychelles
SADC
EAC
COMESA
SACU
S.
Africa
Kenya
COMESA-FTA
SADC-EPA
ESA-EPA
Egypt
Somalia
2.1 Importance of Formal and Informal Trade within the Region
According to official statistics, the value of total trade (imports plus exports) amounted to
about 34 per cent of Uganda‟s GDP in 2004 (Table 1). About a third of this total was carried out
with other countries in Eastern or Southern Africa, up from a quarter a decade earlier. Most of the regional trade occurred under preferential market access conditions within COMESA or EAC. Trade with SADC-only countries, i.e. countries in the region that are neither members of COMESA nor EAC, such as South Africa, amounted to 2.2 per cent of GDP.
[image:8.612.84.533.269.653.2]Regional trade in manufactured products is relatively more important than regional trade in agricultural commodities. This is due to a significant share of Uganda‟s manufactured imports originating in other countries in the region, notably Kenya and South Africa. For agricultural products, Uganda has a trade surplus vis-à-vis Eastern and Southern Africa, which in 2004 exceeded the corresponding surplus with the Rest of the World.
Table 1: Structure of Uganda’s Merchandise Trade within the Region (per cent of gross domestic product)
Total trade Exports Imports Net-Exports 1994 1999 2004 1994 1999 2004 1994 1999 2004 1994 1999 2004 All Goods
World 28.3 25.5 33.6 11.3 8.5 9.4 17.1 17.0 24.2 -5.8 -8.5 -14.9 - Africa 6.9 8.0 11.0 1.5 2.6 3.2 5.4 5.4 7.9 -3.8 -2.7 -4.7 - Countries in E & S Africa 6.9 7.7 10.7 1.5 2.3 2.9 5.4 5.3 7.8 -3.8 -3.0 -4.9 COMESA 6.5 5.9 8.1 1.5 1.7 2.6 5.0 4.2 5.5 -3.5 -2.5 -2.9 ESA-EPA 6.4 5.7 7.7 1.5 1.6 2.5 5.0 4.1 5.2 -3.5 -2.6 -2.6 EAC 5.4 4.9 6.6 0.5 0.6 1.3 4.9 4.2 5.3 -4.4 -3.6 -4.0 SADC only 0.2 1.5 2.2 0.0 0.6 0.1 0.2 1.0 2.1 -0.1 -0.4 -1.9 - Other Africa 0.0 0.3 0.3 0.0 0.3 0.2 0.0 0.0 0.0 0.0 0.2 0.2 - Rest of World 21.4 17.5 22.6 9.7 5.8 6.2 11.7 11.6 16.4 -2.0 -5.8 -10.2 Agriculture (HS 1-24)
World 13.3 9.4 10.2 10.6 7.0 6.1 2.8 2.4 4.1 7.8 4.5 1.9 - Africa 2.4 2.3 2.6 1.2 1.8 1.8 1.1 0.6 0.7 0.1 1.2 1.1 - Countries in E & S Africa 2.4 2.1 2.5 1.2 1.5 1.8 1.1 0.6 0.7 0.1 1.0 1.0 COMESA 2.3 1.7 2.1 1.2 1.3 1.6 1.1 0.4 0.5 0.2 0.9 1.2 ESA-EPA 2.3 1.6 2.0 1.2 1.2 1.6 1.1 0.4 0.4 0.2 0.8 1.2 EAC 1.4 0.8 1.2 0.4 0.4 0.8 1.0 0.4 0.4 -0.6 0.0 0.4 SADC only 0.0 0.3 0.3 0.0 0.1 0.1 0.0 0.1 0.2 0.0 0.0 -0.1 - Other Africa 0.0 0.3 0.1 0.0 0.3 0.1 0.0 0.0 0.0 0.0 0.3 0.1 - Rest of World 11.0 7.1 7.7 9.3 5.2 4.3 1.7 1.9 3.4 7.7 3.3 0.8 Manufacturing (HS 25-99)
World 15.0 16.1 23.4 0.7 1.5 3.3 14.3 14.6 20.1 -13.6 -13.1 -16.8 - Africa 4.6 5.7 8.5 0.3 0.9 1.3 4.3 4.8 7.1 -4.0 -3.9 -5.8 - Countries in E & S Africa 4.5 5.6 8.3 0.3 0.8 1.2 4.3 4.8 7.1 -4.0 -3.9 -5.9 COMESA 4.2 4.2 6.1 0.3 0.4 1.0 3.9 3.8 5.1 -3.7 -3.4 -4.1 ESA-EPA 4.1 4.1 5.8 0.3 0.4 1.0 3.9 3.7 4.8 -3.6 -3.4 -3.8 EAC 4.1 4.0 5.4 0.1 0.2 0.5 3.9 3.8 4.9 -3.8 -3.6 -4.4 SADC only 0.2 1.2 1.9 0.0 0.4 0.1 0.2 0.8 1.9 -0.1 -0.4 -1.8 - Other Africa 0.0 0.1 0.2 0.0 0.0 0.2 0.0 0.0 0.0 0.0 0.0 0.1 - Rest of World 10.4 10.4 14.9 0.4 0.6 2.0 10.0 9.8 13.0 -9.6 -9.1 -11.0 Note: E & S Africa is taken as all countries that are members of COMESA or SADC. Regional Trade Blocs (COMESA, ESA-EPA, EAC) are aggregated from individual country data according to the membership structure as of January 2005 (see figure 3). “SADC only” refers to Botswana, Lesotho, Mozambique, Namibia, and South Africa.
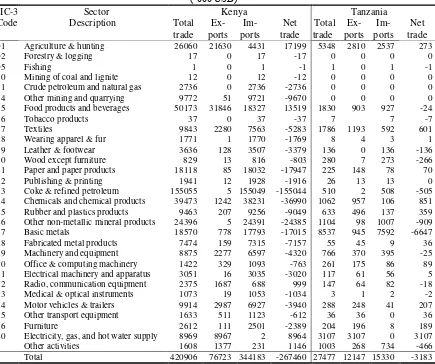
Uganda has been running trade deficits with its two EAC partners, Kenya and Tanzania.
In 2004, these amounted to 3.2 million USD vis-à-vis Tanzania and a more substantial
267 million USD vis-à-vis Kenya (Table 2). Uganda is a net exporter of agricultural products and
[image:9.612.94.529.167.531.2]electricity to both of its partners, but imports large quantities of manufactures.
Table 2: Structure of Uganda’s Trade with its EAC Partners, 2004 („000 USD)
ISIC-3 Sector Kenya Tanzania
Code Description Total trade Ex- ports Im- ports Net trade Total trade Ex- ports Im- ports Net trade 01 Agriculture & hunting 26060 21630 4431 17199 5348 2810 2537 273 02 Forestry & logging 17 0 17 -17 0 0 0 0 05 Fishing 1 0 1 -1 1 0 1 -1 10 Mining of coal and lignite 12 0 12 -12 0 0 0 0 11 Crude petroleum and natural gas 2736 0 2736 -2736 0 0 0 0 14 Other mining and quarrying 9772 51 9721 -9670 0 0 0 0 15 Food products and beverages 50173 31846 18327 13519 1830 903 927 -24 16 Tobacco products 37 0 37 -37 7 7 -7 17 Textiles 9843 2280 7563 -5283 1786 1193 592 601 18 Wearing apparel & fur 1771 1 1770 -1769 8 4 3 1 19 Leather & footwear 3636 128 3507 -3379 136 0 136 -136 20 Wood except furniture 829 13 816 -803 280 7 273 -266 21 Paper and paper products 18118 85 18032 -17947 225 148 78 70 22 Publishing & printing 1941 12 1928 -1916 26 13 13 0 23 Coke & refined petroleum 155055 5 155049 -155044 510 2 508 -505 24 Chemicals and chemical products 39473 1242 38231 -36990 1062 957 106 851 25 Rubber and plastics products 9463 207 9256 -9049 633 496 137 359 26 Other non-metallic mineral products 24396 5 24391 -24385 1104 98 1007 -909 27 Basic metals 18570 778 17793 -17015 8537 945 7592 -6647 28 Fabricated metal products 7474 159 7315 -7157 55 45 9 36 29 Machinery and equipment 8875 2277 6597 -4320 766 370 395 -25 30 Office & computing machinery 1422 329 1093 -763 261 175 86 89 31 Electrical machinery and apparatus 3051 16 3035 -3020 117 61 56 5 32 Radio, communication equipment 2375 1687 688 999 147 64 82 -18 33 Medical & optical instruments 1073 19 1053 -1034 3 1 2 -2 34 Motor vehicles & trailers 9914 2987 6927 -3940 288 248 41 207 35 Other transport equipment 1633 511 1123 -612 36 36 0 36 36 Furniture 2612 111 2501 -2389 204 196 8 189 40 Electricity, gas, and hot water supply 8969 8967 2 8964 3107 3107 0 3107 Other activities 1608 1377 231 1146 1003 268 734 -466 Total 420906 76723 344183 -267460 27477 12147 15330 -3183 Source: UN COMTRADE database.
The trade balance with regional partners improves if informal cross-border transactions are taken into consideration. The Uganda Bureau of Statistics monitored small-scale trade at border crossings that is not subject to customs regulations during the period from October 2003 to January 2004. The authorities tolerate shipments by bicycle or wheelbarrow of up to 200 kg as not requiring official registration, so that traders can avoid the (relatively low) EAC or COMESA tariffs and other direct and indirect taxes that apply only to formal businesses. Enumerators were
stationed at border posts with all of Uganda‟s five neighbours, i.e. DR Congo, Kenya, Rwanda,
Sudan, and Tanzania. They recorded both informal export and import transactions at the border posts and made estimates on the extent to which informal transactions took place in the post‟s vicinity (UBOS, 2004).
partner countries corresponded to about half of formal trade, while informal imports amount to less than five per cent of the value of imports reported in official statistics. The informal trade surplus over the four month survey period from October 2003 to January 2004 was estimated to amount to 19.1 million USD. The loss in government revenue over this period due to non-collection of import tariffs and value-added taxes is estimated to amount to about 1 million USD (UBOS, 2004). Informal cross-border transactions are bound to persist even if tariffs are reduced to zero, such as envisaged between Uganda, Kenya and Tanzania after the EAC transition period, because the fiscal disincentive related to becoming a formal business, including liability for value-added and other taxes, will remain. Hence, the toleration of informal trade transactions will continue to lead to revenue slippage.
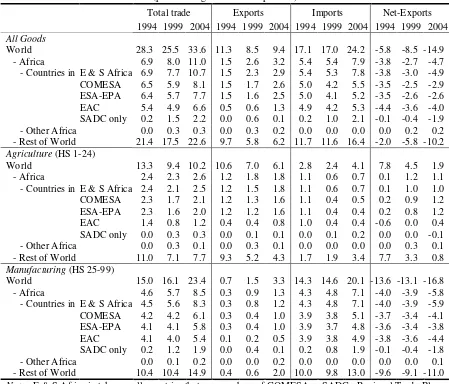
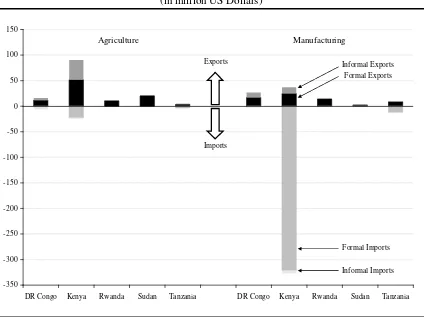
[image:10.612.95.519.368.685.2]The importance of informal transactions varies considerably across the countries neighbouring Uganda. Informal trade with DR Congo and Kenya is quite substantial, while informal transactions are only of minor significance for Uganda‟s trade relations with Rwanda, Sudan, and Tanzania (Figure 4). According to the UBOS study, Uganda has informal trade surpluses with all its five neighbours and in each case for both agricultural and manufacturing products. The positive informal trade balance for manufactures with Kenya is particularly remarkable, since for official trade, Uganda runs a very large trade deficit with that country. However, further verification of the extent of informal cross-border transactions seems desirable, since earlier surveys conducted during the mid-1990s found a substantial deficit in informal trade of manufactures for Uganda with Kenya (Ackello-Ogutu and Echessah, 1997), so that the findings to date should be treated with care.
Figure 4: Uganda’s Formal and Informal Trade with its Neighbors, 2004
(in million US Dollars)
-350 -300 -250 -200 -150 -100 -50 0 50 100 150
DR Congo Kenya Rwanda Sudan Tanzania DR Congo Kenya Rwanda Sudan Tanzania
Agriculture Manufacturing
Imports Exports
Formal Imports
Informal Imports Informal Exports Formal Exports
Source: UN COMTRADE database, and UBOS, 2004.
While the product composition of informal trade varies across partner countries, the overall most important agricultural commodities that are traded informally are maize and beans. For manufactured products, shoes, bitenge, and used clothes feature prominently. A substantial part of the latter represents re-exports, as Uganda receives large amounts of used clothing from developed countries. The unit values of informally traded commodities were found to be lower than those observed in formal trade, suggesting that the products that go through informal channels might be of inferior quality. This finding, again, merits further investigation and year-round monitoring of cross-border transactions, for example, would make it possible to capture seasonal variations in pricing and trade flows and gain valuable information to complement official trade statistics.
2.2 Economic Effects of Regional Initiatives
Economic integration at the regional level can make it possible to reap benefits from international trade, while tailoring the provisions of the agreement to the particular needs and adjustment capacities of the countries involved. In the short term, regional integration will entail adjustment needs, as prices on the domestic market change in response to tariff reforms. Such
structural adjustments are to be expected as a result of Uganda‟s most recent and most
far-reaching regional integration step, i.e. the formation of the EAC.
2.2.1 The EAC Tariff Regime
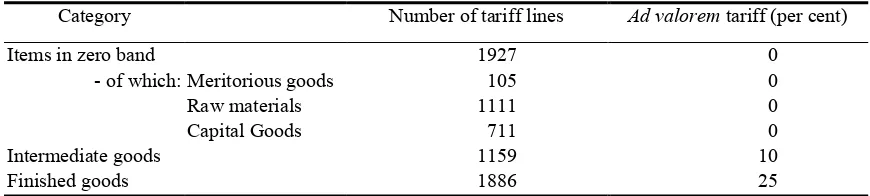
Uganda changed its structure of domestic market protection when joining the customs union with Kenya and Tanzania in January 2005. Tariff rates were adjusted to the level of the common external tariff and the previously existing import commission fees of two per cent were discontinued, while intra-regional trade barriers will be phased out. In particular, the arrangement calls for Kenya to eliminate all tariffs on imports from Uganda and Tanzania, and for Uganda and Tanzania to eliminate tariffs on each other‟s imports. Regarding imports from Kenya, Uganda and Tanzania will eliminate tariffs on all imports except for an agreed-on list of products for which the tariff will be gradually reduced to zero over a period of five years. The asymmetry in liberalizing intra-regional trade is intended to give Tanzania and Uganda, which are less developed and have a large trade deficit with Kenya, additional time to initiate structural adjustments. Uganda‟s list contains 443 products, which are subject to import tariffs of 10 per cent in 2005 that will be reduced to zero in five annual steps. With this 10 per cent import duty, Kenyan exporters of listed products face (temporarily) higher import barriers in 2005 under EAC preferences than they used to under COMESA preferences in 2004.
Table 3: The EAC Common External Tariff
Category Number of tariff lines Ad valorem tariff (per cent)
Items in zero band 1927 0
- of which: Meritorious goods 105 0
Raw materials 1111 0
Capital Goods 711 0
Intermediate goods 1159 10
Finished goods 1886 25
Source: World Bank Staff.
In the negotiations on the formation of the customs union, the three EAC partners agreed on a list of 56 sensitive products to which “special tariffs” apply. About a fifth of the latter are
combined duties, consisting of an ad valorem and a specific element, which can yield significant
protection for domestic producers. The ad valorem tariffs range from 35 to 100 per cent, with the
highest duties applying to sugar imports. Other sensitive products include milk, grains, cigarettes, kitenge, and used clothing. Since for most of the sensitive products, the special tariffs exceed the previously existing national import duties, adverse economic effects, notably higher consumer prices, are likely. Some analysts point out that it seems questionable whether regional producers will be able to increase production or offer substitutes in comparable quantity, quality and price to offset the protection-induced reduction in third country imports (Stahl, 2005). Higher prices will notably hit consumers on low incomes, who depend for their livelihood heavily on the basic products included in the sensitive list. An aggravating factor is that these regressive effects will be felt most intensively in the relatively poorer EAC partners, above all in Uganda, in
the view of the country‟s relative low import protection prior to EAC formation. In this context,
the government of Uganda should press its partners to establish a timetable that calls for the imminent phase-out of the special tariffs.
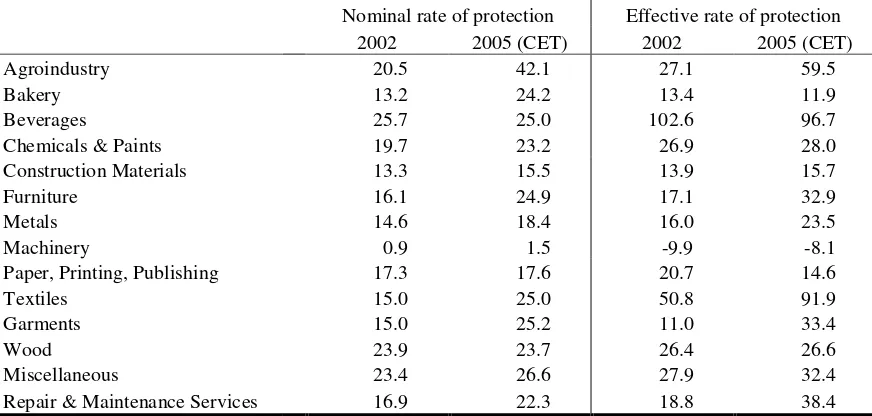
As a result of the adoption of the common external tariff, the listed average duty rate (including excise duties and import commissions in 2004) increased from 11.3 per cent to 12.3 per cent. This increase in protection affected both agricultural and manufactured products. The tariff regime is escalatory by granting higher protection to processed products than to raw materials. This tariff escalation generates effective rates of protection (ERPs) that exceeds nominal tariff protection for producers that have access to inputs at low-tariff rates, while being able to shield behind high import barriers for their final products. By taking into account protection on both outputs and inputs, ERPs provide a better representation of tariff-generated transfers to producers than nominal rates of protection (NRPs), which are based on protection of outputs only.
Table 4: Nominal and Effective Rates of Protection in Uganda’s Manufacturing Sector Nominal rate of protection Effective rate of protection
2002 2005 (CET) 2002 2005 (CET)
Agroindustry 20.5 42.1 27.1 59.5
Bakery 13.2 24.2 13.4 11.9
Beverages 25.7 25.0 102.6 96.7
Chemicals & Paints 19.7 23.2 26.9 28.0
Construction Materials 13.3 15.5 13.9 15.7
Furniture 16.1 24.9 17.1 32.9
Metals 14.6 18.4 16.0 23.5
Machinery 0.9 1.5 -9.9 -8.1
Paper, Printing, Publishing 17.3 17.6 20.7 14.6
Textiles 15.0 25.0 50.8 91.9
Garments 15.0 25.2 11.0 33.4
Wood 23.9 23.7 26.4 26.6
Miscellaneous 23.4 26.6 27.9 32.4
Repair & Maintenance Services 16.9 22.3 18.8 38.4 Notes: Data based on findings of a survey of 228 manufacturing firms. Nominal rates of protection reflect tariffs plus discriminatory excise duties as listed in the tariff schedule.
Source: Rajhi, Marchat and Webster, 2005.
Domestic market protection comes at a cost, notably to consumers and firms that source their inputs domestically. Also, tariff protection introduces an anti-export bias. If firms produce for the export market, they do not receive the same market price support that producers for the domestic market enjoy. Uganda operates a duty drawback system, which makes it possible for exporters to claim back the duty and value-added tax paid on inputs of exported products. This arrangement thus neutralizes the effects of tariff and tax policy for exporting firms, if the duty refunds are indeed paid in a timely manner. Yet, the arrangement does not generate the significant policy-generated transfers that producers for the domestic market obtain, thus biasing producers‟ decisions against selling abroad. Indeed, the higher the domestic market protection is, the stronger the anti-export bias becomes. The EAC customs union protocol provides for a revision of the top CET rate five years after the customs union entered into force, and it seems in the interest of Uganda to ask its partners for a reduction in the highest-band duty from 25 to 20 per cent.
2.2.2 The impact of EAC integration
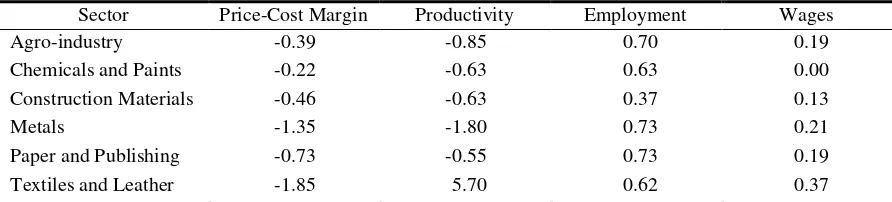
How is the increased domestic market protection going to affect firms, workers and consumers in Uganda? The impact depends on how different economic forces play out (Box 2). In the short term, econometric analysis based on firm-level data suggests that the adoption of the
EAC‟s common external tariff by Uganda will overall change profit margins, productivity, wages
Table 5: Short-Term Impacts of the Adoption of the Common External Tariff in Uganda
(change in per cent)
Sector Price-Cost Margin Productivity Employment Wages
Agro-industry -0.39 -0.85 0.70 0.19
Chemicals and Paints -0.22 -0.63 0.63 0.00
Construction Materials -0.46 -0.63 0.37 0.13
Metals -1.35 -1.80 0.73 0.21
Paper and Publishing -0.73 -0.55 0.73 0.19
Textiles and Leather -1.85 5.70 0.62 0.37
Note: Calculations based on listed overall average tariffs. Source: Rajhi, Marchat and Webster, 2005.
In the case of the EAC, the positive short-term employment and wage effects from higher protection against third country exports are to some extent counterbalanced by reduced protection
Box 2: Welfare impacts of regional integration initiatives
The overall welfare consequence of regional integration depend on several factors. If the reduction of intra-regional trade barriers fosters partner countries to expand output and exports of products for which they are internationally competitive, the price of final goods or production inputs on the importing country market falls to the benefit of consumers and input-purchasing producers. In this case, welfare-enhancing trade is created.
Moreover, regional trade initiatives can have beneficial indirect effects. Opening domestic markets to partner countries, for example, can increase competition in sectors with previously highly concentrated industrial structures and thereby reduce the monopolistic pricing power of incumbents. Such pro-competitive impacts are particularly important for countries like Uganda that have only a nascent domestic competition policy.Also, regional cooperation can be effective in harmonizing customs procedures and domestic regulations. Adopting common rules on investment, for example, has the potential to encourage increased inflows of foreign direct investment (FDI) by enhancing the credibility of FDI-policies and providing a restraint on sudden policy reversals.
Some observers justify RTAs in political economy terms by seeing them as laboratories for international integration, training grounds for negotiations at a broader level, and strategic means of trade policy making. By teaming up with regional partners, countries may be able to increase the weight of their positions in international trade negotiations and possibly achieve more favorable negotiation outcomes. Also, regional trade agreements make it possible for countries to gain some control over the trade policy of their partner countries.
Conversely, engaging in RTAs implies passing parts of a country‟s sovereignty on to the regional bloc. For example, as a result of joining the EAC customs union, Uganda can no longer freely decide on its level of import duties, but depends on consensus with Kenya and Tanzania to pursue changes to the common external tariff. Hence, the institutional framework for trade policy making changes.
Furthermore, RTAs may result in losses of government revenues, as tariffs on intra-regional trade are phased out, or promote costly trade diversion rather than welfare-enhancing trade creation, if trade is shifted from efficient producers outside the RTA to preferential trading partners that produce at higher costs. In this case, the government loses tariff revenue on imports from third countries, without domestic producers benefiting to a corresponding extent from lower import prices. The risk for trade diversion to occur is particularly high if MFN tariffs remain high and trade with partner countries accounts for only a small share of overall trade (World Bank, 2004). A recent review of studies on the trade and welfare effects of customs unions concluded that the elimination of intra-regional trade barriers between small developing countries is likely to generate mostly trade diversion and little trade creation, unless significant reductions in MFN-tariffs accompany the regional integration efforts (Schiff and Winters, 2003).
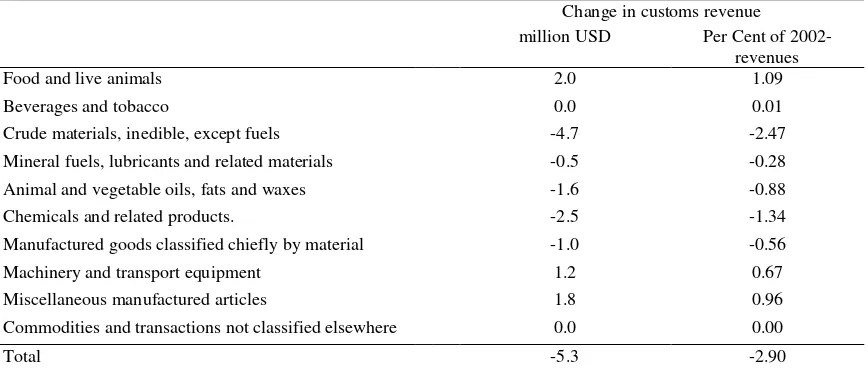
transitory duties. The largest share of revenue losses is caused by declining tariff revenues on imports of crude materials and chemicals (Table 6).
The projection that trade with EAC partners increases while imports from third countries decrease suggests that the trade policy changes that were undertaken (liberalization of intra EAC trade plus adoption of a common external tariff) are likely to lead overall to welfare-decreasing trade diversion for Uganda. This finding is at broadly confirmed by an earlier study that used a computable general equilibrium model to assess to economic effects of EAC formation (DeRosa,
Obwona, and Roningen, 2002). DeRosa et al. project economic welfare losses for Uganda due to
[image:16.612.90.524.313.499.2]trade diversion as the country‟s average MFN-tariffs increase with the adoption of the CET. They argue further that Uganda faces the danger of reduced industry competitiveness due to the EAC‟s higher tariff protection for the country‟s nascent import competing industries, which reduces the incentive to innovate, bring down production costs, and improve marketing capabilities. They see the economic growth momentum that Uganda has enjoyed since the mid-1990s as a result of trade and macroeconomic reforms (Hinkle, Herrou-Aragon and Krishnamani, 2004) thereby being partially undermined. As a remedy, they recommend for Uganda to strive for lower external tariffs in the EAC.
Table 6: Customs Revenue Change following CET Adoption by Sector Change in customs revenue million USD Per Cent of
2002-revenues Food and live animals 2.0 1.09 Beverages and tobacco 0.0 0.01 Crude materials, inedible, except fuels -4.7 -2.47 Mineral fuels, lubricants and related materials -0.5 -0.28 Animal and vegetable oils, fats and waxes -1.6 -0.88 Chemicals and related products. -2.5 -1.34 Manufactured goods classified chiefly by material -1.0 -0.56 Machinery and transport equipment 1.2 0.67 Miscellaneous manufactured articles 1.8 0.96 Commodities and transactions not classified elsewhere 0.0 0.00
Total -5.3 -2.90
Note: Estimates assuming that temporary tariffs on imports from Kenya are in place. Source: Castro, Kraus, and de la Rocha, 2004.
2.2.3 The impact of COMESA integration
In parallel to developments in the EAC, COMESA has been furthering its regional integration efforts, including negotiations on a prospective common external tariff. Uganda has had and still has a relatively liberal trade regime by regional standards, and increases in protection under a hypothetical COMESA-arrangement would likely lead to losses in international competitiveness and economic welfare. The discussion on the prospective COMESA-CET have not yet been finalized, but top rates of up to 40 per cent are under consideration, and sensitive products might receive even higher protection (COMESA, 2005). Hence, COMESA integration bears risks for Uganda.
complementarity between exports and imports of two countries, to one hundred, which implies a perfect match. The higher the index between two countries, the greater the product complementarity.
[image:17.612.89.519.242.533.2]On the importing side, Uganda shows high complementary with Egypt and Kenya, and moderately high values for exports to Mauritius, Seychelles, and Egypt (Table 7). But for most country pairings, the values for COMESA complementarity fall short of those for well established, successful regional trade initiatives, such as the European Union (index value of 53.4) and the North American Free Trade Agreement (56.3). The potential for beneficial trade exchange within the region, hence, seems limited, while high external trade barriers suggest a substantial risk of trade diversion to occur.
Table 7: Bilateral Complementarity Indices in COMESA, 2003
Importer B u ru n d i C o m o ro s E g y p t E th io p ia Ken y a Ma lawi Ma u ritiu s Ma d ag ascar R wan d a Sey ch elles Su d an Ug a nd a Z am b ia Z im b ab we Exporter
Burundi … 5.2 9.6 1.7 3.6 3.7 5.6 3.0 4.9 9.8 5.3 3.8 2.0 2.4 Comoros 4.4 … 8.8 4.6 5.5 5.2 5.0 5.2 4.8 12.3 7.2 5.4 4.8 5.9 Egypt 42.1 24.0 … 46.4 44.5 44.4 45.8 52.1 46.3 29.4 35.0 46.6 38.7 63.9 Ethiopia 5.2 7.7 15.4 … 5.8 5.3 9.5 8.0 8.8 12.5 9.9 6.2 5.1 3.6 Kenya 37.8 23.6 33.8 40.2 … 44.0 38.5 47.1 44.1 31.6 32.1 41.9 35.3 51.3 Malawi 7.1 7.7 13.8 7.6 7.8 … 9.3 7.9 10.3 14.0 12.1 9.1 8.1 6.6 Mauritius 10.3 9.1 13.6 10.3 9.9 11.3 … 11.6 11.6 15.6 11.1 12.0 10.3 8.9 Madagascar 17.4 13.4 22.2 14.0 15.5 18.9 38.8 … 19.6 24.6 18.6 18.4 17.2 13.9 Rwanda 1.9 1.5 6.8 1.6 2.5 2.2 2.5 1.8 … 9.1 4.9 2.0 1.9 2.6 Seychelles 4.4 2.4 11.4 3.1 3.3 2.7 6.7 3.4 3.2 … 3.4 2.8 3.4 3.5 Sudan 16.1 8.2 14.0 20.4 20.6 21.2 20.6 28.5 17.2 13.6 … 19.3 12.4 45.8
Uganda 17.7 17.3 24.8 17.8 17.9 21.1 25.8 19.1 19.3 25.1 21.1 … 17.7 14.8
Zambia 11.4 12.1 17.8 11.3 12.0 12.9 19.3 12.2 15.0 18.6 12.8 12.3 … 11.9 Zimbabwe 13.9 12.5 16.8 10.5 10.8 14.0 18.4 10.5 14.3 14.1 14.2 14.2 9.1 …
Note: The product complementarity index Cjk between two countries j and k is defined as Cjk = 100 - ∑i(|Mik-Xij|/2), where Xij represents the share of good i in total exports of country j and Mik represents the
share of good in total imports of country k. Indices for Angola, the Democratic Republic of the Congo, Djibouti, and Eritrea were not computed because of lack of data.
Source: Khandelwal, 2004.
While further quantitative analysis of the economic effects of regional integration initiatives in Eastern and Southern Africa seems warranted, the available evidence suggests that there is considerable uncertainty about whether the existing regional agreements are in the best economic interest of Uganda and its partner countries in the region. The authorities should try to
maximize the benefits from Uganda‟s RTAs by pursuing deeper integration through
of economic cooperation that can contribute to the achievement of the country‟s overall development strategy, but that can not be a substitute for continuing domestic policy reform and multilateral trade liberalization.
2.3 Overlapping Membership in Regional Agreements
EAC and COMESA are not the only regional integration initiatives in Eastern and Southern Africa. In fact, there are four major regional trade arrangements in this part of the world and almost all countries in the region have become members of several agreements, creating a regional configurations of overlapping preferential arrangements (Figure 3). Some observers argue that countries could maximize the benefits from regional integration by
participating in several arrangements simultaneously (Lyakurwa at al., 1997). Liberalizing trade
within smaller groups facilitates the coordination and harmonization of national policies, and makes it possible to increase competition for sensitive domestic industries at a more measured pace. Multiple agreements also open up alternative liberalization tracks that provide countries with flexibility to switch their integration focus in the event that progress within a particular grouping were to stall. Moreover, since aid agencies frequently provide funds for region-wide projects, participation in multiple regional arrangements might be seen as a means to fully exploit the potential pool of donor-funds.
On the other hand, there are significant drawbacks. Since each of the agreements involves different partners, different rules of origin, different tariff schedules, and different implementation periods, effectively administrating the multiple regional integration efforts can pose major political and technical challenges and increase trade transactions costs. These consequences from overlapping agreements are bound to intensify as many of the existing arrangements are scheduled to deepen their integration by moving from preferential agreements to free trade areas or customs unions.
Multiple membership of overlapping RTAs creates demanding requirements in several respects. In the private sector, traders have to operate within different trade regimes, each with its own tariff rates, regulations and procedures. For example, non-coordination amongst regional arrangements concerning transit bonds has been cited by private sector representatives as a significant impediment (Charalambides, 2005). In the border services, customs officials have to deal with different rules of origin, trade documentation, and statistical nomenclatures, thereby multiplying internal procedures and paperwork. And on the political level, negotiating and serving different regional initiatives can absorb large amounts of scarce administrative resources and occupy policymakers‟ attention to a considerable extent. This concerns, in particular, the preparation, attendance, and follow-up of meetings of technical experts or ministers. At times, integration efforts are duplicated and counterproductive competition between countries and
regional institutions – including with respect to dispute resolution – can emerge (UNECA, 2004).
In addition, budgetary contributions from member states towards the administration costs of the various RTAs can be a significant burden, as indicated by the cumulative (annual) arrears in membership contributions in SADC and COMESA (Kritzinger-van Niekerk and Moreira, 2002).
2.3.1 Conflicting Integration Schemes
SADC are also hoping to form customs unions in the medium-term future. Since one country can not realistically apply two different common external tariffs, let alone implement the customs and fiscal integration (e.g. revenue-sharing) that are basic components of fully functioning customs unions, Uganda and its EAC partners are sooner or later bound to face the choice about which agreement they want to go with.
Another type of problem from overlapping RTA-membership relates to conflicting commitments and potential trade deflection. The COMESA Treaty (Article 56.2) states that “Nothing in this Treaty shall prevent a Member State from maintaining or entering into new preferential agreements with third countries provided such agreements do not impede or frustrate the objectives of this Treaty and that any advantage, concession, privilege and favour granted to a third country under such agreements are extended to the Member States on a reciprocal basis.” The SADC Trade Protocol (Article XXVIII, paragraph 2) contains a similar provision Since upon joining the EAC customs union, Uganda (and Kenya) granted market access preferences to Tanzania that exceed those given to its COMESA partners, the literal reading of the provisions implies the requirement to extend the EAC free intra-regional trade benefits also to all COMESA and SADC countries.
Yet, after deliberating on the matter, the EAC Council decided not to extend the EAC market access benefits to other COMESA and SADC partners. However, the EAC members were allowed to continue with their existing obligations to SADC and COMESA and imports from the respective countries were exempted from the EAC‟s common external tariff. This continuation of member-specific preferences within the customs union could result in trade deflection, unless border controls are maintained for strict intra-EAC policing of trade, notably verification of rules of origin. Otherwise, Egyptian traders, for example, could export goods to Uganda under COMESA preferences and the local importers could then ship them duty free on to Tanzania under the EAC regime. Conversely, SADC members could use Tanzania as a transit route to Kenya and Uganda. To counter any unintended extension of preferences, border controls will need to continue. Indeed, as long as the situation of overlapping membership remains, the EAC will not be able to become a fully functioning customs union and its members will not be able to reap the benefits of free internal movement of goods.
Over the past years, SADC, COMESA and the EAC have been working more closely together in areas such as regional trade analysis, capacity building, and transport facilitation. So far the economic integration schedules and the move towards freer intra-regional trade have not resulted in any major inconsistencies. Yet, the formation of the EAC customs union and the possibly resulting problems of trade deflection highlight the emerging integration conflicts, as the individual trade initiatives deepen their status.
2.3.2 Rules of Origin
One issue that deserves particular attention in the context of overlapping agreements is the potentially significant trade transactions costs that can result from the need to comply with multiple rules of origin (ROO) regulations (Brenton and Imagawa, 2004). Preferential trading agreements use ROOs to ensure that third countries do not unduly benefit from the preferential treatment that members of a RTA grant to one another. They specify the amount of processing that a product must undergo in partner countries in order to quality for market access under the preferential agreement. These rules can add considerable complexity to the trading process and augment the costs of international trade, in particular if the ROOs vary across different agreements.
EAC-ROO are to a large extent based on the EAC-ROO used in COMESA, which specify a local value addition requirement of 35 per cent or a change in tariff heading. But for a number of tariff lines, more complex, sector and product-specific SADC rules of origin, which are more restrictive and more difficult to handle, were adopted. This situation with different rules of origin in EAC, SADC, and COMESA may pose problems for firms in EAC members that want to trade with neighboring countries and force them to adjust their production or trade operations. For example, firms might be compelled to focus on only certain export destinations, given that they might need to produce differently in order to receive preferential access in different foreign markets.
Moreover, companies not only have to comply with the rules on sufficient domestic processing, but also need to obtain a certificate from the competent authorities that proves compliance. Within North America, the costs of providing appropriate documentation to prove origin have been estimated to amount to as much as 3 per cent of import value (Anson et al.,
2005). These costs might well be even higher for small-scale firms in developing countries that do not have sophisticated accounting procedures in place in order to keep track of the geographical origin of their production inputs. If such firms are then confronted with ROOs that vary across different agreements, the effort of showing compliance can become prohibitively expensive.
Strict and complex ROO might also inhibit firms to integrate into global or regional production networks. Indeed, it has been argued that ROO can be trade diverting and can
“export” protection from one trading partner, who imposes strict ROO, to another, who adjusts
local production patterns accordingly (Krueger, 1997). In particular, producers faced with restrictive ROOs and the prospect of benefiting from preferential tariffs might well turn away from low-cost, third country suppliers of intermediate inputs and towards highly protected, high-cost suppliers located in the partner country, thereby increasing their production high-costs and making them less competitive in the global market (Krishna and Krueger, 1995).
Multiple origin schemes also place a burden on the administrative capacity of the customs services. A recent world-wide survey of customs agencies in member countries of the World Customs Organization sought information on the role of customs in issuing and checking certificates of origin and requested the views of customs officials on their experiences of administering ROOs (Brenton and Imagawa, 2004). Almost half of all respondents stated that overlapping agreements with differing ROO created problems, and of the respondents from Africa, more than two-thirds agreed with the statement that overlapping ROO were problematic.
In addition, there are issues of integrity. The existence of different rates of import duty from different countries provides incentives for false invoicing, so as to show origin in the country subject to lower duties. Also, situations at the border may arise that are open to abuse or subject to excessive bureaucracy, thereby inflicting costs on traders in addition and beyond those related to compliance with the applicable ROO regulations.
3. ACCESS TO GLOBAL MARKETS
Even taking into account that official statistics do not reflect informal trade with
neighboring countries, the majority of Uganda‟s imports and exports are undertaken with trade
On the export side, the situation is more complex. Uganda‟s total world export market
share is small and amounts to less than 0.01 per cent. Moreover, many of Uganda‟s traditional
export products, such as coffee, tea, tobacco and cotton, have shown below average world market export growth during the early 2000s, so that the country‟s established export sectors are shrinking in relative terms. In this context, diversification into new export products with more dynamic demand in overseas markets is of central importance in order to maintain and enhance export performance.
[image:21.612.95.524.267.591.2]Indeed, Uganda has made considerable progress in diversifying its exports. The Herfindahl index of export concentration shows a declining trend both for the type of products exported and the foreign partner countries (Figure 5). The shift towards more broadly based export products and partners was particularly pronounced during the second half of the 1990s, but appears to be continuing.
Figure 5: Concentration of Exports, 1995-2004
(Herfindahl index)
0.0 0.1 0.2 0.3 0.4 0.5
1995 1996 1997 1998 1999 2000 2001 2002 2003 2004 Product concentration (HS 4-digit level)
Partner country concentration
Note: The Herfindahl index H is calculated as the sum of the squares of partner country/product line market shares: H = ∑i si2 , where sirepresents the share of partner country/product line i in total exports.
Lower values imply less concentration. Source: UN COMTRADE database.
3.1 Trade Barriers in International Markets
Another avenue to foster diversification is the pursuit of opportunities in previously underexploited markets. In some cases, Ugandan exporters might face significant policy-generated trade barriers that might explain their low export intensity. The tariff barriers that
Uganda‟s main export crops face can indeed be considerable (Table 8). The duties claimed on
imports of fish fillets, coffee, tea, tobacco, and cotton, which together account for more than half of Uganda‟s exports, tend to be particularly high in medium income countries. For example, Mexico levies a 30 per cent tariff on fish fillets, India charges import duties of 100 per cent on coffee and tea, Sri Lanka has 75 per cent tariffs on tobacco, and China asks cotton importers to pay duties of 47 per cent. Import duties on these products in industrialized countries are generally much lower and of a single digit magnitude, with the exception of fish and tobacco in the European Union, tea in Japan, and notably tobacco in the United States. Moreover, industrialized countries grant least developed countries, such as Uganda, preferential market access (see below), so that Ugandan exporters only pay the full MFN-duties if their shipments do not qualify for preferential treatment, perhaps due to problems of showing compliance with rules of origin requirements.
Moreover, a team of analysts in the World Bank‟s Research Department has recently estimated a measure of aggregate barriers faced by exporters in foreign markets (Kee, Nicita, and Olareagga, 2005). This Market Access Overall Trade Restrictiveness Index (MA-OTRI) corresponds to the uniform tariff that if imposed by all trading partners on exports of a particular country would leave overall exports of that country unchanged. The indicator aggregates information on tariff and non-tariff barriers, and takes unilateral, bilateral and regional market access preferences into account. It is derived through econometric estimation, based on a new set of import demand elasticities (Kee, Nicita and Olareagga, 2004).
Table 8: Simple Average of MFN Barriers on Uganda’s Main Exports in Potential Partner Countries, 2004
Fish fillets (HS 0304)
Coffee (HS 0901)
Tea (HS 0902)
Tobacco (HS 2401)
Cotton (HS 5203)
Argentina .. 11.5 .. .. ..
Australia 0.0 0.0 0.0 0.0 0.0
Bangladesh .. .. .. .. 0.0
Brazil 11.5 .. .. .. ..
Brunei .. .. .. .. 0.0
Bulgaria .. 13.2 .. 27.5 ..
Canada 0.0 0.0 0.0 .. 2.5
Chile .. 6.0 6.0 .. ..
China 13.9 13.2 15.0 10.0 47.2
Colombia 20.0 .. .. 11.7 ..
Croatia 10.0 6.3 .. 11.3 ..
Cuba 10.0 .. .. .. ..
Dominican Republic 20.0 .. .. .. 0.0
European Union 10.9 5.3 0.8 14.5 0.0
India .. .. 100.0 .. 30.0
Indonesia 5.0 .. .. 5.0 5.0
Israel 0.0 0.0 0.0 .. 0.0
Japan 4.4 6.0 11.7 0.0 0.0
Kenya 0.0 0.0 15.0 20.0 ..
Macedonia .. 14.0 .. .. ..
Mali .. .. 10.0 .. ..
Mexico 30.0 52.4 .. 51.1 10.0
New Zealand 0.0 3.3 0.0 .. ..
Pakistan .. .. 17.5 25.0 ..
Paraguay .. .. .. 14.1 ..
Peru .. .. .. 12.0 ..
Romania 23.2 9.0 .. 46.7 0.0
Russian Federation 10.0 5.0 5.0 5.0 0.0
Saudi Arabia 5.0 0.0 1.5 .. 5.0
Senegal .. .. 10.0 5.0 ..
Singapore 0.0 0.0 0.0
Sri Lanka .. .. 27.5 75.0 0.0
Switzerland 0.0 0.0 0.0 0.0 ..
Tunisia .. 28.3 44.0 29.0 0.0
United States 1.0 0.0 1.6 58.3 4.8
Vietnam .. .. .. 27.5 0.0
Note: (..) means that the country is not among the world‟s top-twenty importers of the respective commodity. For the European Union, data for 2003 are reported and specific duties are converted into ad valorem equivalents. For the Russian Federation, data for 2002 are reported.
Source: UNCTAD Trains database.
imports of unprocessed goods, often from low-income countries, which are then transformed in the importing country under high protection. For the raw material exporter this tariff escalation means that value-addition before exports is discouraged, as processed products face high tariff barriers in foreign markets. Hence, the diversification process into higher value-added production activities is impeded.
Figure 6: Tariff Escalation for Selected Products, 2004
(MFN tariffs in per cent)
0 5 10 15 20 25 30 35 40 45 50 55 60 Chin a Euro pean Uni on Indi a Japan Uni ted St
ates China
Euro pean Uni on Indi a Japan Uni ted St
ates China
Euro pean Uni on Indi a Japan Uni ted St
ates
Raw material Semi-processed Processed
Fish & products Tobacco & products
350
Cotton & products
Note: For the European Union, data for 2003 are reported. The categorization of products as unprocessed, semi-processed and processed goods follows the MTN (Multilateral Trade Negotiations) classification of the World Trade Organization. For tobacco, no semi-processed products exist in the MTN classification. Source: UNCTAD Trains database.
It should be noted that preferential access for developing countries to high-income country markets will tend to neutralize the effects of escalatory MFN-tariff regimes in these countries. However, in many cases, rules of origin provisions on processed goods are more complicated or more difficult to meet than the rules on raw materials of unfinished products (Carrere and de Melo, 2003). For example, it has been estimated that the costs of compliance for food products are more than twice as high as those for agricultural commodities (OECD, 2005).
Such “rules of origin escalation” will tend to have qualitatively the same adverse effects on
developing countries‟ efforts to shift into higher value-added production as tariff escalation.
3.2 Impact of Trade Preferences in Industrialized Country Markets
As mentioned earlier, Uganda‟s exporters benefit from reduced-tariff access to
industrialized country markets under preferential treatment schemes, such as the Generalised
System of Preferences (GSP), the European Union‟s Cotonou Agreement and Everything But
The extent of duty reductions, product coverage, and rules of origin specifications differ across the various arrangements (Box 3), but the largest benefits in all of the arrangements accrue to least developed countries, like Uganda. The potential advantages for Uganda of these preferential arrangements are considerable, since the country ships most of its exports to preference granting partners.
The actual value of the preference schemes to individual developing countries depends on several factors. Obviously, preferences are valuable only if there is a positive preference margin
over non-eligible countries‟ supplies, that is if the importing country has non-zero MFN-duties in
the tariff lines of interest. Moreover, the value of preferences depends on the costs involved in showing compliance with rules of origin requirements. If these costs exceed the MFN-duty, exporter will not bother to ask for preferential treatment, but pay the tariff. Finally, the extent of benefits from preferential market access are a function of the volume of goods the country is allowed to export to the target market, for example under preferential tariff rate quotas. Hence, three factors play a crucial role: the available preference margin, the costs of showing compliance with rules of origin requirements, and quantitative limits, including those originating from insufficient supply capacities in the exporting country.
In 2002, the total value to Uganda of preferential market access in the European Union, Japan, and the United States is estimated to amount to USD 10.5 million (Table 9), or 2.2 per cent
of total export value (or 0.015 per cent of Uganda‟s GDP). Almost all of these benefits are due to
preferences in the EU market. Most imports into the EU were thereby using ACP rather than EBA-preferences, due to the less strict rules of origin of the former. The average preference margin obtained on all exports to the three markets amounted to 8.5 per cent. For individual products, the preference margin was even more important and commercially interesting. For example, for some Ugandan exports of seafood products to the EU, the preference margin amounted to 21 per cent of the import value.
Box 3: Major Preferential Market Access Programs
The Generalised System of Preferences is based on the 1979 Enabling Clause that created a permanent waiver to the most-favoured-nation provision in the General Agreement on Tariffs and Trade. Under GSP, selected products originating in developing countries are granted non-reciprocal preferences in the form of reduced or zero tariff rates. Least developed countries receive preferential treatment for a wider coverage of products and deeper tariff cuts. GSP schemes represent unilateral preferences that differ in their design and duration across preference granting countries. The following entities currently operate GSP schemes: Australia, Belarus, Bulgaria, Canada, the European Community, Japan, New Zealand, Norway, the Russian Federation, Switzerland, Turkey and the United States of America.
The Cotonou Agreement of 2000 between the EU and 77 African, Caribbean and Pacific countries provides preferential access to the EU market in addition to and beyond GSP. The Agreement grew out of the Lomé Convention that governed the relations between the EU and its former colonies in the ACP region from 1975 until 2000. It grants comprehensive market access preferences and allows partners to count the value-added in imports from other ACP countries as
local input when determining the origin of a product (“full cumulation”). However, the EU has
exempted bananas, beef, and sugar from the preferential access arrangements. The Agreement has been concluded for twenty years, with a clause allowing for revision every five years. In 2008, the present market access preferences are supposed to be replaced by arrangements to be agreed upon in Economic Partnership negotiations.
The EU‟s Everything But Arms initiative of 2001 grants duty-free access to imports of all
products from least developed countries, except to arms and munitions. Only imports of bananas, rice and sugar were not fully liberalised immediately. Duties on those products will be gradually reduced until duty free access will be granted for bananas in January 2006, for sugar in July 2009 and for rice in September 2009. In the meantime, there are duty free tariff quotas for rice and sugar. The EBA provisions have been incorporated into the EU‟s GSP scheme. The rules of origin of the latter allow in four regions in the Caribbean, East Asia, Latin America, and South Asia that intermediate inputs from regional partners are counted as local value-added, if the degree of prior transformation of the inputs would have conferred origin in the regional partner
country (“diagonal cumulation”) . Outside these regions, only imported inputs from the EU can
be counted towards local value-added (“bilateral cumulation”). The regulation on EBA foresees
that the special arrangements for LDC's are to be maintained for an unlimited period of time.
Table 9: Preference Utilization in Major Markets, 2002
(USD and per cent)
Agriculture Manufacturing All Goods
Imports into the EU, Japan and USA
Total shipments 233 410 554 39 827 861 273 238 415 Dutiable trade (MFN>0) 130 113 171 2 840 619 132 793 202 Trade eligible for trade preferences 121 175 465 2 839 894 124 015 360 Trade requesting trade preferences 120 026 100 362 475 120 388 575 Share of eligible trade requesting preferences 99.1% 12.8% 97.1% Potential value of preferences 10 738 401 99 347 10 837 748 Value of preferences actually requested 10 519 493 18 272 10 537 765 Preference utilization rate 98.0% 18.4% 97.2%
Potential preferential margin 8.9% 3.5% 8.7%
Realized margin on trade eligible for preferences 8.7% 0.6% 8.5% Imports into the EU
Total shipments 205 569 125 38 387 140 243 956 265 Dutiable trade (MFN>0) 121 144 403 2 677 008 123 821 411 Trade eligible for trade preferences 121 144 403 2 677 008 123 821 411 Trade requesting trade preferences 120 013 594 343 095 120 356 689 Share of eligible trade requesting preferences 99.1% 12.8% 97.2% Potential value of preferences 10 736 861 81 041 10 817 902 Value of preferences actually requested 10 518 893 17 449 10 536 342 Preference utilization rate 98.0% 21.5% 97.4%
Potential preferential margin 8.9% 3.0% 8.7%
Realized margin on trade eligible for preferences 8.7% 0.7% 8.5% Imports into Japan
Total shipments 14 103 806 440 385 14 544 191 Dutiable trade (MFN>0) 8 953 536 4 522 8 958 058 Trade eligible for trade preferences 15 831 4 522 20 353
Trade requesting trade preferences 0 0 0
Share of eligible trade requesting preferences 0.0% 0.0% 0.0%
Potential value of preferences 475 167 642
Value of preferences actually requested 0 0 0
Preference utilization rate 0.0% 0.0% 0.0%
Potential preferential margin 3.0% 3.7% 3.2%
Realized margin on trade eligible for preferences 0.0% 0.0% 0.0% Imports into the USA
Total shipments 13 737 623 1 000 336 14 737 959 Dutiable trade (MFN>0) 15 232 159 089 13 733 Trade eligible for trade preferences 15 232 158 364 173 596 Trade requesting trade preferences 12 506 19 380 31 886 Share of eligible trade requesting preferences 82.1% 12.2% 18.4% Potential value of preferences 1 066 18 138 19 204 Value of preferences actually requested 600 823 1 423
Preference utilization rate 56.3% 4.5% 7.4%
Potential preferential margin 7.0% 11.5% 11.1% Realized margin on trade eligible for preferences 3.9% 0.5% 0.8% Notes: The value of preferences is calculated by multiplying the value of imports by the margin between MFN and preferential tariff rates. For the USA, data averages for 2002 and 2003 are used.
In cross-country comparison, Uganda‟s preference utilization in its main export market, the European Union, was very high and exceeded the rate achieved by most other countries in Eastern and Southern Africa (Figure 7). Hence, Ugandan exporters seem to be able to meet the requirements for preferential treatment on a consistent basis. There might, of course, be cases in which the market access conditions are so demanding that exporters do not (or no longer) try to serve the European market, but direct their supplies elsewhere right away. But given the relatively high preference utilization rates, lack of domestic supply capacities might well be more of a constraint to export growth than barriers in the European market.
Figure 7: Preference Utilization Rates in the EU Agriculture and Food Market, 2002
(Per cent of eligible, non-zero duty trade that received preferences)
0 10 20 30 40 50 60 70 80 90 100 Rwanda
Eritrea Sudan Burundi Comoros Djibouti Ethiopia Somalia Swaziland DR Congo Seychelles Malawi Kenya Madagascar Botswana Zambia Mozambique Namibia Mauritius Tanzania Zimbabwe UGANDA Angola Lesotho
Average for all of Africa
Source: OECD, 2005.
Since 2002, there has been one important shift in Uganda‟s preference utilization. This
Table 10: US Imports from Uganda, 2002-2005
(„000 USD)
2002 2003 2004 2004 (Jan-Jun)
2005 (Jan-Jun) Total US Imports from Uganda 15 229 36 392 30 957 17 170 14 967 - Non-AGOA 15 165 33 374 20 663 11 914 10 579
- AGOA 32 1 509 5 147 2 628 2 194
-Agriculture 13 30 1 008 1 008 15
- Textiles 0 1 433 4 009 1 585 2 162
- Other 19 46 130 35 17
Source: United States Department of Commerce.
However, it is unclear whether Uganda has a comparative advantage in apparel production, given the scarcity of locally produced yarn and fabric that is of appropriate quality and competitively priced. Current exports to the United States make use of the special, very liberal rules of origin requirements under AGOA, which allow Ugandan exporters to utilize low-cost fibre from Asian suppliers in their US-bound production. If these rules were tightened, as seems likely with the termination of the special rule for lesser developed countries in September 2007, it is questionable whether the Ugandan apparel export industry would remain viable.
The Government of Uganda (GOU) has actively tried to encourage companies to exploit opportunities under AGOA and has extended considerable political and financial support to the apparel export industry in its efforts to serve the US market. There have been recent press reports
(“Ugandan Company to Export Steel to US”, The Monitor, Oct. 17th, 2005) that GOU is also
supportive of attempts to launch stainless steel exports to the US in order to benefit from AGOA. A steel plant is reported to have invested USD 10 million to upgrade and expand its facilities in order to satisfy US quality standards. Ugandan exports would benefit from a preference margin of about 30 per cent on their stainless steel shipments under AGOA, which is considerable. However, steel production is a very capital intensive activity, so that it is unclear whether Uganda has a long-term comparative advantage over other competitors in steel production and whether there would be any significant employment creation effect from the investments.
3.3 Negotiations of an Economic Partnership Agreement
Many of the preference granting programs that benefit developing countries are limited in duration and are subject to periodic review. As a result of such a review, the EU‟s preferences for its ACP partners were renewed in the Cotonou Agreement of 2000. At the same time, it was decided to amend the relationship between the EU and ACP countries and change the existing trade preferences from non-reciprocal to reciprocal in order to ensure full compliance with provisions under the WTO agreement. The conclusion of the intended economic partnership agreements (EPAs) is likely to have major impacts on the ACP countries (Hinkle and Schiff, 2004).