Towards Unsupervised and Consistent High
Dimensional Data Clustering
R. G. Mehta
Associate Professor Computer Engineering Dept.
S.V. National Institute of Technology
N. J. Mistry
Professor Civil Engineering Dept. S. V. National Institute of
Technology
M. Raghuwanshi
Principal Rajiv Gandhi College of Engineering & Research
ABSTRACT
The boosted demand for immense information, the enhanced data acquisition and so do the size and number of dimensions of data is a big challenge for the data mining algorithms. Clustering exercise to collect the data with same characteristics together, for better performance of knowledge based systems. High dimensional and large size data results in declined performance of existing clustering algorithms. PROCLUS is an efficient high dimensional clustering algorithm; consist of significant issues like inconsistency in results and expert supervised subspaces. MPROCLUS: a modified PROCLUS algorithm is proposed, aimed at improving the running time and consistency as well as the unsupervised selection of the parameter like, average number of dimensions. The promising and consistent results of MPROCLUS has open the sky wide open for further research for usage of MPROCLUS in stream Data Mining.
General Terms
High dimensional data clustering
Keywords
High dimensional clustering, Unsupervised and consistent clustering, PROCLUS
1.
INTRODUCTION
In recent years, the dramatic rise in the use of the web and the improvement in communications in general have transformed our society into a strongly information dependent where huge amount of data containing important information is accumulated. Extracting meaningful and useful, novel knowledge from existing sources of information is a key development area to unlock yet unknown relationships between specific data point. The field of data mining is developed as a means of extracting knowledge from huge databases to discover hidden, unknown and significant patterns or concepts that are not evident. Clustering is one an unsupervised data mining process, concerned with grouping together objects that are similar to each other and dissimilar to the objects belonging to other groups. Here groups are identified as clusters. The objective of clustering is to maximize similarity between records within the same cluster, and minimize that between records of different clusters.
The data used in recent knowledge based applications deals with two major issues: high dimensionality and large volume. Specially designed high dimensional clustering processes give solution to these issues at certain level. For analyzing high dimensional data set, there are many challenges like feature selection, curse of dimensionality, redundancy reduction, data labeling and the specification of similarity in high dimensional space. PROCLUS is one of the very efficient;
subspace clustering from the well of high dimensional clustering algorithms [1]. It exploits k-medoid based partitioning, initiated with random seed for the cluster centers. In PROCLUS, problem of high dimensionality is addressed by requiring the user to specify a subset of dimensions (i.e. subspace) for cluster analysis. But, user driven input is an error-prone process because without extensive analysis of the complete data, it is difficult to know the correlation among the dimensions to identify the clusters. The random seed selection of k-medoids results in inconsistent clustering.
This research proposes Modified PROCLUS (i.e. MPROCLUS) algorithm to addresses mainly the issue of user driven subspaces and inconsistent clustering due to random initial seed for the process. The superior results compared to the PROCLUS; motivate to extend the research work for the stream data clustering
The paper is organized as follows. Extensive literature survey for subspace clustering is done in section:2, followed by proposed MPROCLUS in section:3. Implementation methodology and performance analysis is explored in section:4. The results are summarized and future research scope is described in section 6.
2.
LITERATURE SURVEY
Traditional data clustering algorithms considers the data as a whole during clustering. Many clustering algorithms exist to clusterify the dataset with their own issues and benefits [1]. They exhibit efficiently with comparatively small sized data. When the dimensionality increases from a few dozens to hundreds or thousands of dimensions, the execution time of these traditional clustering algorithms will rise exponentially. The need of multiple scanning of whole data will also spoil the efficiency with large volume of data. As the recent applications use very high dimensional data, the extensive survey is performed for high dimensional clustering algorithms, especially PROCLUS and other projected clustering algorithms [2] [3].
In high dimensional data analysis one of the major issue is of irrelevant dimensions, as it is found that the clustering tendency will be lost with non correlated attributes. M.A. Hall, and G. Holmes have proposed that the attribute selection is the best approach to address the problem of selecting irrelevant attributes [4]. Another significant issue is curse of dimensionality. C. C. Agarwal et al. have highlighted that the distance between the instances will be insignificant while dimensions are increased [5].
advantages of partitional clustering algorithms like efficiency, low memory requirement, and guaranteed k-clusters. The inaccurate user input for the average number of relevant dimensions can deteriorate the result accuracy seriously. Like many top-down methods, PROCLUS suffers biasing toward hyper-spherical clusters. The user input for the number of dimensions for subspaces restricts the subspace size and form non-overlapping partitions of the dataset with possible outliers. ORCLUS an extended version of PROCLUS was proposed by same authors [6], looks for non-axis parallel subspaces, but user defined number of clusters and the size of the subspace dimensionality extends the PROCLUS restriction in this algorithm too and use of random sampling results in many small clusters. ORCLUS is more robust than PROCLUS in handling datasets with dependent attributes. The initial error due to random seeding is reduced by forming a larger number of initial clusters. Yip et al. proposed a hierarchical clustering algorithm: HARP [7]. It is able to automatically determine the relevant attributes of each cluster without requiring any hard-to-determine user parameters. Similar to ORCLUS, HARP is not suitable for small dataset with less number of dimensions. HARP can produce each cluster with different number of attributes. K.G. Woo et al proposed FINDIR: a Fast and Intelligent Subspace Clustering Algorithm using Dimension Voting, uses a unique distance measure called the Dimension Oriented Distance (DOD), produces clusters in subspaces of varying size [8]. The DOD measure is dependent on the ε threshold and has significantly increased the running time of the algorithm, but sampling helps to improve performance, especially with very large datasets.
Though PROCLUS enjoys the inherent advantages of partitional clustering algorithms like efficiency, low memory requirement and guaranteed k clusters, it suffers from major restrictions due to strict user bound subspace and threshold for the z-score used in cluster refinement phase. The initialization phase suffers from the random selection of k-medoids results in inconsistent clustering results [9].
Proposed MPROCLUS algorithm addresses mainly the issue of user-bound-dimension and inconsistency in the clustering quality. The complete framework for the high dimensional clustering is proposed.
3.
PROPOSED MODIFIED PROCLUS
ALGORITHM
PROCLUS is a partitional clustering algorithm based on k-medoids. The algorithm proceeds in three phases. Initialization phase, iterative phase and cluster refinement phase. During Initialization phase, k medoids are drawn randomly. In iterative phase each of the selected medoids, is assigned a set of “neighbours”, which are records closer to it than its nearest medoid. In the cluster refinement phase, the neighbours of a medoid are used to score the d dimensions of it based on the z-score. After calculating all k×d scores for all medoids, a total of k×l dimensions with the best scores will be selected (l is a user-parameter representing the average number of relevant dimensions per cluster), with a constraint that each cluster must select at least two dimensions. Each record in the dataset is then assigned to the cluster with the medoids closest to it using the Manhattan distance statistics. The clusters are scored using normalized average intra-cluster distance from centroid. Clusters with too few records will be discarded and the medoids replaced by some other records, and a new iteration starts, If the new iteration does not give a better score, the old set of medoids will be restored, and a anew iteration starts. The clustering process will stop when
the best set of medoids remains unchanged for a number of iteration
In this research novelSeedGeneraton(), the task for automatic; deterministic seed generation is proposed. The Updation in Cluster refine algorithm for initialization phase of PORCLUS is described in the ModifiedFindDimension().
3.1
Automatic dimension selection
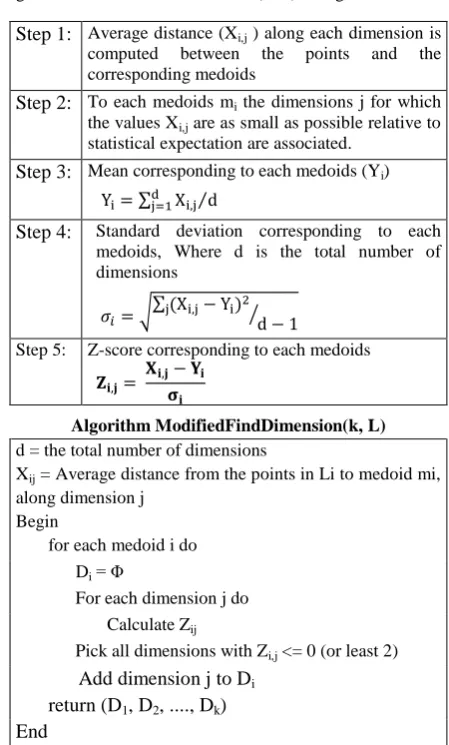
PROCLUS makes use of Z-Score to decide the subspace dimensions. In the following procedural steps, Zi,j shows the association of j-dimensional average distance associated with the medoid mi(Yi) and average Manhattan segmental distance associated with the same medoid. A negative value of Zi,j indicates that along dimension j the points considered are more closely correlated to the medoid mi.
Z score is calculated as described below followed by the algorithm ModifiedFindDimension(k, L) in Figure 1..
Step 1: Average distance (Xi,j ) along each dimension is
computed between the points and the corresponding medoids
Step 2: To each medoids mi the dimensions j for which
the values Xi,j are as small as possible relative to
statistical expectation are associated.
Step 3: Mean corresponding to each medoids (Yi)
Step 4: Standard deviation corresponding to each medoids, Where d is the total number of dimensions
Step 5: Z-score corresponding to each medoids
Algorithm ModifiedFindDimension(k, L) d = the total number of dimensions
Xij = Average distance from the points in Li to medoid mi,
along dimension j Begin
for each medoid i do Di = Φ
For each dimension j do Calculate Zij
Pick all dimensions with Zi,j <= 0 (or least 2)
Add dimension j to Di
return (D1, D2, ...., Dk)
[image:2.595.314.539.258.631.2]End
Fig. 1: Modified Find Dimension Algorithm
to the process of clustering, hence allowing the subspaces to have adaptive size considering the characteristic of data.
3.2
Removing inconsistency (randomness)
of PROCLUS
The PROCLUS algorithm has another limitation, which is the inconsistency in the output. When running PROCLUS, different results are produced, out of which some shows good quality of clusters and some shows bad quality of clusters. The reason for the issue is randomness in seed generations and initial seed selection for clusters.
In the proposed modified PROCLUS algorithm, a novel determinant initial seed point generation process is proposed. The Algorithm is described in Figure2.
Algorithm NovelSeedGeneration()
1. 2. 3. 4. 5. 6. 7.
Begin
For All n instances
Sum of all features of a record, Which becomes the key for the record.
Sort the records in order of key values.
For n initial medoids, the data is divided in n+1 equal partitions
Set of initial medoids are generated by picking first instances of every partition.
end
Fig. 2:Initial Seed Points Generation Algorithm The number of samples required is far less than the number of records. Hence the conflict of running out records is avoided. The algorithm is implemented and tested on various datasets, discussed in the next section.
4.
IMPLEMENTATION AND TESTING
The data is prepared for the clustering algorithm after process of missing value replacement, normalization and unique id is added to each instance for the following procedural stages. PROCLUS and MPROCLUS are executed for all datasets listed in Table 1. The execution time of both the approaches is depicted in Table 2. As MPROCLUS needs extra computational efforts to generate initial medoids and dimension selection of subspace but compared to computation time of other two stages it is negligible, so there will be marginal difference in execution time.
PROCLUS generates inconsistent clusters for same data with same initial set up, at every instances of the application. For the analysis PROCLUS I is applied on the same data, with same initial set up multiple time and derived average inter cluster distance and average intra cluster distance for each instance. Inter cluster distance is calculated by finding the average distance between the instances in one cluster with all instances in another cluster. Averaging all these distances will result in average Inter-cluster distance. Average Intra-cluster distance is another significant measures used to find the dissimilarity within the clusters. It is calculated by finding average distance between the samples within the clusters. As smaller the value of the average intra-cluster distances, closer the instances of the cluster. The smaller value of an intra cluster distance is expected. But usually expected trade of between these two criteria is not achieved, and ratio of the inter cluster and Intra cluster distance is used to measure the clustering accuracy. The higher value is desired for better clustering results.
Average inter-cluster distances of the clusters generated using the PROCLUS algorithm and the proposed modified PROCLUS algorithm are compared. From test, the worst case and the best case results are derived out of 10 iterations. Average of best and worst case results are used for batter comparison. Ratios of average inter cluster distance and average intra cluster distance is calculated for both methods. MPROCLUS is applied to same data once as it produces constant clusters to retrieve the specified results.
[image:3.595.320.538.235.350.2]In order to implement the proposed approach any dataset with numerical continuous attributes can be used. Better clustering quality can be achieved if the randomness in the dataset is minimal. For comparison, four datasets are considered from UCI open source data repository [10], detailed as in Table 1.
Table 1: Datasets used in the experiment Dataset
ID.
Dataset name Number of instances
Number of dimensions 1 MAGIC Gamma
Telescope
19020 11
2 Wine Quality 4898 12
3 Page Blocks Classification
5473 10
4 Breast Cancer Wisconsin (Diagnostic)
569 32
5.
PERFORMANCE ANALYSIS
For analyzing the performance two criteria are considered, Execution time and Clustering Accuracy. This section describes the results obtained for various test for the datasets listed in Table 1.
5.1
Execution Time Analysis
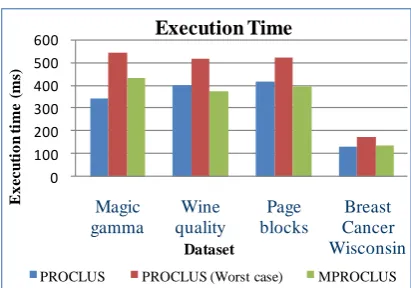
[image:3.595.321.535.479.579.2]As described in the previous section, PROCLUS is applied multiple time on each dataset listed in Table 1. The highest execution time taken by PROCLUS is noted in column 3 of table 2. The Average Execution time is mentioned in column 2 of table 2. The same way execution time of MPROCLUS is depicted in column 4 of table2.
Table 2: Execution time Analysis
1 2 3 4
Dataset ID.
PROCLUS PROCLUS (Worst Case )
MPROCLUS
1 340.73 542.63 433.10
2 399.85 515.52 374.47
3 414.53 518.59 396.68
4 133.05 173.65 135.63
[image:3.595.325.531.600.744.2]The Graph for the same data is depicted in Figure 3
Fig. 3: Execution time Analysis 0
100 200 300 400 500 600
Magic gamma
Wine quality
Page blocks
Breast Cancer Wisconsin
E
x
e
c
u
ti
o
n
t
im
e
(
m
s)
Dataset
Execution Time
It can easily be derived from the graph that along with the major advantage of consistent clusters, execution time for MPROCLUS is far superior compared to the worst case of PRCLUS and it is outperforming for almost all the datasets.
5.2
Average Inter-cluster distance
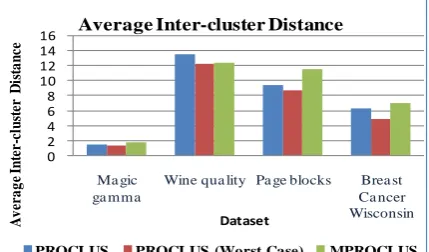
[image:4.595.322.537.77.203.2]The average inter-cluster distances for PROCLUS and MPROCLUS are depicted in Table 3. One of the significant criteria for measuring cluster quality is Inter-Cluster distance, which is an average distance between ea The higher value of inter cluster distance for the MPROCLUS algorithm compared to the results of PROCLUS proves the superiority of MPROCLUS over PROCLUS.
Table 3: Average Inter-cluster distance analysis
1 2 3 4
Dataset ID.
PROCLUS PROCLUS (Worst Case )
MPROCLUS
1 1.48 1.27 1.65
2 13.50 12.15 12.33
3 9.35 8.62 11.48
4 6.25 4.75 6.98
[image:4.595.54.281.215.301.2]For better understanding, the results are shown graphically in Figure 4. Where outperforming results of MPROCLUS is seen.
Fig. 4 : Average Inter cluster distance Analysis
5.3
Average Intra-cluster distance
[image:4.595.59.276.353.501.2]Average Intra-cluster distance is one of the measures used to find the dissimilarity within the clusters. A smaller value of the average intra-cluster distance is preferred as it shows that the points within the clusters are close together.
Table 4: Average Intra-cluster distance analysis
1 2 3 4
Dataset ID.
PROCLUS PROCLUS (Worst Case )
MPROCLUS
1 1.32 1.39 1.16
2 0.92 1.01 0.97
3 0.53 0.67 0.60
4 4.63 4.65 4.45
Fig. 5: Intra Cluster distance Analysis
The Average intra cluster distance analysis for PROCLUS and MPROCLUS is depicted in table 4. The graph of Figure 5 depicts almost similar results for MPROCLUS compared to PROCLUS for all 4 datasets.
5.4
Average ratio of inter cluster distance
vs. Intra cluster distance
[image:4.595.319.540.384.479.2]As higher inter cluster distance and lower intra cluster distance is expected. But normally both at the same is not achieved advantageously. To achieve better comparison; the ratio of Inter Cluster Distance vs. Intra cluster distance is calculated and results are depicted in Table 6.
Table 5: Average Intra-cluster distance analysis
1 2 3 4
Dataset ID.
PROCLUS PROCLUS (Worst Case )
MPROCLUS
1 1.12 0.91 1.42
2 14.67 12.03 12.71
3 17.64 12.87 19.13
4 1.35 1.02 1.57
The higher value of this ratio is desirable for the betterment of the clustering algorithm. Result of Table 5, and Figure 7 shows the superior results of MPROCLUS over PROCLUS.
Fig.6: Average Inter cluster / Intra Cluster Distance
6.
CONCLUSION
Modification to the PROCLUS, a projected clustering algorithm for high dimensional data is proposed in this research work, named MPROCLUS. In MPROCLUS, the novel process, to generate initial seed for k medoids, is proposed and implemented to remove inconsistency in the clustering result due to the traditional random selection 0
2 4 6 8 10 12 14 16
Magic ga mma
Wine quality Page blocks Breast Ca ncer Wisconsin
A
v
e
r
a
g
e
I
n
te
r
-c
lu
st
e
r
D
is
ta
n
c
e
Dataset
Average Inter-cluster Distance
PROCLUS PROCLUS (Worst Case) MPROCLUS
0 2 4 6 8 10 12 14 16
Ma gic ga mma
Wine qua lity Pa ge blocks Brea st
Ca ncer Wisconsin
A
v
er
a
g
e
In
te
r-cl
u
st
er
D
is
ta
n
ce
Dataset
Average Inter-cluster Distance
PROCLUS PROCLUS (Worst Case) MPROCLUS
0 5 10 15 20 25
MAGIC Gamma
Wine Quality Page Blocks Classification
Breast Cancer Wisconsin
Average cluster distance ratio
[image:4.595.318.539.523.667.2] [image:4.595.55.281.589.677.2]process for the same. The user defined size of the subspace is also prone to error in PROCLUS, which is tackled by the proposed updation in FindDimension() process of PROCLUS Outperforming accuracy of clustering along with a significant advantage of non random clusters with dynamic subspace dimensions rather than user define static dimensions, are motivating for further research in this area.
7.
REFERENCES
[1] Vaishali, P. and Rupa, M., “Modified k-Means Clustering Algorithm”, Computational Intelligence and Information Technology(2011),Vol. 250, 307-312 [2] Aggarwal, C. C., Joel, L. W., Philip, S. Yu, Cecilia, P.,
and Jong, S. P., "Fast algorithms for projected clustering." A CM SIGMOD international conference on Management of data (May 1999), 28(2), 61-72
[3] Hans-Peter, K., Peer K., and Arthur, Z. “Clustering high dimensional data: A survey on subspace clustering, pattern based clustering, and correlation clustering” ,ACM Transactions on Knowledge Discovery from Data (April 2009), 3(1)
[4] Hall, M., A., and Holmes, G. "Benchmarking attribute selection techniques for discrete class data mining", IEEE Transactions on Knowledge and Data Engineering (Nov 2003), 15(6), 1437-1447
[5] Aggarwal, C., Hinneburg, A. and Keim, D. "On the surprising behavior of distance metrics in high dimensional space". Database Theory -- ICDT 2001, Springer, .420-435
[6] Aggarwal, C., and Philip S. Yu., "Finding generalized projected clusters in high dimensional spaces". Proceedings of the 2000 ACM SIGMOD international conference on Management of data(Feb 2000), 70-81 [7] Kevin, Y. and David W. ,"Harp: A practical projected
clustering algorithm." , IEEE Transactions on Knowledge and Data Engineering(Nov 2004), 16(11), 1387-1397
[8] Woo, K., Lee J. and Kim, M. "FINDIT: a fast and intelligent subspace clustering algorithm using dimension voting." Information and Software Technology(March 2004), 46(4), 255-271, 2004
[9] Bharat T., Rupa M., “A Novel Approach For High Dimensional Data Clustering”, LAP LAMBERT Academic Publishing, 2012