http://dx.doi.org/10.4236/msa.2015.610092
How to cite this paper: Ferreira, A.F., Tomaskewski, I.M.S., Paradela, K.G., da Silva, D.M. and Sales, R.C. (2015) Numerical Simulation of Microstructural Evolution via Phase-Field Model Coupled to the Solutal Interaction Mechanism. Materials Sciences and Applications, 6, 907-923. http://dx.doi.org/10.4236/msa.2015.610092
Numerical Simulation of Microstructural
Evolution via Phase-Field Model Coupled
to the Solutal Interaction Mechanism
Alexandre Furtado Ferreira*, Ingrid Meirelles Salvino Tomaskewski, Késsia Gomes Paradela, Dimas Moraes da Silva, Roberto Carlos Sales
Graduate Program on Metallurgical Engineering, Graduate Program on Mechanical Engineering, Federal Fluminense University, Volta Redonda, Brazil
Email: *[email protected]
Received 3 July 2015; accepted 27 October 2015; published 30 October 2015
Copyright © 2015 by authors and Scientific Research Publishing Inc.
This work is licensed under the Creative Commons Attribution International License (CC BY).
http://creativecommons.org/licenses/by/4.0/
Abstract
A phase-field model coupled to the multiphase/multiscale model is used to simulate the micro-structural morphology and predict the CET during solidification. The considered mechanism for the CET is based on interactions of solute between the equiaxed grains and the advancing colum-nar front. The results for the solute concentration in liquid region, dendrite tip velocity, volume fraction of the liquid and solid are presented and discussed. The phase-field model is used to si-mulate the dendritic morphology of an alloy directionally solidified, by imposing a constant tem-perature gradient. The simulation of the equiaxed grains growth requires a further important element, the growth of grains with different crystallographic orientations. The grain orientations are generated randomly for each nucleus introduced in computational domain. Finally, the coupl-ing results between the multiphase/multiscale model and phase-field are presented and discussed. For higher nuclei density present in the melt, a shorter distance between mold wall and the equiaxed zone in the solidification process can be observed. A solute concentration boundary layer exists in the liquid along the columnar grain contour. The concentrations in the solid indi-cate the presence of a microsegregation pattern. The simulated results show that the solidification features are consistent with those observed based on the metallographic examinations of cast mi-crostructures reported in the literature.
Keywords
Columnar-to-Equiaxed Transition, Directional Solidification, Al-Cu Alloy
1. Introduction
indus-trial users who are always on the lookout for better-performing materials. In this present study, the microstruc-tural evolution and competitive growth from onset of solidification process in Al-0.013 mol% Cu alloy under a constant cooling rate are simulated. A phase-field model coupled to the multiphase/multiscale model is used to simulate the morphology of columnar grains and equiaxed and predict the columnar-to-equiaxed transition (CET) during solidification of said binary alloy. It is in this general framework that the present study is developed, with a focus on Al-Cu binary alloy and phase-field model coupled to the multiphase/multiscale model implemented via finite differences method in the explicit form.
2. Governing Equation
First of all, we present the governing equations the multiphase/multiscale model. This model is used to predict the CET. Then, equations of phase-field model are presented and discussed.
2.1. The Multiphase/Multiscale Model
The governing equations are based directly as in [3] and [13]. Therefore, the equations are only briefly described, followed by detailed comments on the features of the present model. To separate the various regions present in dendritic solidification, three phases are defined within a representative elementary volume (REV): solid (s), in-terdendritic liquid (d), and extradendritic liquid (l). The volume factions are introduced in the model as follows:
1
s l d
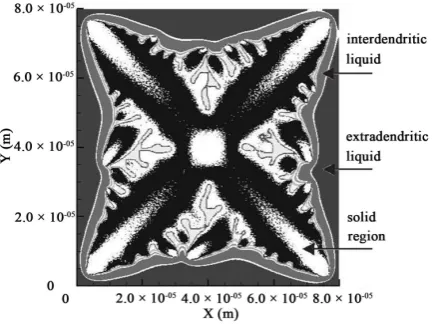
ε + +ε ε = (1) where εs is solid, εl is the extradendritic liquid and εdrepresents the interdendritic liquid. As shown in Figure 1, the inter- and extradendritic liquids are separated by a grain envelope that is a smooth surface extending around the dendrite tips.
The grain envelope volume fraction is defined as εg =ε εs+ d = −1 εl. The internal solid volume fraction can be defined as εsi =ε εs g . When the internal solid fraction is unity, the equiaxed grains are said to be globulitic (i.e., fully solid globules). The interdendritic liquid is associated with the relatively small length scale of the spaces between the dendrite arms inside the envelope and is assumed to be solutally well mixed at the liquidus concentration ( *
l
C ) given by the phase diagram at the temperature T. The extradendritic liquid, on the other hand, is associated with the larger length scale. When its average solute concentration (Cl) is below *
l
C , the extraden-dritic liquid is undercooled. It is this undercooling that primarily drives the denextraden-dritic growth. Due to solute re-jection by the growing dendrites/grains into the finite extradendritic liquid, Cl can become greater than C0 (initial
[image:3.595.204.423.542.704.2]concentration). The presence of a solute profile in the solid in Figure 1 reflects the fact that the mass diffusivity of the solid (Ds) is much smaller than that of the liquid (Dl), this results in incomplete solute diffusion in the solid. In fact, back-diffusion in the solid is neglected in the present study for the multiphase/multiscale model. For the one-dimensional system considered in the present study used to predict the CET during solidification of Al-Cu binary alloys, the interdendritic liquid solute and extradendritic liquid solute can be written, respectively, as in [3] [13]
(
)
* *(
*)
01 s l l
l d e l l
e
C D
k C S C C
t t
ε ε
δ
∂ ∂
− = + −
∂ ∂ (2)
(
l l)
* l l(
*)
l e l l
e
C C S D C C
t t
ε ε
δ
∂ ∂
= + −
∂ ∂ (3) where k0 is the solute partition coefficient and Se represents the envelope area of grains. The last term in
equa-tion (2) and (3) accounts for diffusion of solute from the dendritic growth into the undercooled extradendritic liquid. The δe represents the diffusion length and it is discussed in greater details in [3]. The previous equations are coupled by the liquidus line of a binary equilibrium phase diagram, i.e.,
* f l l T T C m −
= (4)
where Tf is the melting point of the pure metal, and ml is the liquidus line slope. Then, Equation (2) can be
solved for the solid fraction, εs, and Equation (3) provide the average solute concentration in the extradendritic liquid, Cl. The following equation is used to calculate the grain (or extradendritic liquid) volume fraction:
g l e S V t t ε ε ∂ ∂ = − =
∂ ∂ (5) where V is the dendrite tip velocity [14]
(
)
(
( )
)
* *
2
0 1
4 D m kl l 1Cl
V Iv
Г
σ − −
= Ω (6)
where σ*≈1 4
( )
π2 is the stability constant [3], Г is the Gibbs–Thomson coefficient, and Iv−1 is thein-verse of the Ivantsov function, which can be approximated by the following equation [13]:
1.195 1 0.4567
1 Iv− = Ω
− Ω
(7) The dimensionless undercooling (Ω) is defined as
(
)
* * 0 1 l l l C C C k − Ω =− (8) Note that in Equation (8) the undercooling is defined relative to average solute concentration in the under-cooled extradendritic liquid
( )
Cl [3]. The previous works [11] [12] used instead the initial composition( )
C0 to determine the undercooling for dendrite growth. Others works [8] and [13] adopted Cl for equiaxed growth, but C0 for columnar growth. As proposed in the [3] Cl for both equiaxed and columnar growth. This differ-ence constitutes the main new feature of the present model; it is discussed in more detail in [3]. The spacing between the equiaxed envelopes is governed by the equiaxed grain density (n), whereas the columnar envelope spacing is determined by the primary dendrite arm spacing (λ1). The following expressions are used to obtain afirst-order estimate of the characteristic half spacing (Rf) in the two types of growth:
equiaxed: 1 3 3 4π f R n
= and columnar: Rf =λ1 2 (9)
As proposed in [3], it is assumed that nuclei appear instantaneously at a liquid region undercooled. Another issue in modeling the solute diffusion into the extradendritic liquid is the shape of the dendrite envelopes. As in [13] is assumed a spherical shape for the equiaxed grain envelopes and a cylindrical shape for the columnar en-velopes. In this present study, we adopted a simpler method, where the basic envelope shape is spherical for both columnar and equiaxed growth. While this approximation may seem inadequate for columnar growth, it was verified to result in only minor differences in results [3]. This way, the spherical envelope shape is intro-duced in the model as in [13]:
(
)
2 33 1 l
e f S R ε −
The envelope diffusion length (δe) is calculated as a function of the envelope Peclet number (Pe), from
(
3 3)
2 23 ee f e e e d d
e e
r P R
P r R
e e
e f e R R
R r r r
R R R r
δ ′ − ′ = ′ −
∫ ∫
(11)where the instantaneous envelope radius (Re) is given by.
(
)
1 31 e
l f
R
R = −ε (12) The Equation (11) differs slightly from the one proposed in [13], its derivation and a closed-form analytical solution are provided in details in the [3]. The main new feature of the model proposed in [3] is that both the equiaxed and columnar dendrite growth velocities are controlled by a solutal undercooling proportional to the difference between the local liquidus concentration and the local average solute concentration in the extraden-dritic liquid (Equation (8)). At least for columnar growth, all other models [7] [8] [11]-[13] [24] used the initial alloy composition C0 instead of Cl in the dimensionless undercooling. Governing equations of phase-field model
are presented in the following section.
2.2. The Phase-Field Model
In phase-field models, the state of the domain is customarily represented by a distribution of the single variable known as the “order parameter” or “phase-field variable,” here represented by the Greek letter φ. In this present study, it is assumed that the solid state corresponds to a value of +1 for the order parameter, while, in the liquid region, φ is taken to be 0. The region through which φ decreases from +1 to 0 is defined as the solid/liquid inter-face [35]. For simulation of microstructures in binary alloys during solidification, we used two equations: one for solute concentrations, the other for the phase field itself [25].
( )
( )
(
(
)
)
(
)
(
)
2 2 1 1
1
1 1
e
S L
e
m L S
c c
RT
wg h n
M tφ ε φ φ V φ c c
− −
∂ = ∇ − ′ + ′
∂ − − (13)
The evolution of the solid region with time
(
∂ ∂φ t)
is assumed to be proportional to the variation of the free energy functional with respect to the order parameter, φ. The terms of the phase equation are derived from this free energy functional, which must decrease during any solidification process [17]. In Equation (13), M quanti-fies the phase-field mobility. The product ε2∇φ is a diffusivity term. The next component of the equation,( )
wg′ φ , factors in the excess free energy arising from surface tension around the interface. The last product on the right-hand side translates the driving force behind the solidification process. Here, R is the gas constant; T is the temperature and Vm, the molar volume. The arguments to the natural logarithms, e
S
C and e L
C are, respec-tively, the equilibrium concentration in the solid and liquid regions. While, the respective ordinary concentra-tions in the liquid and solid region are denoted, by pair, CLand CS. The h′
( )
φ is the derivative of the so-called “smoothing” function [26], to be defined later. The solute concentrations in both regions are calculated with the solute transport equation [25], numbered (14).( )
{
(
1( )
)
(
1) ( ) (
1)
}
ln(
)
1 L
L L S S
L
c
c D h c c h c c
t φ φ φ c
∂
= ∇ ⋅ − ⋅ − + ⋅ − ∇
∂ − (14)
In this equation D(φ) is the solute diffusivity in the solid and in the liquid regions. The model carried out, takes into account solute diffusivity in the liquid and in the interface regions. The “smoothing” function h(φ) and the function g(φ), which models the surface tension effect around the interface, are defined as [17]
( )
3(
10 15 6 2)
h φ =φ − φ+ φ (15)
( )
2(
1)
2third terms in Equation (13) be nonzero. Moreover, a commonly resorted way of including anisotropy in the model is to regard ε in Equation (13) as dependent on a so-called “growth angle”, θ. The growth angle reflects the orientation of the normal to the interface with respect to the x axis, i.e., the longitudinal interface advance direction [16]:
( )
θ 0{
1 εcos j(
θ θ0)
}
ε =ε +δ − (17)
where δε gauges the anisotropy. The value j controls the number of preferential growth directions. For example, with j = 0 we shall be looking at a perfectly isotropic case, while j = 4 is indicative of a dendrite with four pre-ferential growth directions. Orientation of the maximum-anisotropy interface is identified by the θ0 of Equation (17). Furthermore, ε0 in that equation, and w in Equation (13) are model parameters associated with interface energy (σ) and thickness (2λ), respectively, according to the following expressions [27]:
3 2 w
ε
σ = (18)
2 2.2 2
w
ε
λ= (19)
(
)
2 , 1 2 e e m e S L e iV m c c
RT k M D w
σ ε
β ξ
ε
= −
− (20)
(
)
(
)
2 1( )
( )
(
)
( )
( )
(
)
(
)
0
1 d
,
1
1 1 1
e e e e
S L L S S e L e
m L L S S
h h
RT
c c c c
V h c c h c c
φ φ φ
ξ φ φ φ φ − = − × − − − + −
∫
(21)where me is the slope of the liquidus line at equilibrium, ke is the equilibrium partition coefficient, Di is the dif-fusion coefficient in the interface region, and the kinetic coefficient, β, is defined to be the inverse of the usual linear kinetic coefficient, µ.k.. For the binary alloy system, we use the same parameters shown in the [22]. To
simulate growth of an asymmetrical dendrite, it is necessary to introduce a noise term on the right-hand side of Equation (13), the phase-field equation. A usual expression for this noise is [1]
(
)
22
noise 16= arφ 1−φ (22) with “r” a random number between −1 and +1. The “a” parameter is the noise amplitude. Maximum noise cor-responds to φ = 0.5, at the center of the interface, whereas at φ=0 (liquid region) and φ = 1 (solid region) there occurs no noise. That is to say, noise is generated at the interface. The Equations (13) and (14) were solved nu-merically. They were discretized on uniform grids using an explicit finite scheme.
3. Results and Discussions
The main objective of the present work is to propose a numerical simulation of microstructure evolution by phase-field method coupled to the solutal interaction mechanism for the columnar-to-equiaxed transition (CET). First of all, we show results of the CET model, and then, results obtained by phase-field method are presented, and finally the results of coupling between CET model and phase-field. Simulations in this present study are carried out disregarding the energy equation and instead imposing the following linear temperature profile:
( )
0T t =T T− (23) where T0 is the initial temperature and T represents a constant values for cooling rate. Table 1presents the
physical properties of the binary alloy (Al-Cu) used in the computations that follow.
3.1. Results of Multiphase/Multiscale Model
Table 1. Physical properties of Al-Cu alloy.
diffusivity in liquid region, Dl (m2∙s−1) 3 × 10⁻⁹
diffusivity in solid region, Ds (m2∙s−1) 3 × 10⁻¹⁸
slope of liquidus line, me (K∙mol−1) 672
partition coefficient, ke (−) 0.14
liquidus temperature, TL (K) 923
Gibbs-Thomson coefficient, Γ (m∙K) 2.41 × 10⁻⁷
molar volume, Vm (m3∙mol−1) 1.095 × 10⁻⁵
tion (9), these nuclei densities give the following characteristic half-spacings for the equiaxed grains, respec-tively: Rf = 10 and 3 mm. Figure 2 shows the temporal evolution of the equiaxed grain volume fraction (εg) in the that cases, together with the temperature variation. The present work and literature [3] data are plotted for comparison (Figure 2). When compared the present work results and with those in [3], one can see an excellent quantitative agreement between them. It is useful to first focus on the curves corresponding to the largest nuc-leus densities, n = 2.4 × 10+5 m–3. One can see from Figure 2 that grain growth is initially very slow, until about
200 seconds, which can be attributed to the small values of the envelope area concentration (Se) in Equation (10). Starting at 200 seconds, the grains undergo a period of rapid growth until the grain volume fraction (εg) reaches values of about 0.95 at 350 seconds. This rapid increase in grain volume fraction (εg) can be attributed to Se in Equation (10) and to the solutal undercooling in Equation (8) for the dendrite tip velocity simultaneously reach-ing larger values. The time when the solutal undercoolreach-ing (Ω) in Equation (8) reaches a negligibly small value and dendritic growth ceases is marked as an asterisk in Figure 2. This asterisk is labeled “CET” and, indicates that if columnar grains were present, they would stop growing too. A similar result is obtained for the case with nucleus densities equal to 8.8 × 10+6 m–3, except that the undercooling dissipates earlier due to the somewhat
larger values of Se at early times. Also, the maximum equiaxed grain fraction, corresponding to the time when
the undercooling vanishes, is about 0.7.
Through of numerical example (Figure 2), the sensitivity of the columnar-to-equiaxed transition (CET) with the nucleus density is demonstrated. Figure 3 shows the solute concentration in both the interdendritic and extradendritic liquid during the solidification process.
Figure 3 shows the corresponding variations in the liquid solute concentrations during the solidification
process. One can see solute concentration in extradendritic liquid
( )
Cl increases very fast to the interdendritic liquid concentration( )
*l
C at around 350 seconds, i.e., the undercooling dissipates within a few seconds for nucleus densities (n) equal to 2.4 × 10+5 m−3. On the other hand, when the nuclei density is 8.8 × 10+6 m−3, the
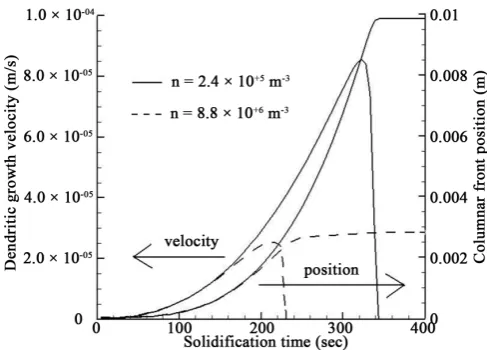
solutal under-cooling dissipates in about 260 seconds. When solutal under-cooling reaches a negligibly small value, this means that not only the equiaxed dendritic growth stops, but also the columnar growth, in this situa-tion we can determine the columnar-to-equiaxed transisitua-tion (CET) in solidificasitua-tion of Al-0.013 mol% Cu alloy. The main feature of the CET model is that both the equiaxed and columnar dendrite growth velocities are a function of a solutal under-cooling proportional to the difference between the local liquidus concentration and the local average solute concentration in the extradendritic liquid, in Equation (8). Figure 4 shows both the co-lumnar front position (zt+Δt) and said growth velocity (V) during the solidification process.
The two different cases shown inFigure 4 illustrate why the present model can result in different CET pre-dictions. Both cases are characterized by same temperature gradient and alloy composition, but different colum-nar front velocities. For n = 8.8 × 10+6 m−3 case, the equiaxed grain density is relatively large, as would case if
an inoculants (grain refiner) had been used, one can see from Figure 4the grain growth until about 220 seconds, after that, the velocity of front columnar decreases fast to the zero, indicating that CET has already occurred. For n = 2.4 × 10+5 m−3 case, the curve profile is similar to the previous case, i.e., one can see for said case that the
columnar front velocity is initially very slow until 40 seconds, after this, the velocity undergo a abrupt increase until reaches a maximum value of about 8.5 × 10⁻⁵ m/s at 320 seconds, then decreases to zero, it indicates that
Figure 2. Effect of the equiaxed nuclei densities (n) on the columnar-to-equiaxed transition (CET) of an Al-0.013 mol% Cu alloy cooled at a constant rate
(
T=0.005 K s)
.Figure 3. Variation of the extradendritic and interdendritic liquid concentration during the solidification time.
[image:8.595.190.434.527.702.2]knowledge of the columnar front position is needed in order to decide which equation to use to calculate the characteristic half-spacing (Rf). The model results indicate that the CET occurred when the columnar front
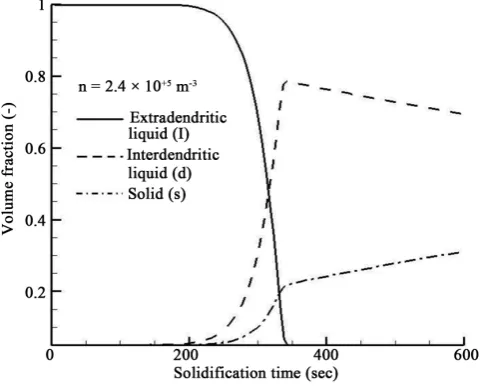
posi-tion has a maximum and the velocity of the columnar front is almost zero (Figure 4). Figure 4shows the tem-poral evolution of the extradendritic liquid (l), solid (s) and interdendritic liquid (d) calculated for the 2.4 × 10+5
m−3 case. One can see that, until about 200 seconds the control volume is totally extradendritic liquid. As said
liquid decreases both the solid and interdendritic liquid increases until about 350 seconds. At the 350 seconds, the equiaxed grains have enough time to reach a sufficiently high volume fraction to block the columnar grains growth. In this time, the extradendritic liquid fraction (l) becomes very small and the control volume is almost totally solid (s) and interdendritic liquid (d). Starting at 350 seconds, the solid fraction keeps the growth, while interdendritic liquid (d) decreases, i.e., from that time the interdendritic liquid (d) becomes solid. An interesting behavior concerning progress of solidification can be observed through results in Figure 5, the interdendritic liquid (d) is the last to solidify, because the rejected solute from solid enriches the interdendritic liquid (d) and it decreases the liquidus temperature. That blocking between grains is the CET, and the result in Figure 5 is in agreement with those of Figure 2.
In this subsection, we present the results for numerical simulation of solutal interaction mechanism for the columnar-to-equiaxed transition. The results obtained by phase-field model are presented in the following sub-section.
3.2. Phase-Field Model Results
To calculate the governing equations, there are seven unknown values. Three of them are phase-field parameters. W and ε are determined by solving Equations (18) and (19) simultaneously. Since the phase-field mobility is a function of temperature, it should be calculated with the temperature during the computation. The values of so-lute concentration in liquid, cL, and solid, cS, are also required; they are determined from Equation (14)
depend-ing on the values of φ and c at each point and every time step. The governing Equations (13) and (14) above are solved numerically, using a finite-difference scheme. In the calculations, the system temperature is uniform and continuously decreased with a constant cooling rate from the initial temperature (T0), which is slightly lower
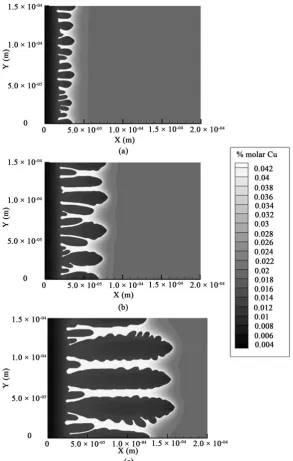
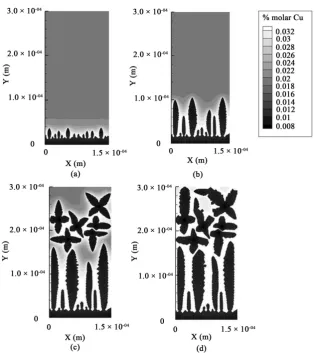
[image:9.595.193.436.500.693.2]than the liquidus temperature of the Al-Cu alloy. We analyze columnar growth in a two-dimensional system. The phase field model is used to calculate the alloy directionally solidified from left to the right side of compu-tational domain, by imposing a constant temperature gradient in an undercooled melts system. Solidification in the presence of walls is of great practical importance. In casting, solidification usually starts by heterogeneous crystal nucleation on the walls of the mold. Those crystals that grow from mold walls are known as columnar dendritic grains. The concentration field, growth and selection of columnar dendritic grains with constant cool-ing rate equal to 0.005 K/s for Al-0.013 mol% Cu are shown in Figure 6. In the said figure, the gray scale
Figure 6. Simulation of the advancing of the columnar front with a cooling rate of 0.005 K/s. (a) early stage of arm growth, t = 0.062 sec; (b) arm growth and selection, t = 0.083 sec; (c) coarsening of arm, t = 0.200 sec.
represents solute concentration, while the white represents the concentration of the segregated copper from solid to liquid region. The copper concentration in solid is much less than that of copper in liquid. All the columnar dendritic grains are growing from left surface but the shapes of the arms are different from each other due to the imposed noise by Equation (22). In this simulation, a fine solid layer was added to left side of the domain bou n-daries.
co-lumnar spacing occurs sequentially. In the phase-field model, initial solid seeds are physically selected to grow or shrink. It should be observed that the spacing between columnar grains depends on the competitive growth of grains during solidification. During the beginning of the solidification process, the competitive growth between columnar grains is more intense and the spacing between them is narrow. The competitive growth of grains be-comes less intensive with the advance of the columnar grains into the liquid region. In this present simulation, the competitive growth and selection of columnar grain are successfully reproduced. With the exception of ex-tremely pure materials, even nucleation in the bulk liquid happens mostly via a heterogeneous mechanism, i.e., on the surface of suspended foreign particles. This way, particulate additives are widely used as grain refiners to reduce grain size by enhancing the nucleation rate. Most functional and structural materials consist of an assem-bly of small grains of different orientations, which can vary in size from few nanometers to several hundred mi-crons, the physical properties of polycrystalline materials are strongly influenced by them. In order to simulate the growth of equiaxed grains, the phase-field model also has been used to address problems with multi-den- dritic growth into liquid region with a constant cooling rate equal to 0.005 K/s and initial temperature of 922 K
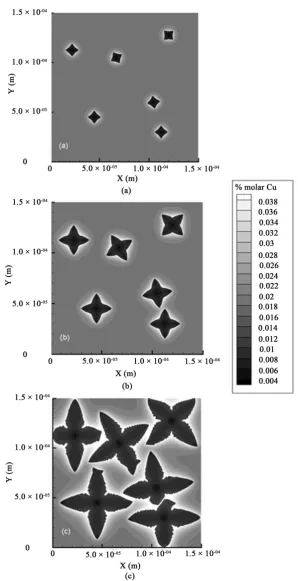
(Figure 7). Simulation of the equiaxed grains growth requires a further important element, the growth of
equiaxed grains with different crystallographic orientations. Nuclei of same size were artificially introduced in computational domain to mimic the nucleation in the liquid region. The grain orientations between 0 and +1 are generated randomly for each nucleus introduced in computational domain. The growth process of six dendrites is shown in Figure 7. The snapshots correspond to the growth time of 3.4 × 10⁻³ sec, 8.8 × 10⁻³ sec, and 2.38 ×
10–2 sec are shown in Figures 7(a)-(c). The equiaxed grains grow faster along the crystallographic orientations.
At the early stage, as shown in Figure 7(a) and Figure 7(b), the equiaxed grains with different orientations grows freely and independently. In Figure 7(c), with increase of time, the grains begin to coalesce and impinge the adjacent grains. The advanced equiaxed grains in Figure 7(c) grow and other grains stop advancing or slightly melt back.
The competitive growth of these grains during solidification process can be observed. Due to the solute redi-stribution from solid to liquid region, the interdendritic liquid just ahead of the interface always has a composi-tion greater than liquid region distant of solid-liquid interface. While the copper concentracomposi-tion in solid region is the lowest, the highest concentration corresponds to the interdendritic liquid. The simulation patterns of dendrit-ic growth shows typdendrit-ical equiaxed grains structure, and comparing these simulations (Figures 7(a)-(c)), one can see that the equiaxed grains structure is very sensitive to the competitive growth. The results of the coupled models are showed in the following subsection.
3.3. Results of Coupling between the Multiphase/Multiscale Model and Phase-Field Model In spite of phase-field models being suitable for simulating solidification processes, they suffer from low com-putational efficiency. For example, for computation of a dendrite with side-branches, i.e. secondary and tertiary arms, the computational domain should be discretized into one millions points. Thus, the computational stability condition in an explicit finite scheme can be guaranteed only with a very small time step [18]. From Figure 2, one can see that the columnar-to-equiaxed transition (CET) occurs earlier for high nuclei density. For this reason, we increased artificially the nuclei density (n = 8.4 × 10+12 and 24.8 × 10+12 m−3), in order reduce the
solidifica-tion time and consequently the computer run time. With the increase in nuclei density in the bulk liquid, more equiaxed grains are nucleated. This, in turn, leads to a finer grain size in casting. Grain refinement by inocula-tion involves addiinocula-tion of particles which can act as substrates for heterogeneous nucleainocula-tion. Inoculainocula-tion is par-ticularly widely practiced in the aluminium industry [28]. Figure 8 shows the profile of grain volume fraction (εg) versus solidification time, in which the columnar-to-equiaxed transition (CET) can be determined. Despite of the profiles for the two cases are qualitatively similar (Figure 2 and Figure 8). Quantitatively, it can be an-ticipated than the columnar-to-equiaxed transition (CET) occurs earlier when the Al-Cu alloy has a higher nuclei density present in the melt.
For nuclei density equal to 8.4 × 10+12 m–3, one can see that columnar-to-equiaxed transition takes place at 0.2
seconds. On the other hand, for a value equal to 24.8 × 10+12 m–3, the columnar-to-equiaxed transition takes
place earlier to the 0.13 seconds. This transition times are input data for phase-field model, the results are showed to following.
Figure 7. Simulation of the multiple dendrite growth of Al-Cu binary alloy under cooling rate of 0.005 K/s. (a) early growth stage of the equiaxed grains, t = 3.4 × 10⁻³
sec; (b) the equiaxed grains grow freely and independently in the liquid region, t= 8.8 × 10⁻³ sec; (c) finally, the impingement on one another equiaxed grain with
Figure 8.The grain volume fraction versus solidification time, for a nuclei density equal to 8.4 × 10+12 and 24.8 × 10+12 m−3.
[image:13.595.156.472.338.692.2]the computational domain before simulation. The fine solid layer becomes unstable in a supercooled domain, with branching advancing into the liquid region (Figure 9(a)). One can see that some grains grew from solid layer and only few long columnar grains succeed in growing due to the competitive nature of the growth (Figure 9(b)). Figure 9(c)shows the formed equiaxed grains in random directions in the liquid region ahead of the columnar zone, in this way, the advance of the columnar front is blocked by the equiaxed grains. That way, the columnar grains shall have their growth inhibited and the columnar-to-equiaxed transition (CET) can be de-termined. The concentration field during grain growth is depicted in that figure. In the picture, the color scale represents solute concentration; so to speak, the white represents the concentration of the segregated solute from the solid to the liquid region, while the dark gray is the solute concentration in the solid region. Note that the solute concentration is higher between dendrites/grains. Due to solute rejection by the growing dendrites/grains into the liquid region, the extradendritic liquid concentration (Cl) becomes equal to interdendritic liquid
concen-tration (Cl∗) (Figure 9(c) and Figure 9(d)). Figure 10 illustrates the microstructure evolution during the
colum-nar-to-equiaxed transition (CET) for a nuclei density equal to 24.8 × 10+12 m−3. For the said density, the
colum-nar-to-equiaxed transition takes place at 0.13 seconds, which is determined by multiphase/multiscale model, as previously indicated in Figure 8.
Through comparison between Figure 9 and Figure 10, which presents the dendritic morphology during the solidification process for an Al-0.013 mol% Cu alloy, one can see before columnar-to-equiaxed transition (CET), the two-dimensional simulations presents columnar dendrites similar (Figure 9(a) and Figure 10(a)). However, after columnar-to-equiaxed transition (CET), Figure 10(c) and Figure 10(d)show smaller columnar dendrites, as expected, for a higher nuclei density present in the melt, at a shorter distance between mold wall and the equiaxed zone. The simulated results showed that the solidification features are consistent with those observed based on the metallographic examinations of cast microstructures reported in the literature [31] [32] and [34].
During the solidification process the extradendritic liquid (l) decreases, while both solid (s) and interdendritic liquid (d) increase gradually through that period. After the columnar-to-equiaxed transition (CET), the said in-terdendritic liquid begins to solidify, suggesting that solidification process approaches its ending (Figure 5). In response to columnar-to-equiaxed transition (CET), the extradendritic liquid concentration (Cl) increases very rapidly to interdendritic liquid concentration (Cl∗) (Figure 3), while growth velocity of columnar grains
ap-proaches zero (Figure 4). It should be noted that in Equation (8) the undercooling is defined relative to the av-erage solute concentration in the undercooled extradendritic liquid, Cl. In the [2], [8] and [11] is used instead the
initial alloy composition, C0, to determine the undercooling for dendrite growth. In the [13] adopted Cl for
equiaxed growth, but C0 for columnar growth. In this present study, Cl is used for both equiaxed and columnar
growth. This difference constitutes the main new feature of the CET model. The dendritic morphology during the columnar-to-equiaxed transition (CET) in directional solidification is simulated using the phase-field model. The model relies on the solute conservation equation (Equation (14)) and a phase-field equation (Equation (13)) on the scale of the developing microstructure. A solute entrapment can be observed in the region next to the co-lumnar grains and equiaxed (Figure 9 and Figure 10). Therefore, these regions are richest in solute. As result, the solidification temperature is lower for those regions. With a greater solute concentration and lower solidifi-cation temperatures, these will tend to be the last parts to solidify. A solute concentration boundary layer exists in the liquid along the columnar grain contour. In this boundary layer, the concentration decreases exponentially to C0. The concentrations in the solid indicate the presence of a microsegregation pattern. It should be observed
that the phase-field calculations physically reproduces competitive growth of the columnar grains from the per-turbed interface (Figure 9(a) and Figure 9(b)), the final arms spacing are independent of initial conditions, as discussed in [22]. On the other hand, spacing between columnar grains depends on the competitive growth of them during solidification. Thus, at the onset of solidification, the competitive growth is intense, which decreas-es with time during any solidification procdecreas-ess (Figure 9(a) and Figure 9(b)).
4. Conclusion
A model based on coupling between the multiphase/multiscale model and phase-field was proposed in the present study. The multiphase/multiscale model proposed in the [3] was applied to predict the columnar-to-equiaxed transition (CET) in the solidification of Al-Cu alloy. The main feature of model is the concept of solutal block-ing of the columnar front, which is opposed to a mechanical blockblock-ing criterion based on a critical equiaxed grain fraction, as introduced in [8]. The solute blocking effect is achieved in the model by basing the undercooling that drives dendrite tip growth on the average solute concentration of the liquid surrounding the grain envelopes (extradendritic liquid), instead of the initial alloy composition (C0). The columnar-to-equiaxed transition (CET)
will occur, when the solute rejected from the equiaxed grains is sufficient to dissipate the solutal undercooling at the columnar front, such that Cl has increased to *
l
so-lute diffusion, dendritic morphology, and alloy composition in microscopic scale. Through model proposed in the present study, the influence of nuclei density on the columnar-to-equiaxed transition and dendritic morphol-ogy can be quantitatively simulated. On the other hand, the numerical modeling is dependent on input parame-ters, accuracy of phase diagram and material properties such as nuclei density, diffusion coefficient and interface energies. In order to improve the accuracy of the CET simulation, numerical models including multi-phases and fluid flow will need to be considered in future works.
References
[1] Salvino, I.M., Olivé, L. and Ferreira, A.F. (2012) Simulation of Microsegregation in Multicomponent Alloys during Solidification. Steel Research International, 83, 723-732. http://dx.doi.org/10.1002/srin.201200003
[2] Kurz, W., Bezençon, C. and Gäumann, M. (2001) Columnar to Equiaxed Transition in Solidification Processing.
Science and Technology of Advanced Materials, 2, 185-191. http://dx.doi.org/10.1016/S1468-6996(01)00047-X
[3] Martorano, M.A., Beckermann, C. and Gandin, Ch.-A. (2003) A Solutal Interaction Mechanism for the Columnar- to-Equiaxed Transition in Alloy Solidification. Metallurgical Materials Transactions A, 34A, 1657-1674.
http://dx.doi.org/10.1007/s11661-003-0311-x
[4] Winegard, W.C. and Chalmers, B. (1954) Supercooling and Dendritic Freezing in Alloys. Transactions of American Society for Metals, 46, 1214-1223.
[5] Spittle, J.A. and Brown, S.G.R. (1989) A Computer Simulation of the Influence of Processing Conditions on As-Cast Grain Structures. Journal of Materials Science, 24, 1777-1781. http://dx.doi.org/10.1007/BF01105705
[6] Zhu, P. and Smith, R.W. (1992) Dynamic Simulation of Crystal Growth by Monte Carlo. Method-I. Model Description and Kinetics. Acta Metallurgica et Materialia, 40, 683-692. http://dx.doi.org/10.1016/0956-7151(92)90009-4
[7] Gandin, Ch.-A. and Rappaz, M. (1994) Coupled Finite Element-Cellular Automaton Model for the Prediction Grain Structures in Solidification Process. Acta Materialia, 42, 2233-2246. http://dx.doi.org/10.1016/0956-7151(94)90302-6
[8] Hunt, J.D. (1984) Steady State Columnar and Equiaxed Growth of Dendrites and Eutectic. Materials Science Engi-neering, 65, 75-83. http://dx.doi.org/10.1016/0025-5416(84)90201-5
[9] Flood, S.C. and Hunt, J.D. (1987) Columnar and Equiaxed Growth: I. A Model of a Columnar Front with a Tempera-ture Dependent Velocity. Journal of Crystal Growth, 82, 543-551. http://dx.doi.org/10.1016/0022-0248(87)90346-0
[10] Flood, S.C. and Hunt, J.D. (1987) Columnar and Equiaxed Growth: II. Equiaxed Growth Ahead of a Columnar Front.
Journal of Crystal Growth, 82, 552-560. http://dx.doi.org/10.1016/0022-0248(87)90347-2
[11] Gäumann, M., Bezençon, C., Canalis, P. and Kurz, W. (2001) Single-Crystal Laser Deposition of Superalloys: Processing-Microstructure Maps. Acta Materialia, 49, 1051-1062. http://dx.doi.org/10.1016/S1359-6454(00)00367-0
[12] Kurz, W., Bezençon, C. and Gäumann, M. (2001) Columnar to Equiaxed Transition in Solidification Processing.
Science and Technology of Advanced Materials, 2, 185-191. http://dx.doi.org/10.1016/S1468-6996(01)00047-X
[13] Wang, C.Y. and Beckermann, C. (1994) Prediction of Columnar to Equiaxed Transition during Diffusion-Controlled Dendritic Alloy Solidification. Metallurgical Transactions A: Physical Metallurgy and Materials Science, 25A, 1081- 1093. http://dx.doi.org/10.1007/BF02652282
[14] Lipton, J., Glicksman, M.E. and Kurz, W. (1984) Dendritic Growth into Undercooled Alloy Metals. Materials Science Engineering, 65, 57-63. http://dx.doi.org/10.1016/0025-5416(84)90199-X
[15] Ziv, I. and Weinberg, F. (1989) The Columnar-to-Equiaxed Transition in Al 3pct Cu. Metallurgical Transactions B:
Process Metallurgy, 20B, 731-734. http://dx.doi.org/10.1007/BF02655931
[16] Ferreira, A.F., Silva, A.J. and Castro, J.A. (2006) Simulation of the Solidification of Pure Nickel via the Phase-Field Method. Materials Research, 9, 349-356. http://dx.doi.org/10.1590/S1516-14392006000400002
[17] Ferreira, A.F., Ferreira, L.O. and Assis, A.C. (2011) Numerical Simulation of the Solidification of Pure Melt by a Phase-Field Model Using an Adaptive Computation Domain. Journal of the Brazilian Society of Mechanical Sciences and Engineering, 34, 125-130. http://dx.doi.org/10.1590/S1678-58782011000200002
[18] Ferreira, A.F. and Castro, J.A. (2014) Phase-Field Simulations of Dendritic Crystal Growth with Focus on the Compu-tational Efficiency. Advanced Materials Research, 1025-1026, 745-748.
http://dx.doi.org/10.4028/www.scientific.net/AMR.1025-1026.745
[19] Ferreira, A.F. and Ferreira, L.O. (2009) Microsegregation in Fe-C-P Ternary Alloys Using a Phase-Field Model. Jour-nal of the Brazilian Society of Mechanical Sciences and Engineering, 31, 173-180.
http://dx.doi.org/10.1590/S1678-58782009000300002
708. http://dx.doi.org/10.4028/www.scientific.net/MSF.730-732.703
[21] Ferreira, A.F., Castro, J.A. and Ferreira, I.L. (2014) 2D Phase-Field Simulation of the Directional Solidification Process. Applied Mechanics and Materials, 704, 17-21. http://dx.doi.org/10.4028/www.scientific.net/AMM.704.17
[22] Ferreira, A.F., Melo, E.G. and Ferreira, L.O. (2014) Prediction of Secondary-Dendrite Arm Spacing for Binary Alloys by Means of a Phase-Field Model. Steel Research International, 85, 58-64.
[23] Caginalp, G. and Fife, P. (1986) Phase Field Methods for Interfacial Boundaries Fife. Physical Review B: Condensed Matter and Materials Physics, 33, 7792-7794. http://dx.doi.org/10.1103/PhysRevB.33.7792
[24] Gandin, C.-A. (2000) From Constrained to Unconstrained Growth during Directional Solidification. Acta Materialia,
48, 2483-501. http://dx.doi.org/10.1016/S1359-6454(00)00070-7
[25] Ode, M. and Suzuki, T. (2002) Numerical Simulation of Initial Microstructure Evolution Fe-C Alloys Using a Phase- Field Model. ISIJ International, 42, 368-374. http://dx.doi.org/10.2355/isijinternational.42.368
[26] Kim, S.G., Kim, W.T. and Suzuki, T. (1998) Interfacial Compositions of Solid and Liquid in a Phase-Field Model with Finite Interface Thickness for Isothermal Solidification in Binary Alloys. Physical Review E: Statistical Physics,
Plasmas, Fluids, and Related Interdisciplinary Topics, 58, 3316-3323. http://dx.doi.org/10.1103/PhysRevE.58.3316
[27] Liu, M.X., Wang, K., Xia, D. and Jiang, T. (2014) Phase Field Simulation of Al-Si Binary Dendritic Growth and Mi-cro-Segregation Patterns under Convection. Journal of Alloys and Compounds, 589, 431-435.
http://dx.doi.org/10.1016/j.jallcom.2013.11.108
[28] McCartney, D.G. (1989) Grain Refining of Aluminium and Its Alloys Using Inoculants. International Materials Re-views, 34, 247-260. http://dx.doi.org/10.1179/imr.1989.34.1.247
[29] Greer, A.L., Bunn, A.M., Tronche, A., Evans, P.V. and Bristow, D.J. (2000) Modelling of Inoculation of Metallic Melts: Application to Grain Refinement of Aluminium by Al-Ti-B. Acta Materialia, 48, 2823-2835.
http://dx.doi.org/10.1016/S1359-6454(00)00094-X
[30] Kurz, W., Bezençon, C. and Gäumann, M. (2001) Columnar to Equiaxed Transition in Solidification Processing.
Science and Technology of Advanced Materials, 2, 185-191. http://dx.doi.org/10.1016/S1468-6996(01)00047-X
[31] Mirihanage, W.U., Dai, H., Dong, H. and Browne D.J. (2013) Computational Modeling of Columnar to Equiaxed Transition in Alloy Solidification. Advanced Engineering Materials, 15, 216-229.
http://dx.doi.org/10.1002/adem.201200220
[32] Canté, M.V., Cruz, K.S., Spinelli, J.E., Cheung, N. and Garcia, A. (2007) Experimental Analysis of the Columnar-to- Equiaxed Transition in Directionally Solidified Al-Ni and Al-Sn Alloys. Materials Letters, 61, 2135-2138.
http://dx.doi.org/10.1016/j.matlet.2006.08.032
[33] Spinelli, J.E., Ferreira, I.L. and Garcia, A. (2004) Influence of Melt Convection on the Columnar to Equiaxed Transi-tion and Microstructure of Downward Unsteady-State DirecTransi-tionally Solidified Sn-Pb Alloys. Journal of Alloys and Compounds, 384, 217-226. http://dx.doi.org/10.1016/j.jallcom.2004.04.098
[34] Ares, A.E., Gueijman, S.F. and Schvezov, C.E. (2010) An Experimental Investigation of the Columnar-to-Equiaxed Grain Transition in Aluminum-Copper Hypoeutectic and Eutectic Alloys. Journal of Crystal Growth, 312, 2154-2170.
http://dx.doi.org/10.1016/j.jcrysgro.2010.04.040
[35] Loginova, I., Amberg, G. and Agren, J. (2001) Phase-Field Simulations of Non-Isothermal Binary Alloy Solidification.