http://dx.doi.org/10.4236/ojs.2015.55049
On the Power Performance of Test Statistics
for the Generalized Rayleigh Interval
Grouped Data
Hatim Solayman Migdadi
Department of Mathematics, Faculty of Science and Information Technology, Jadara University, Irbid, Jordan Email: hmigdadi@jadara.edu.jo
Received 16 July 2015; accepted 23 August 2015; published 26 August 2015
Copyright © 2015 by author and Scientific Research Publishing Inc.
This work is licensed under the Creative Commons Attribution International License (CC BY). http://creativecommons.org/licenses/by/4.0/
Abstract
In this paper, the weighted Kolmogrov-Smirnov, Cramer von-Miss and the Anderson Darling test statistics are considered as goodness of fit tests for the generalized Rayleigh interval grouped data. An extensive simulation process is conducted to evaluate their controlling of type 1 error and their power functions. Generally, the weighted Kolmogrov-Smirnov test statistics show a relatively better performance than both, the Cramer von-Miss and the Anderson Darling test statistics. For large sample values, the Anderson Darling test statistics cannot control type 1 error but for rela-tively small sample values it indicates a better performance than the Cramer von-Miss test statis-tics. Best selection of the test statistics and highlights for future studies are also explored.
Keywords
Generalized Rayleigh Distribution, Interval Grouped Data, Goodness of Fit Tests, Empirical Type 1 Error, Power Function
1. Introduction
units in the given intervals. Having the interval grouped data from the continuous lifetime model may override the testing settings but increases the efforts needed for making any statistical inference. Such type of data is considered by many authors as in Pipper and Ritz [1], Aludaat [2] and Migdadi and Al-Batah [3].
Many researchers have proposed and modified test statistics for fitting grouped data to the hypothesized sta-tistical distributions. Initially, the Chi Square test statistic proposed by Pearson [4] is mainly considered. This statistic is based on the discrepancies between the observed and the expected frequencies in the given intervals. Further modifications of the Chi Square test statistic are studied by many authors, as in Best and Rayner [5] [6].
The initial statistic for goodness of fit test is CH square, then other statistics are considered as a distance be-tween the theoretical and empirical distribution, for details see ref [10]. Test statistics are derived from the sum of discrepancies between the empirical and the hypothetical distribution functions. Among these statistics are the Kolmogrov- Smirnov, Cramer von-Miss and Anderson Darling test statistics. Choulakian [7] modified these sta-tistics for testing a discrete distribution. Spinelli and Stephens [8] have used these statistics for testing the pois-son distribution. Spinelli [9] has considered these statistics for testing grouped data fit to the exponential distri-bution. Baklizi [10] proposed the weighted Kolmogorov test statistics for the Rayleigh interval grouped data. Many other researchers studied the asymptotic distributions of some of these statistics as in Schmid [11] and Pettitt and Stephens [12]. Modifications, critical values and powers of these statistics are also considered for some distributions with grouped data as in Conover [13], Reidwyl [14], Maag [15], Damianou and Kemp [16], Gulati and Neus [17], Richard and Lockhart [18], and Ampai and Kanisa [19].
As an extension to the Rayleigh distribution, the generalized Rayleigh distribution is used for a more general lifetime data. The probability distribution, the cumulative distribution and the reliability functions of the genera-lized Rayleigh distribution with scale parameter
θ
and shape parameterβ
are given respectively by(
)
(
2)
(
(
2)
)
, , 2 exp 1 exp
f tθ β = βθ −θt − −θt β (1)
(
)
(
(
2)
)
, , 1 exp
F tθ β = − −θt β (2)
(
)
(
(
2)
)
, , 1 1 exp
R tθ β = − − −θt β (3)
where: t≥0,
θ
>0,β
>0.Raqab and Kundu [20] showed that this lifetime model can be widely used in survival and reliability analysis. Maximum likelihood estimators for both the scale parameter
θ
and the shape parameterβ
based on the in-terval grouped data are obtained by Debasis and Raqabb [21].The aim of this study is to evaluate performance of the weighted Kolmogrov-Smirnov and the modified Cra-mer von-Miss and Anderson Darling test statistics for fitting the interval grouped data to the generalized Ray-leigh distribution. The test statistics are compared in terms of their powers and controlling of type 1 errors. In the next section the test statistics are derived using the interval grouped data. In Section 3 an extended simula-tion study is conducted with the original generalized Rayleigh distribusimula-tion data to find the test statistics that control type 1 error. In Section 4 an alternative data from other lifetime distributions are used in connection with the simulation study to obtain powers of the given test statistics. Results from the simulation study are summa-rized in Section 5 and finally in Section 6 general conclusion and highlights of the overall finding and future works are also involved.
2. The Test Statistics
Suppose, we have a random sample of size n from the generalized Rayleigh distribution with probability density function given by (1).
Assume that the time scale line is divided by the inspection points t ii, =1, 2,,k−1 Suppose t0=0,tk = ∞, then we have the intervals
[
0,t1)
,[
t t1, 2)
,,[
tk−1,∞)
.Let fi: be the number of failure units in the ith interval, i=1, 2,,k, and assume that θ βˆ ˆ, are the maxi-mum likelihood estimators of
θ β
, based on the above interval grouped data. Then the empirical and the theo-retical distribution functions at the inspection times t ii, =1, 2,,k−1 are respectively( )
( )
(
( )
2)
ˆ1
1 ˆ
, 1 exp
i
n i j i
j
F t f F t t
n
β
θ
=
Hence, following Baklizi [10], the weighted Kolomogorov test statistics are given by
( )
(
( )
)
(
)
11
2 1
1 ki i 1 i i
Gv F t F t S
− −
=
=
∑
− (4)2 1 1 2
2 k
i i
k Gv = =− −i S
∑
(5)1 1 3 ki i
Gv =
∑
=− S (6)where: Si = F tn
( )
i −F t( )
i ,i=1, 2,,k−1.Setting: the probability of failure in the corresponding intervals: j=1, 2,,k
(
,)
(
1) (
1, ,) (
, ,)
j j j j j
P
θ β
=P t − < <T t =R t−θ β
−R tθ β
Then, following Choulakian [7], the modified Anderson Darling test statistics is given by
( )
(
)
1
ˆ ˆ, 1
1
j j k j
j j
W P Ad
n H H
θ β
=
=
−
∑
(7)where:
( )
1 ˆ ˆ, j
j i i
H =
∑
= P θ β and( )
1 1 ˆ ˆ,
j j
j i i i i
W =
∑
= f −n∑
= P θ β .And, following Spinelli [9], the modified Cramer test statistics is given by
( )
11 ˆ ˆ
, k
j j i
Cvm W P
n =
θ β
=
∑
(8)3. Simulation Study
In this section, an extensive simulation study is conducted to obtain the test statistics that control type 1 error for testing the hypotheses:
H0: the data distribution is the generalized Rayleigh distribution H1: the data distribution is not the generalized Rayleigh distribution At the significance level:
α
=0.05 with the following indices: The sample size: n=30, 50,100The number of intervals: k=5, 7,10
The original generalized Rayleigh distribution data with parameters:θ=0.05,β=0.8 The inspection times t ii, =1, 2,,k−1 are taken to be equally likely spaced. For each combination, the following steps describe the simulation process:
(1) Generate a random sample of size n from the generalized distribution and group it into k intervals (2) Compute the values of the MLE’s: θ βˆ ˆ, based on the interval grouped data
(3) Compute the values of the test statistics:Gv Gv Gv1, 2, 3,Ad Cvm,
(4) Generate a bootstrap sample of size n from the generalized Rayleigh distribution with parameters θ βˆ ˆ, and repeat the steps 2 and 3 to have the new values of the test statistics Gv1 ,* Gv2 ,* Gv3 ,* Ad Cvm*, *
(5) Repeat the step 4, m=500 times and compute the number of values h* for which the values of the test statistics found in 4 are greater than the test statistics found in 2 and compute the p value for each statistics as:
* 1 1 h p
m
+ =
+ .
(6) Repeat the steps 1-5, 1000 times and compute the empirical type 1 error for each statistics as 1000
w ,
where: w = the number of the p values less than the given significance level:
α
=0.05.4. Power of the Test Statistics
To find the empirical power for each of the given test statistics, an alternative non-generalized Rayleigh data are generated in step 1 of the simulation process described in the previous section. Hence, we consider the following distributions:
-One parameter Rayleigh distribution with distribution function:
( )
( )
2, 1 exp , 0, 0
F t
θ
= − −θ
t t≥θ
>-Weibull distribution with distribution function:
(
, ,)
1 exp(
)
, 0, 0, 0 F tθ β
= − −θ
tβ t≥θ
>β
>-Generalized Exponential distribution with distribution function:
(
, ,)
(
1 exp( )
)
, 0, 0, 0 F t θ β = − −θt β t≥ θ> β >5. Results and Conclusions
In this section, found out results about the empirical type 1 error and the power functions of the test statistics are illustrated. Compressions of the test statistics and the affecting factors are also illustrated.
5.1. Controlling of Type 1 Error
The empirical type 1 error rates at the significance level
α
=0.05 of the test statistics as applied to the original data are presented inTable 1. It appears clearly that [image:4.595.88.539.407.710.2](1) The test statistics Gv1, Gv3 can control type 1 error for any sample size and any number of inspection in-tervals.
Table 1. Empirical type 1 error rates.
number of inspection intervals Test statistics
Sample size
5 7
10
0.073 0.057
0.053 Gv1
30
0.066 0.059
0.058 Gv2
0.073 0.067
0.066 Gv3
0.068 0.064
0.053 Cvm
0.071 0.069
0.067 Ad
0.072 0.065
0.049 Gv1
50
0.061 0.057
0.050 Gv2
0.071 0.063
0.065 Gv3
0.067 0.061
0.057 Cvm
0.062 0.068
0.061 Ad
0.094* 0.073
0.064 Gv1
100
0.063 0.058
0.047 Gv2
0.058 0.057
0.048 Gv3
0.076* 0.077*
0.079* Cvm
0.061 0.059
0.057 Ad
*
(2) The test statistic Gv1 cannot control type 1 error for the sample size n = 100 and the number of inspection Intervals k = 5.
(3) The weighted Kolmogrov-Smirnov statistic Gv2 dominate Gv1 and Gv3 when the sample sizes n = 30, 50 and the statistic Gv3 is relatively better than Gv2 when the sample size n = 100.
(4) The Anderson Darling test statistic: Ad cannot control type 1 error for the sample size n = 100 using any number of inspection intervals. But for the sample sizes: n = 30, n = 50 it gives a better controlling of type 1 er-ror than the Cramer von-Miss Cvm test statistic.
(5) Generally, the statistics Gv1, Gv2 and Gv3 have more controlling of type 1 errors than both Cramer von- Miss and Anderson Darling test statistics.
5.2. Power Performance
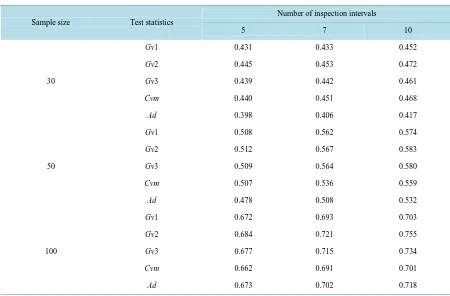
The powers of the test statistics applied to the nongeneralized Rayleigh grouped data are presented in the tables:
Tables 2-7 where we have the following results:
(1) The power functions of the given test statistics increases as the sample size and the number of inspection intervals increases.
(2) For the sample sizes: n = 30 and n = 50, the Anderson Darling test statistic have more power than the Cramer von-Miss test statistic.
(3) Among the weighted Kolmogrov-Smirnov statistics, Gv2 has the greatest power, next came Gv3, and then Gv1.
[image:5.595.87.537.424.720.2](4) Generally, the weighted Kolmogrov-Smirnov test statistics have greater power than the Anderson Darling and the Cramer von-Miss test statistics. Except at the sample size 30, the Anderson Darling test statistics gives greater power than Gv1 when the alternative data are considered from the from: the one parameter Rayleigh dis-tribution with scale parameter
θ
=0.85, the Weibull distribution with scale Parameterθ
=0.65 and shape parameterρ
=1.8 and the generalized exponential distribution with scale parameterθ
=1.5 and shape para-meterδ
=1.Table 2. Power of the test statistics for the interval grouped data from the one parameter Rayleigh distribution with scale pa-rameter θ = 0.85.
Number of inspection intervals Test statistics
Sample size
10 7
5
0.452 0.433
0.431
Gv1
30
0.472 0.453
0.445
Gv2
0.461 0.442
0.439
Gv3
0.468 0.451
0.440
Cvm
0.417 0.406
0.398
Ad
0.574 0.562
0.508
Gv1
50
0.583 0.567
0.512
Gv2
0.580 0.564
0.509
Gv3
0.559 0.536
0.507
Cvm
0.532 0.508
0.478
Ad
0.703 0.693
0.672
Gv1
100
0.755 0.721
0.684
Gv2
0.734 0.715
0.677
Gv3
0.701 0.691
0.662
Cvm
0.718 0.702
0.673
Table 3. Power of the test statistics for the interval grouped data from the one parameter Rayleigh distribution with scale pa-rameter θ = 0.05.
Number of inspection intervals Test statistics Sample size 10 7 5 0.703 0.612 0.602 Gv1 30 0.741 0.658 0.635 Gv2 0.727 0.635 0.619 Gv3 0.633 0.598 0.576 Cvm 0.579 0.542 0.518 Ad 0.803 0.771 0.687 Gv1 50 0.825 0.796 0.712 Gv2 0.811 0.782 0.705 Gv3 0.682 0.679 0.642 Cvm 0.674 0.665 0.639 Ad 0.853 0.799 0.732 Gv1 100 0.902 0.867 0.803 Gv2 0.902 0.855 0.794 Gv3 0.704 0.688 0.652 Cvm 0.815 0.796 0.727 Ad
Table 4. Power of the test statistics for the interval grouped data from the Weibull distribution with scale parameter θ = 0.65, and shape parameter β = 1.8.
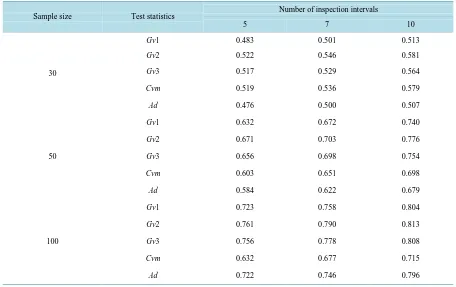
[image:6.595.85.541.436.723.2]Table 5. Power of the test statistics for the interval grouped data from the Weibull distribution with scale parameter θ = 0.05, and shape parameter β = 0.3.
Number of inspection intervals Test statistics Sample size 10 7 5 0.712 0.671 0.652 Gv1 30 0.755 0.703 0.692 Gv2 0.738 0.692 0.674 Gv3 0.661 0.633 0.579 Cvm 0.646 0.621 0.568 Ad 0.864 0.802 0.733 Gv1 50 0.907 0.836 0.762 Gv2 0.895 0.821 0.744 Gv3 0.852 0.792 0.712 Cvm 0.791 0.775 0.710 Ad 0.911 0.883 0.862 Gv1 100 0.932 0.902 0.865 Gv2 0.926 0.897 0.864 Gv3 0.853 0.798 0.724 Cvm 0.861 0.832 0.767 Ad
Table 6. Power of the test statistics for the interval grouped data from the generalized exponential distribution with scale pa-rameter θ = 1.5 and shape parameter β = 1.
[image:7.595.90.537.434.723.2]Table 7. Power of the test statistics for the interval grouped data from the generalized exponential distribution with scale pa-rameter θ = 0.05 and shape parameter β = 2.5.
Number of inspection intervals Test statistics
Sample size
10 7
5
0.732 0.693
0.681
Gv1
30
0.758 0.721
0.703
Gv2
0.755 0.713
0.695
Gv3
0.703 0.657
0.618
Cvm
0.688 0.632
0.615
Ad
0.866 0.815
0.784
Gv1
50
0.913 0.838
0.801
Gv2
0.907 0.831
0.792
Gv3
0.857 0.793
0.727
Cvm
0.796 0.781
0.714
Ad
0.923 0.887
0.868
Gv1
100
0.935 0.903
0.875
Gv2
0.928 0.901
0.872
Gv3
0.861 0.794
0.728
Cvm
0.867 0.835
0.751
Ad
(5) There is a significant affection in the power of the test statistics in fitting the generalized Rayleigh distri-bution with shape parameter
δ
≠1 for the lifetimes data. This affection clearly appears when using the alterna-tives: the one parameter Rayleigh and the generalized exponential distributions(6) The powers of the test statistics are mainly affected by the parameters of the alternative distributions, when the alternative Weibull distribution with scale parameter
θ
=0.65 and shape parameterρ
=1.8 is con-sidered, the values of the power functions are strictly less than their corresponding values when the alternative is the Weibull distribution with scale parameterθ
=0.05 and shape parameterρ
=3.A possible explanation for this is the degree of similarity between the Weibull distribution and the Genera-lized Rayleigh distribution when using a complete data at the indicated parameters.
6. Conclusion and Highlights for Future Work
This study explored the performance of goodness of fit test statistics for the generalized Rayleigh distribution. Generally, the weighted Kolmogrov-Smirnov test statistics have a relatively better performance in controlling type 1 error and in the power functions than the modified Cramer von-Miss and Anderson Darling test statistics. As it cannot control type 1 error when the sample size n = 100, the Anderson Darling test has more power than the Cramer von-Miss and the weighted Kolmogrov-Smirnov Gv1 test statistics when the sample size n = 30 or n = 50. This indicates that the researcher has to take into account both the sample size and number of inspection intervals when choosing the test statistic for fitting the interval grouped data to the generalized Rayleigh distri-bution. Future works may involve other lifetime models in the presence of censoring schemes within the inter-vals. Critical regions for the test statistics at different significance levels can also be a subject of concern.
References
[1] Pipper, C.B. and Ritz, C. (2006) Cheking the Grouped Data Version of Cox Model for Interval Grouped Survival Data.
[2] Aludaat, K.M., Alodat, M.T. and Alodat, T.T. (2008) Parameter Estimation of Burr Type X Distribution for Grouped Data. Applied Mathematical Sciences, 2, 415-423.
[3] Migdadi, H.S. and Al-Batah, M.S. (2014) Bayesian Inference Based on the Interval Grouped Data from the Weibull Model with Application. British Journal of Mathematics & Computer Science, 4, 1170-1183.
http://dx.doi.org/10.9734/BJMCS/2014/7930
[4] Pearson, K. (1900) On a Criterion That a Given System of Deviations from the Probable in the Case of a Correlated System of Variables Is Such That It Can Be Reasonably Supposed to Have Arisen from Random Sampling. Philo-sophical Magazine, 50, 157-175. http://dx.doi.org/10.1080/14786440009463897
[5] Best, D.J. and Rayner, J.C.W. (2007) Chi Squared Components for Tests of Fit and Improved Models for the Grouped Exponential Distribution. Computational Statistics and Data Analysis, 51, 3946-3954.
http://dx.doi.org/10.1016/j.csda.2006.03.014
[6] Best, D.J. and Rayner, J.C.W. (2006) Improved Testing for the Binomial Distribution Using Chi Squared Components with Data Dependent Cells. Journal of Statistical Computation and Simulation, 76, 75-81.
http://dx.doi.org/10.1080/00949650412331320891
[7] Choulakian, V., Lockhart, R.A. and Stephens, M.A. (1994) Cramer-von Mises Test of Discrete Distribution. The Ca-nadian Journal of Statistics, 22, 125-137. http://dx.doi.org/10.2307/3315828
[8] Spinelli, J.J. and Stephens, M.A. (1997) Cramer-von Mises Tests of Fit for the Poisson Distribution. The Canadian Journal of Statistics, 25, 257-268. http://dx.doi.org/10.2307/3315735
[9] Spinelli, J.J. (2001) Testing of Fit for the Grouped Exponential Distribution. The Canadian Journal of Statistics, 29, 451-458. http://dx.doi.org/10.2307/3316040
[10] Baklizi, A. (2006) Weighted Kolmogrov-Simirnov Type Tests for Grouped Rayleigh Data. Applied Mathematical Modeling, 30, 437-445. http://dx.doi.org/10.1016/j.apm.2005.05.012
[11] Schmid,P. (1988) On the Kolmogrov and Smirnov Limit Theorems for Discontinuous Distribution Functions. The An- nals of Mathematical Statistics, 29, 1011-1027. http://dx.doi.org/10.1214/aoms/1177706438
[12] Pettitt. A.N. and Stephens. M.A. (1977) The Kolmogrov-Smirnov Goodness-of-Fit Statistic with Discrete and Grouped Data. Technometrics, 19, 205-210. http://dx.doi.org/10.1080/00401706.1977.10489529
[13] Conover, W.J. (1992) A Kolmogrov Goodness-of-Fit Test for Discontinuous Distributions. Journal of the American Statistical Association, 6, 591-596. http://dx.doi.org/10.1080/01621459.1972.10481254
[14] Reidwyl, H. (1967) Goodness of Fit. Journal of the American Statistical Association, 6, 390-398.
[15] Maag, U.R., Streit. P. and Drouilly, P.A. (1973) Goodness-of-Fit Test for Grouped Data. Journal of the American Sta-tistical Association, 68, 462-465. http://dx.doi.org/10.1080/01621459.1973.10482456
[16] Damianou, C. and Kemp, A.W. (1990) New Goodness of Fit Statistics for Discrete and Continuous Data. American Journal of Mathematics, and Management Science, 10, 275-307.
[17] Gulati, S. and Neus, J. (2003) Goodness of Fit Statistics for the Exponential Distribution When the Data Are Grouped.
Communications in Statistics, Theory and Methods, 32, 681-700. http://dx.doi.org/10.1081/STA-120018558
[18] Richard, A., Lockhart, J., Spinelli, J.J. and Stephens, M.A. (2007) Cramér-Von Mises Statistics for Discrete Distribu-tions with Known Parameters. The Canadian Journal of Statistics, 35, 125-133.
[19] Ampai, T. and Kanisa, C. (2011) A Power of Comparison of Goodness of Fit Tests for Exponential Distribution with Grouped Data. Thailand Statistician, 9, 37-49.
[20] Raqab, M.Z. and Kundu, D. (2006) Burr Type X Distribution: Revisited. Journal of Probability and Statistical Scien- ces, 4, 179-193.
[21] Kundua, D. and Raqabb, M.Z. (2005) Generalized Rayleigh Distribution. Different Methods of Estimations. Computa-tional Statistics & Data Analysis, 49, 187-200.