Remotely Sensed Images
K. Venkateswaran
N. Kasthuri
K. Balakrishnan
K.Prakash.
Department of Electronics and Communication Engineering,Kongu Engineering College, Erode, India
ABSTRACT
Remote sensing plays a vital role in overseeing the transformations on the earth surface. Unsupervised clustering has a indispensable role in an immense range of applications like remote sensing, motion detection, environmental monitoring, medical diagnosis, damage assessment, agricultural surveys, surveillance etc In this paper, a novel method for unsupervised classification in multitemporal optical image based on DWT Feature Extraction and K-means clustering is proposed. After preprocessing the optical image is feature extracted using the discrete wavelet transform. On the feature extracted image feature reduction is performed using energy based selection. Finally different K means clustering is performed and analyzed using Matlab and ground truth data for improving classification accuracy.
KEYWORDS
K-Means, multitemporal, clusters, centroids, city block, squared Euclidean
1. INTRODUCTION
In the classification process images are taken and processed to identify the changes that may have taken place. The output is the accurate classified image, indicating the different features .Two types of classification namely supervised and unsupervised. In supervised classification, a training set is required for the learning process of the classifiers. This training set is obtained from the ground truth data [1]. The latter technique performs classification by different algorithms namely k means, C means, Fuzzy C means [2].The process of clustering is of widespread interest since it is having a wide variety of applications in diverse domains like remote sensing [3], motion detection [4], video surveillance [5], damage assessment [6], agricultural surveys [7], environmental monitoring [8], analysis of urban changes [9], medical diagnosis [10]. A wide variety of K Means algorithm techniques using have been introduced in the literature [2]. Due to the massive growth of the geographic database, it is more practical to focus on the unsupervised approach than the supervised one. Currently, many unsupervised classification techniques have been proposed. Some of these are hard clustering, soft clustering, Hierarchical clustering with the advancement in the remote sensing technology, unsupervised classification in remote sensing images is becoming vital.
In the literature, unsupervised classification to identify the change and no change in multitemporal images is achieved in three main steps [11]:1) pre-processing; 2) pixel by pixel comparison to get the difference image; 3) Analysis of the difference image. The objective of pre-processing step is to reduce the noise and hence increase the SNR. After
pre-processing, difference image is generated by the pixel by pixel comparison of the multitemporal input images. In multitemporal optical images, the subtraction operator is used to generate the difference image. Also by taking the ratio operator, the multiplicative noise can be changed to additive noise. In the third step, the difference image is analyzed by using either thresholding techniques [12] clustering techniques to identify only the change and no change areas. In the literature of unsupervised change detection to identify the urban growth monitoring [15] five major steps are used.1) pre-processing 2) Feature extraction 3) Feature reduction 4) post-classification comparison 5) classification techniques are used to accurately classify the different features in the image.
From the literature surveys K Means with anyone of the distance metric is used to classify the images. In this paper, in order to improve the classification accuracy discrete wavelet transform based feature extraction technique is used. For feature reduction energy based selection is used. .Finally different types of K-Means using city block, squared Euclidean, correlation are used and the performance is analysed using silhouette value and ground truth for accuracy assessment.
2. MATERIALS
24
Figure 1: Optical image of Madurai City
The Linear Imaging Self Scanner III (LISS III) has spatial resolution of 23.5m, multi-spectral channels in the Visible and Near Infra-red Wavelength. Observation Spectral Characteristics of LISS III (Fig-1) are,
Band 2 0.52 ~ 0.59 μm Band 3 0.62 ~ 0.68 μm Band 4 0.77 ~ 0.86 μm Band 5 1.55 ~ 1.70 μm
Table 1: Details of the image
3. METHODOLOGY
3.1. Need for Wavelet based Feature
Extraction
Most of the existing approaches for texture feature extraction which leads to make use of statistical techniques in which processing the texture image data requires large storage space and computational load to calculate the feature’s matrix. The scalar features calculated from this matrix is not efficient to represent the characteristics of image content [15]. Alternately, Spectral methods will serve better in extracting texture features. The spectral methods include frequency analysis such as Fourier transform and space- frequency analysis wavelet transform.
The Fourier transform suffers as texture measure from its lack of spatial information as it is purely a representation in the frequency domain and alsoFourier decomposition of a signal is not complete. Unlike the Fourier case, orthogonal wavelet decomposition is complete at any scale and provide good multiresolution analytical tool for texture analysis. Wavelet transform (WT) is used to represent the textural
images in multiresolution. Wavelet has an ability to span both spatial and frequency domain.
Many textures have dominant frequency in middle frequency channels and wavelet have power to focus in the dominant frequency region which provides a good space-frequency information further it gives unique texture signature. The wavelet coefficients of Daubechies are given below,
Scaling coefficients = [0.4830 0.8365 0.2241 -0.1294] Wavelet Coefficients = [0.1294 0.2241 0.8365 -0.4830]
3.2. Feature Reduction
In Feature reduction, Features [15] that do not contribute to the discrimination of classes can be removed by assessing some criteria. Feature reduction cannot be performed indiscriminately. Methods must be devised that allow the relative worth of features to be assessed in a quantitative and rigorous way. To improve classification performance, our attention in the project is focused on dimensionality reduction.
Dimensionality reduction can be achieved in two ways. The first approach is to select a small subset of features which could contribute to class separable or classification criteria. Some of the features in the m-dimensional feature space obtained are having low energy which has to be removed before the classification process. Consequently the feature space will be reduced to m-dimensional, so that the speed of the classification process will be increased. This dimensionality reduction process is referred to as feature selection or band selection based on energy.
3.2.1 Energy based selection:
For extracted texture features energy should be calculated using 3x3 or 5x5 window. The features having low energy has to be removed before the classification process. The objective of the local energy function is to estimate the energy in the filter output in a local region.
The energy function is given by
10 1
0
2
)
,
(
1
Mm N
n
n
m
x
MN
e
Where m, n is the size of the window.
3.3. K-means Clustering
K-means clustering is a simple algorithm [16] which, for K
clusters each with nk patterns
aims to find cluster centers mk to minimize the cost
function where,
,
x
1
m
k C x
k
k
n
2
1x C
k 2
k
m
-x
kk k
E
Date of
The initial cluster centers are chosen randomly and the algorithm is applied repeatedly until a steady state is reached [4].
The steps in the k-means clustering are,
Step 1: Initialize cluster centers randomly.
Step 2: For all the pixels in the image do the following 1. Compute the Euclidean distance of the feature vector from the cluster for every other cluster.
2. Assign the pixel to that cluster whose center yields the minimum distance from the feature vector.
Step 3: Update the cluster centers by computing the mean of the feature vectors of the pixels belonging to that cluster.
Step 4: Between two consecutive updates, if the changes in the cluster centers are less than a specified value,
Then stop Else go to Step 2.
In this paper the clustering using K-Means is implemented using different distance measures. Matlab support this one by using the inbuilt functions. In K-Means, distance measure is in p-dimensional space. K-Means minimizes with respect to this parameter. K-Means computes centroid clusters differently for the different supported distance measures. The distance measures used in this paper are square Euclidean, city-block and cosine. Matlab also supports choosing of the initial cluster in different manners. The choosing of initial cluster centroid also known as seeds. In our proposal we chose the initial cluster centroids as random, uniform and cluster.
3.3.1. Distance Metrics
Squared Euclidean Distance Metric: The Squared Euclidean distance metric uses the same equation as the Euclidean distance metric, but does not take the square root. As a result, clustering with the Euclidean Squared distance metric is faster than clustering with the regular Euclidean distance. The output K-Means clustering is not affected if Euclidean distance is replaced with Euclidean squared. However, the output of hierarchical clustering is likely to change.
The Euclidean distance function measures the ‘as-the-crow-flies’ distance. The formula for this distance between a point X (X1, X2, etc.) and a point Y (Y1, Y2, etc.) is:
Cosine Distance Metric:Cosine similarity is a measure of similarity between two vectors by measuring the cosine of the angle between them. The result of the Cosine function is equal to 1 when the angle is 0, and it is less than 1 when the angle is of any other value. As the angle between the vectors shortens, the cosine angle approaches 1, meaning that the two vectors are getting closer, meaning that the similarity of whatever is represented by the vectors increases.The term cosine similarity has also been used on occasion to express a different coefficient, although the most common use is as defined above. Using the same calculation of similarity, the normalized angle between the vectors can be used as a bounded similarity function within [0, 1], calculated definition of similarity by:
where similarity is given as,
where A and B are input vectors.
City Block distance Measure: Also known as city-block distance, this distance measurement is especially relevant for discrete data sets. The Manhattan distance refers to the sum of distances along each dimension. The City block distance between two points, a and b, with n dimensions is calculated as:
The city block distance is always greater than or equal to zero. The measurement would be zero for identical points and high for points that show little similarity.
3.3.2. Choosing Initial Cluster Centroid
The initial cluster centroids are chosen by using the inbuilt functions in the Matlab. They are,
Sample- Select initial cluster centroids in random manner.
Uniform-Select centroids uniformly at random from the range of input feature vector. Not valid for Hamming Distance metric.
Cluster-Perform a preliminary clustering phase on a random 10% subsample of input feature vector.
4. RESULTS AND DISCUSSIONS
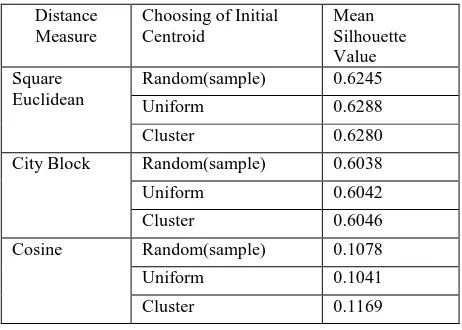
[image:3.595.317.548.602.767.2]Performance of distance measures with choosing the cluster centroids in the initial process of nine combinations as tabulated below. The accuracy of clustering for each method is given by silhouette value.
Table -2:Accuracy of clustering for each method
Distance Measure
Choosing of Initial Centroid
Mean Silhouette Value Square
Euclidean
Random(sample) 0.6245
Uniform 0.6288
Cluster 0.6280
City Block Random(sample) 0.6038
Uniform 0.6042
Cluster 0.6046
Cosine Random(sample) 0.1078
Uniform 0.1041
26
4.1. Accuracy Assessment and
Performance Evaluation
[image:4.595.324.540.71.284.2]The quantitative analysis can be done using the ground truth reference and check rules. The general approach to obtain ground truth reference is to perform field survey with the assistance of historical GIS data. Using the ground truth data the performance analysis of different k means algorithm are tabulated in Table 3.
Table 3: Accuracy of clustering by referring to ground truth data
Distance Measure
Choosing of Initial Centroid
Accuracy%
Square Euclidean
Sample 89.91%
Uniform 95.55%
Cluster 88.88%
City Block
Sample 87.77%
Uniform 86.65%
Cluster 85.55%
Cosine
Sample 80.55%
Uniform 86.55%
Cluster 88.55%
(a)Sq_Eculidean+Sample (b) Sq_Eculidean+uniform
(c)Sq_Eculidean+cluster d)city block+Sample
e)city block+uniform f)city block+cluster
g)cosine+Sample h)cosine+uniform
[image:4.595.62.294.186.691.2]i) cosine+cluster
Figure 2: Clustered output image using K-Means Clustering with different distance measures
5. CONCLUSION
The above results shows that square Euclidean using uniform gives the best performance for classification in remote sensing images using Matlab. The research is further continuing to get the accurate clustering for remote sensing images using kernel based k means clustering. Different kernel based clustering with different distance metrics are used to get the accurate classification and the performance is analysed using silhouette value and accuracy assessment.
6. REFERENCES
[1] L.Bruzzone and D.F.Prieto. 2000. “Automatic analysis of the difference image for unsupervised change detection,” IEEETrans.Geosci.Remote.Sens, vol.38, no.3, pp.1171-1182.
[2] Tapas kanungo and Nathan.S An Efficient K Means clustering Algorithm-Analysis and Implementation” IEEE Transactions on Pattern Analysis and Machine intelligence”
[3] L.Bruzzone and D.F.Prieto. 1996. “An adaptive semiparametric and context-based approach to unsupervised change detection in multitemporal remote-sensing images,”IEEE Trans.Image Processing., vol.11, no.4, pp.66-77.
[4] C. Dumontier, F. Luthon, and J.-P. Charras. 1999.“Real-time DSP implementation for MRF-based video motion detection,” IEEETrans. Image Process., vol. 8, no. 10, pp. 1341–1347.
[5] R. Collins, A. Lipton, and T.Kanade. 2000 “Introduction to special section on video surveillance,” IEEE Trans.Pattern Anal. Mach. Intell., vol22, no.8, pp.745-746.
[7] L.Bruzzone and S.B.Serpico. 1997. “An iterative technique for the detection of land-cover transitions in multitemporal remote- sensing images,” IEEE Trans.Geosci.Remote Sens., vol.35, pp.858-867. [8] P.S Chavez,Jr and D.J MacKinnon.1994 “Automatic
detection of vegetation changes in the south western united states using remotely sensed images” Photogramm. Eng. Remote Sensing,vol.60,no.5 [9] K. R. Merril and L. Jiajun.1998 “A comparison of four
algorithms for change detection in an urban environment,” Remote Sens. Environ., vol. 63, no. 2, pp. 95–100.
[10]T. Celik. 2010 “A Bayesian approach to unsupervised multiscale change detection in synthetic aperture radar images,” Signal Process., vol. 90, no. 5, pp.1471–1485. [11]Y. Bazi, L. Bruzzone, and F. Melgani. 2005. “An unsupervised approach based on the generalized Gaussian model to automatic change detection inmultitemporal SAR images,” IEEE Trans. Geosci. Remote Sens., vol.43, no. 4, pp. 874–887.
[12]M. Sezgin and B. Sankur.2004. “A survey over image thresholding techniques and quantitative performance
evaluation,” J. Electron. Image. vol. 13, no. 1, pp. 146– 165.
[13]Vrabel, J.: “Multispectral imagery band sharpening study”, Photogrammetric Engineering and Remote Sensing, Vol. 62. (1969) 1075-1083.
[14]R.A Alaguraja, V.Anand and ,S.Maidani. 2009” Wavelet frame based feature extraction technique for improving classification accuracy”. J Indian society of remote sensing”pp-423-471.
[15]R.A Alaguraja,V.Anand,S.Maidani. 2013 “Wavelet based post classification change detection technique for urban growth monitoring”. J Indian society of remote sensing” Volume 41, issue 1, pp 35-43 [16]Grigorious .F.Tzortz Aristisdis C.Likas. 2009 “The
global kernel K-Means Algorithm for clustering in feature Space”,IEEE Transactions on Neural Networks” vol 20.