Design of 12 bit Successive Approximation
Analog-to-Digital Converter
Seema Malik
1M.Tech, ECE Deptt
.
Banasthali University Banasthali, Jaipur
INDIA
Sunil Nandal
2Scientist,(Agriculture Statistics) PDFFSR
Modipuram, Meerut (U.P) INDIA
ABSTRACT
In this paper, a 12 bit Successive Approximation Analog to Digital Converter has been designed which has high resolution, less power consumption and medium speed. The circuit has been designed and simulated on Cadence tool in 0.35µm AMS technology with a supply voltage of 3.3V. Different ADC architectures are present but this SAR ADC has a salient feature of providing high resolution with increased accuracy. In this all the building blocks of SAR ADC have been designed such that they meet the desired specifications. The time domain comparator is used such as to obtain low power consumption. The layout of all the blocks has been done on Cadence Virtuoso and process corner analysis is also done to meet the desired specifications.
General Terms
Comparator, Phase Detector, Switch Circuit for DAC
Keywords
ADC, control logic, sample and hold circuit, analysis
1.
INTRODUCTION
Nowadays, there is huge requirement of low cost, low power consumption and increased performance for devices such as the mobile phone adapters, Personal Digital Assistants (PDA), digital cameras, audio devices such as MP3 players and video equipments such as Digital Video Disk (DVD), High Definition Digital Television (HDTV) and other products. ADCs are used for converting the analog to digital data in these applications and hence, power and performance of ADCs play a major role in all these devices [1],[5],[7],[8]. An analog input signal sensed from the “outside world” is converted to digital data for further processing [9]. The data converters act as an interface between analog input signal and digital output data (either 0 or 1). This analog input is a signal defined over a continuous amplitude and time range. The ADC takes the analog signal and gives a digital representation which is defined over a finite set of values in amplitude and time. The digital output of the ADC is further processed with Digital Signal Processors (DSP) or microcontrollers depending on the application. The increasing sophistication of System-on-Chip (SOC) architectures requires highly reliable and low power analog to digital converter (ADC) [4]. Over the past few decades, there is a reduction of feature size in CMOS technology along with the decrease in supply voltage. Therefore, this provides a challenge for mixed signal systems.
The need for low power dissipation systems has motivated the development of power efficient designs. The most challenging part is to maintain the high performance while attempting to reduce the power consumption.
2.
COMPARATOR
In this section, the discussion is focused on the Comparator, is the one of the basic building block in analog to digital converters. The electrical function of a comparator is to generate an output voltage with a value high (1) or low (0) depending on whether the input signal is greater than reference signal or lesser than the reference signal respectively. We can have two different types of input: voltage or current [3]. In the case of voltage, the input voltage is measured with respect to a given reference level. In various types of analog-to-digital converter, the comparator is the most important part of the circuit. The comparator compares an analog signal with another analog signal or reference and generates a binary output signal on the comparison. In analog-to-digital conversion process, it is first necessary to sample the input. This sampled signal is then applied to a combination of comparators to determine the digital equivalent of the analog signal. In its simplest form comparator can be considered as a 1- bit Analog-to-Digital Converter.
2.1
Design of Comparator
In2 in1 VDD VDD In2 in1 VDD VDD VDD VDD Out Out VCDL VCDL Binary PD Out Out In2 in1 Out Out Vin Vdac Clk In-In+ In+ In-Clk Clk Out VDD VDD VDD VDD VDD GND GND GND In-In+ a. Circuit Diagram of a time domain
Comparator
[image:2.595.316.556.64.183.2]b. Circuit diagram of a Binary Phase Detector
[image:2.595.54.288.73.293.2]Figure 1 Circuit diagram of Time Domain Comparator [2]
Figure 2 A single block of a comparator
[image:2.595.54.298.340.561.2]For the binary phase detector (PD), a flip-flop can be conventionally used as it is the simplest and fastest circuit. But it suffers from inevitable nonzero setup time since a flip-flop has different paths for clock and data. This systematic mismatch causes an input-referred offset delay which significantly varies as supply voltage decreases. Figure 1 (b) shows a new offset-free binary phase detector. With the shortest symmetrical racing paths from both inputs, this binary phase detector achieves fast latch operation as a flip-flop.
Figure 3 Comparator Design using the delay stages
3.
DIGITAL TO ANALOG CONVERTER
(DAC)
A digital-to-analog converter (DAC) receives a digital code at the input and generates an analog output signal that is a fraction of the full analog range set by a reference. The input to the DAC is the N bit digital word and the reference signal. The reference signal is scaled depending upon the binary equivalent (either 0 or 1). Depending on the architecture, the reference can be treated as a current, voltage, or charge quantity. The total number of input combinations that can be applied to DAC is 2N. For 12 bit resolution the numbers of input combinations are 4096. Thus, a converter with N bit resolution must be able to map a change of 1 2N part of analog output voltage. The output voltage of the DAC is limited by the reference voltage.
3.1
Design of Capacitor array DAC
The conventional binary weighted capacitor array has limitation for higher resolution due the larger capacitor ratio from MSB capacitor to LSB capacitor. Due to this matching accuracy of components becomes less as the ratio of MSB capacitor to LSB capacitor increases. Another problem with this architecture is the large area requirement because of the large values of capacitors used. Due to the charging of large capacitor values the amount of delay is increased to produce a analog output voltage from the applied given digital word. To eliminate this problem, one technique can be applied known as split capacitor technique [10],[11]. The charge scaling architecture provides good accuracy and small size of MSB capacitors. The value of split capacitor (attenuation capacitor) can be obtained as
𝐂
𝐬=
𝐒𝐮𝐦 𝐨𝐟 𝐋𝐒𝐁 𝐚𝐫𝐫𝐚𝐲 𝐜𝐚𝐩𝐚𝐜𝐢𝐭𝐨𝐫𝐬
𝐒𝐮𝐦 𝐨𝐟 𝐌𝐒𝐁 𝐚𝐫𝐫𝐚𝐲 𝐜𝐚𝐩𝐚𝐜𝐢𝐭𝐨𝐫𝐬
. 𝐂
Where C is the unit capacitor, Cs is the attenuation/scaling
capacitor, C = 100.276fF, Cs = 101.674fF.
3.2
Switch circuit of DAC
The most widely-used solution to deal with the voltage-drop problem of pass transistors (NMOS and PMOS) is the use of transmission gates [6]. It builds on the complementary properties of NMOS and PMOS transistors. For low-voltage operation, the transistor switches need maximum gate overdrive (i.e., VDD − |Vth|). To achieve this, the voltage
references must be selected as VDD and ground for the PMOS and NMOS transistors, respectively. Figure 4 shows the schematic of the switch circuit of digital-to-analog converter.
Phase Detector Delay stages using single stage
Figure 4 Schematic of Switch Circuit of Digital-to-Analog Converter
3.3
Simulation results
3.3.1 Transient response of DAC
Figure 5 shows the transient response of digital-to-analog converter. The transient response of both ideal DAC and the designed DAC are compared. It gives a settling time of
±0.5LSB across different process corners. The first analog output voltage is obtained half of the reference voltage (Vref/2). The next voltage levels of the DAC, depends upon the output of comparator which is either 0 or 1.
Figure 5 Transient response of DAC
4.
SUCCESSIVE APPROXIMATION
REGISTER- CONTROL LOGIC
The important building block of the successive approximation analog-to-digital converter is successive approximation register (SAR) also known as the Control Logic. This block generates the control signal for the sample and hold block (SH) and simultaneously this SH signal is applied to DAC to reset all the capacitors used in the charge scaling DAC. Then sequence of binary 1s and 0s are applied to DAC so as to generate a specific analog voltage for the input digital bit. The Control Logic block as shown in Figure 6 comprises of a
A shifter unit and
[image:3.595.337.584.79.301.2] A 12 bit output register
[image:3.595.316.541.358.516.2]Figure 6 Block diagram of Successive approximation register
Figure 7 Schematic of Control Logic and Output Register
4.1
Schematic Results
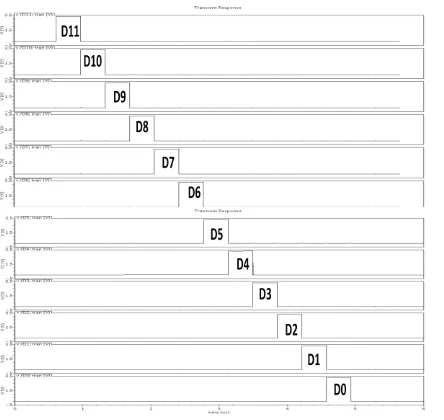
4.1.1 Transient response when comparator
output is zero
[image:3.595.57.280.394.559.2]Figure 8 Transient response when comparator output is ‘0’ Figure 9 Transient response when comparator output is ‘1’
5.
Simulations & Performance analysis
5.1
Process Corner Analysis
Process corner simulation deals with the variation in process parameters such as threshold voltage, mobility and metal oxide thickness. As integrated circuit device geometries shrink and clock speed increase, the extraction of parasitic resistance, capacitanceassumes an important role in physical verification and the production of the successful silicon. The naming convention for process corners is to use the two letters, where first letter refer to the NMOS corner and second letter refer to the PMOS corner.
5.1.1
Process Corner simulation for time domain
comparator
Table 1 shows the input offset voltage of time domain comparator at different process corners. The result of input offset voltage of comparator shows that it remains same for all the three process corners
Parameter Worst Speed
Typical Worst Power
Resolution 12 12 12
Offset Voltage(
𝝁𝑽)
128.2
μ
V
128.2μ
V
5.2𝛍𝐕
5.1.2 Process Corner simulation for control logic
Table 2 shows Pre layout simulation results of control logic. The delay is measured between the two successive output lines of SAR Logic when the comparator input to the SAR logic is zero.
Delay Typical Worst speed Worst power
SH-D11 352.1ps 604.4ps 218.5ps
D11-D10 647.2ps 999.8ps 368.1ps
D10-D9 647.2ps 999.8ps 368.1ps
D9-D8 647.1ps 999.7ps 368.1ps
D8-D7 647ps 999.7ps 368ps
D7-D6 647ps 999.7ps 368ps
D6-D5 646.9ps 999.7ps 367.9ps
D5-D4 647.1ps 999.9ps 368.1ps
D4-D3 647.1ps 999.8ps 368.1ps
D3-D2 647.1ps 999.8ps 368ps
D2-D1 647ps 999.7ps 368ps
[image:4.595.320.544.71.278.2] [image:4.595.53.287.518.650.2]Table 3 shows the Post layout simulation results at different process corners.
Delay Typical Worst speed Worst power
SH-D11 288.9ps 510.4ps 178.8ps
D11-D10 970.6ps 1.479ns 576.8ps
D10-D9 994ps 1.509ns 593.1ps
D9-D8 970.2ps 1.479ns 577ps
D8-D7 1.034ns 1.567ns 620ps
D7-D6 992.9ps 1.510ns 592.2ps
D6-D5 997.9ps 1.515n 595.7ps
D5-D4 958.6ps 1.463ns 569.1ps
D4-D3 1.029ns 1.561ns 617.1ps
D3-D2 979.2ps 1.491ns 582.8ps
D2-D1 981.2ps 1.491ns 584.7ps
D1-D0 989.4ps 1.507ns 589ps
The whole circuit is simulated and tested at all the available process corners between the temperature range of -25 to 120 with a typical mean temperature of 25 .
5.1.3 Power Dissipation
The dynamic power dissipation accounts for almost 90% of the overall power dissipation of the circuit while the contribution of static power is only 10%. Hence, dynamic power has been calculated for the SAR ADC circuit as
𝑫𝒚𝒏𝒂𝒎𝒊𝒄 𝑷𝒐𝒘𝒆𝒓 = 𝑽𝑫𝑫
𝑻𝒔𝒕𝒐𝒑 𝟎
𝑻𝒔𝒕𝒐𝒑 × 𝑰𝒎𝒂𝒈𝒅𝒕
where Tstop is the time limit for calculation; VDD is the
high voltage; Imag is the magnitude of the current delivered
by the power supply. The Power Consumption of the SAR ADC is 375𝜇𝑊.
5.1.4 Comparision with recent SAR ADC found in
literature
REFER ENCE
YEA R
TEC HNO LOG Y
RESOL UTION
SPEED SUPPLY POW ER
Y.C.Lia ng
2009 0.35 μm
12 bit 20kS/s 3.3V 38μW
H.A.Has an
2009 0.18 μm
8bit 200kS/s 1.8V -
C.Jun 2007 0.35 μm
10 bit 2MS/s 3.3V 3mW
J. Saubery
2003 0.18 μm
9 bit 150kS/s 1V 30 μW
The heading for subsubsections should be in Times New Roman 11-point italic with initial letters capitalized.
6.
CONCLUSION
This work has been carried out to design the successive approximation analog-to-digital converter so as to obtain a highly accurate circuit with minimum circuit blocks. All the blocks of ADC are designed such that they should settle within 0.25LSB value. The whole circuit is operated at a supply voltage of 3.3V. The power dissipation of the designed SAR ADC is 375μW. It is operated at a clock frequency of 0.2MHz. For the completion of 1 cycle of operation 14 clock cycles are required. The additional digital circuit is used for sequence generation so as to implement the binary search algorithm for the SAR ADC designed.
7.
REFERENCES
[1] H. A. Hasanet et. al., “Design of 8 bit SAR ADC”, Proceedings of IEEE 2009 Student Conference on Research and Development.
[2] A. Agnes, et. al., “A 9.4-ENOB 1V 3.8𝜇W 100kS/s SAR ADC with time-domain comparator,” IEEE ISSCC, pp. 246-247, 2008.
[3] Phillip E. Allen, Douglas R. Hollberg, “CMOS Analog Circuit Design Textbook”, Oxford University Press, Fifth Impression 2008.
[4] C. Jun, R. Feng and X. Mei-Hua, “IC Design of 2Ms/s 10-bit SAR ADC with Low Power,” Proceedings of HDP 2007, IEEE.
[6] S. Kang, Y. Leblebici, “CMOS Digital Integrated Circuits”, Third Edition. Tata McGraw Hill 2003. [7] Jens Sauerbrey et. al, “A 0.5V, 1µm Successive
Approximation ADC,” IEEE Journal of Solid-State Circuits, vol. 38, no. 7, pp. 1261-1265, July 2003. [8] Micheal D. Scott, Benhard E. Boser ,Kristofer S.J.
Pister, “An Ultra Low Energy ADC for Smart Dust” IEEE Journal of Solid-State Circuits, vol. 38, no. 7, pp. 1123-1129,July 2003.
[9] J.M. Raeby, A. Chandrakasan, B.Nikolic, “Digital Integrated Circuits, A Designing Perspective (2nd edition), “Prentice Hall, Electronics and VLSI Series. [10] R. J. Baker, CMOS: Circuit Design Layout and
Simulation, Third Edition, Wiley-IEEE Press 1998. [11] J.L.McCreary, “AII-MOS Charge Redistribution