Munich Personal RePEc Archive
Czech Republic in Respect of the Real
Convergence
Tuleja, Pavel
Slezská univerzita v Opavě, Obchodně podnikatelská fakulta v
Karviné
17 October 2007
Online at
https://mpra.ub.uni-muenchen.de/11679/
830
CZECH REPUBLIC IN RESPECT OF THE REAL
CONVERGENCE
1Pavel Tuleja
Silesian University in OpavaSchool of Business Administration in Karviná Department of Economics
Univerzitní nám. 1934/3 733 40
Karviná
E-mail: tuleja@opf.slu.cz Telephone: +420 596 398 259
Abstract
In spite of the fact that the Czech Republic, on its entry into the European Union, undertook, within the shortest possible time limit, to meet all the terms and conditions which are required for adoption of the common European currency, the Euro, it is apparent at the present time that the Czech shall not be able to meet this undertaking until 2012. The unfavourable situation of the Czech public finances, due to which the Czech economy is not able to comply with one of the nominal convergence criteria, that is, the government deficit criterion, can be regarded as one of the major causes of this delay. Although the degree of compliance with the Maastricht nominal convergence criteria appears to be the critical factor for acceptance of a country into the Euro Area, which also showed when the Lithuania’s last year’s application was declined, in our opinion, the country’s compliance with the real economic convergence criteria is far more important on its entry into the Euro Area. Therefore, we have devoted our contribution to these problems, wherein we have focused on the assessment of real dispositions which shall enable the Czech to keep all its positive effects ensuing from its membership in the Euro Area. Within the analyses which we have completed, we have arrived at the conclusion that in the upcoming five years the Czech economy will need to undergo quite a dramatic process of convergence with the Euro Area’s economy, since the current state of its real convergence is accompanied by a myriad of risks, which in case of an early adoption of the Euro might result in severe economic trouble.
Keywords: Price level; gross domestic product per capita; real convergence; economic structure; foreign trade
JEL codes: E42
1
831
1.
Introduction
Although the Czech Republic, on its entry into the European Union, undertook, within
the shortest possible time limit, to meet all the preconditions which are required for adoption
of the common European currency, the Euro, at the present time it is apparent that the Czech
shall not be able to meet this undertaking until 2012. Should we assess the preparedness of the
Czech for the future adoption of Euro, we can take into consideration both the Maastricht
nominal convergence criteria and the actual dispositions, which shall enable the Czech
Republic to maintain all the positive effects, which the membership in the Euro Area is to
bring. With regard to the fact that, in our opinion, on the entry of any country into an already
operating monetary area, its actual presumptions for the adoption of a common currency are
far more important, in this article we have focused our attention to the analysis of selected
macroeconomic indicators providing that using these we shall be able to assess the degree of
the real convergence of the Czech economy to the Euro Area economy.
2.
Cyclical and structural accord of the Czech economy and Euro Area
economy
Provided that in the upcoming years the Czech becomes a Euro Area (and thereafter
also EU-13) member, this step shall, on the one hand, bring indisputable benefits relating in
particular to the stabilisation of long-term interest rates, lower risk of occurrences of currency
turbulences or higher transparency in the monetary area, and, on the other hand, significant
risks; the peril regarding occurrence asymmetrical economic shocks and their subsequent
damping, being regarded as the most significant. With regard to the fact that the peril of
occurrence of asymmetrical shock may be, under the optimal monetary area theory, relatively
dramatically reduced provided that the economy of the country entering into the relevant
monetary union shows a high degree of accord with the economy of the respective monetary
area, prior to its entry, the Czech Republic should undergo a process which would either
ensure its fast economic convergence or at least improve its ability to successfully respond to
the potential asymmetrical shocks.
2.1Real economic convergence
Should we assess the degree of accord of the Czech economy with the Euro Area’s
economy, we are able to employ a number of macroeconomic indicators for this purpose, of
which the most important include the gross domestic product per capita expressed in the
832
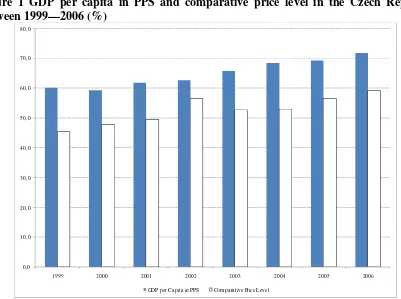
Figure 1 GDP per capita in PPS and comparative price level in the Czech Republic between 1999—2006 (%)
0,0 10,0 20,0 30,0 40,0 50,0 60,0 70,0 80,0
1999 2000 2001 2002 2003 2004 2005 2006
GDP per Ca pita in PPS Compara tive Price Level
Source: Eurostat and author’s calculation
Should we analyse the real convergence process using the gross domestic product per
capita development in the PPS, we shall arrive at the conclusion that between 1999-2006 the
Czech economy was gradually converging to the economic level of the Euro Area’s countries.
As the facts from the last year of the period which have we analysed shown in the Figure No.
1 indicate, the per capita GPD totalled 71.99 % of the average value of this indicator in the
EU-13 countries, in particular due to the a dramatic advance of the growth rate of the Czech
real gross domestic product over the Euro Area’s real GDP growth rate, where between
2003-2006 the Czech GDP grew 3.50 percentage points faster than the EU-13 gross domestic
product. As a result of this positive development, in 2004, the Czech overtook, in terms of the
economic level, the first ones of the current Euro Area’s member states. This country was
Portugal, where the gross domestic product per capita expressed in the purchasing power
parity in 2004 accounted for 98.82 per cent of the same indicator in the Czech Republic, while
two years later this gap was even broader (in 2006, the Portugal’s economic standard
accounted for 93.83 % of the Czech’s economic standard). Along with this development, the
Czech economy markedly approached also the level of Greece (89.82 %), Slovenia (89.41 %)
[image:4.595.92.493.76.375.2]833
falls behind the EU-13 most advanced countries, i.e. Luxembourg (28.49 %), Ireland (55.56
[image:5.595.102.488.145.745.2]%) and the Netherlands (60.06 %).
Figure No. 2 GDP per capita in PPS (a) and comparative price level (b) in the Euro Area countries and in the Czech Republic in 2006 (%)
(a) 20,0 40,0 60,0 80,0 100,0 120,0 140,0 160,0 180,0 200,0 220,0 240,0 260,0 L u x e m b o u rg Ir e la n d N e th e rl a n d s A u st ri a B e lg iu m F in la n d G e rm a n y F ra n c e It a ly S p a in S lo v e n ia G re ec e C ze c h R e p u b li c P o rt u g a l (b) 20,0 40,0 60,0 80,0 100,0 120,0 140,0 Ir e la n d F in la n d F ra n c e B e lg iu m L u x e m b o u rg It a ly N e th e rl a n d s G e rm a n y A u st ri a S p a in G re e ce P o rt u ga l S lo v e n ia C z e c h R e p u b li c
834
The positive development in the economic level indicated above is somewhat shaded
by the development of the comparative price levels. Should we at this moment we proceed
form the facts shown in Figure No. 1, we shall arrive at the conclusion that despite the fact
that in the period which we have analysed the Czech price level grew faster than the Euro
Area’s price level – except for 2003, when the value of this indicator dropped 3.82 percentage
points – the growth rate in terms of the real convergence appears to be insufficient. Hence, in
2006 the price level in the Czech appeared only at 59.16 % of the EU-13 price level. The
Czech price level approached most the price level of Slovenia (80.08 %), Portugal (70.99 %)
and Greece (68.05 %), whereas the Czech economy fell furthest behind from Ireland (48.41
%), Finland (49.55 %) and France (56.68 %). Based on these facts, it may be presumed that
the future entry of the Czech Republic into the Euro Area shall be accompanied by a more
dramatic advance of the domestic inflation rate over the EU-13 current countries’ inflation
rate, which shall in turn cause a fall in the domestic real interest rate. In this connection it
should be noted that this development can be regarded as dangerous only if the Czech
economy remains in this stage in the course of a longer time period.
2.2Accord of economic cycles
In addition to the mentioned relative indicators, a significant role in assessment of the
degree of accord of the individual economies is also played by the indicators which
demonstrate the development of the real and potential gross domestic products, and that is in
particular due to the fact that using them we are able to analyse the individual stages of the
economic cycle, in which the selected economies in the analysed period appear. With respect
to the analysis of the cyclical harmony, three significant macroeconomic indicators are
concerned, including the growth rate of the real and potential product and the size of the
production gap.
When comparing the development of the economic cycles in the Czech and in the
EU-13 between 1999-2006, or Half 1/2007, we arrive at the conclusion that in this period a certain
disagreement of the cyclical development of these economies occurred. As the Figure No. 4
and Table No. 1 show, in the analysed period we have noticed only one year in which the
Czech economy and the EU-13 economy appeared in the same production gap. The concerned
year is 2004, when both the mentioned economies appeared in the recession gap, while in the
835
Table No. 1 Potential gross domestic product and production gap in the Czech Republic (CZK, mil., %) and in the Euro Area (EUR, mil., %) between 1999--2006
1999 2000 2001 2002 2003 2004 2005 2006
Czech Republic
potential GDP 1512.7 1573,0 1634.2 1696.6 1760.6 1826.0 1892.4 1959.3
GAP 0.9 -0.4 -1.4 -1.9 -1.7 -0.9 0.6 2.3
Euro area (13 countries)
potential GDP 6016.2 6155.4 6293.5 6430.4 6566.1 6700.8 6834.9 6968.9
GAP -0.1 0.3 0.6 0.4 0.2 -0.1 -0.3 -0.3
Source: Eurostat and author’s calculation
Figure No. 3 The real gross domestic product growth rate in the Czech Republic and in the Euro Area between 1999—2007 (%)
-1,00 0,00 1,00 2,00 3,00 4,00 5,00 6,00 7,00 8,00 9 9 :1 q 9 9 :2 q 9 9 :3 q 9 9 :4 q 0 0 :1 q 0 0 :2 q 0 0 :3 q 0 0 :4 q 0 1 :1 q 0 1 :2 q 0 1 :3 q 0 1 :4 q 0 2 :1 q 0 2 :2 q 0 2 :3 q 0 2 :4 q 0 3 :1 q 0 3 :2 q 0 3 :3 q 0 3 :4 q 0 4 :1 q 0 4 :2 q 0 4 :3 q 0 4 :4 q 0 5 :1 q 0 5 :2 q 0 5 :3 q 0 5 :4 q 0 6 :1 q 0 6 :2 q 0 6 :3 q 0 6 :4 q 0 7 :1 q 0 7 :2 q
Euro area (13 countries) Czech Republic
Source: Eurostat and author’s calculation
As the Figure No. 3 shows the period in which the differences in the development of
the economic cycles in the Czech Republic and the EU-13 were the least dramatic was in the
interval commencing in Quarter 1/1999 and finishing at the beginning of Quarter 2/2000. In
the course of these five quarters, the Czech GDP expressed in stable prices in fact copied the
development of the gross domestic product of the Euro Area countries. From the beginning of
Quarter 2/2000 we can notice a certain growth in differences between the development of the
analysed economies’ cycles, which subsequently showed in a dramatically lower level of the
economic accord; the largest differences being observed in the period from Quarter 2/2000 to
836
Figure No. 4 The real gross domestic product growth rate in the Czech Republic (a) and in the Euro Area (b) between 1999—2007 (%)
(a) 370 000 390 000 410 000 430 000 450 000 470 000 490 000 510 000 530 000 550 000 9 9 :1 q 9 9 :2 q 9 9 :3 q 9 9 :4 q 0 0 :1 q 0 0 :2 q 0 0 :3 q 0 0 :4 q 0 1 :1 q 0 1 :2 q 0 1 :3 q 0 1 :4 q 0 2 :1 q 0 2 :2 q 0 2 :3 q 0 2 :4 q 0 3 :1 q 0 3 :2 q 0 3 :3 q 0 3 :4 q 0 4 :1 q 0 4 :2 q 0 4 :3 q 0 4 :4 q 0 5 :1 q 0 5 :2 q 0 5 :3 q 0 5 :4 q 0 6 :1 q 0 6 :2 q 0 6 :3 q 0 6 :4 q 0 7 :1 q 0 7 :2 q
rea lity potentia l
(b)
1 450 000 1 500 000 1 550 000 1 600 000 1 650 000 1 700 000 1 750 000 1 800 000
9 9 :1 q 9 9 :2 q 9 9 :3 q 9 9 :4 q 0 0 :1 q 0 0 :2 q 0 0 :3 q 0 0 :4 q 0 1 :1 q 0 1 :2 q 0 1 :3 q 0 1 :4 q 0 2 :1 q 0 2 :2 q 0 2 :3 q 0 2 :4 q 0 3 :1 q 0 3 :2 q 0 3 :3 q 0 3 :4 q 0 4 :1 q 0 4 :2 q 0 4 :3 q 0 4 :4 q 0 5 :1 q 0 5 :2 q 0 5 :3 q 0 5 :4 q 0 6 :1 q 0 6 :2 q 0 6 :3 q 0 6 :4 q 0 7 :1 q 0 7 :2 q
rea lity potentia l
837
Provided that we use the above mentioned division of the analysed time series into
three separate periods (Quarter 1/1999 - Quarter 1/2000, Quarter 2/2000 - Quarter 2/2003,
Quarter 3/2003 - Quarter 2/2007) and should we measure the degree of the cyclical accord of
the Czech economy and EU-13 economy in these periods using a simple correlation analysis
based on determination of the time series by a method of year-on-year differences, then we
again arrive at the previously mentioned conclusion, that an increase in the cyclical accord of
both the mentioned economies appeared only at the beginning of the analysed period. This
conclusion further confirms the values of correlation coefficients which in the second and
third period amounted to 0.268 and 0.552, whereas in the first period this indicator amounted
to 0.977.
2.3Structural accord of the Czech economy
Another factor which shall dramatically affect the possibility of asymmetrical demand
shocks shall include the degree of their structural accord, provided that also in this case it can
be assumed that the high degree of similarity of the Czech economy with the EU-13 economy
shall dramatically reduce both the peril of occurrence of these shocks and the costs which
shall be related to their subsequent removal.
Table No. 2 Structure of the Czech economy and the Euro Area’s economy between 1999—2006 (%)
1999 2000 2001 2002 2003 2004 2005 2006
Czech Republic
Agriculture 3.88 3.86 3.97 3.30 3.08 3.34 2.90 2.66
Industry 31.78 31.57 31.42 30.47 29.48 32.04 31.44 31.63
Building industry 6.98 6.40 6.28 6.16 6.38 6.45 6.69 6.44
Services 57.36 58.17 58.32 60.07 61.06 58.18 58.97 59.27
Euro area (13 countries)
Agriculture 2.46 2.46 2.56 2.34 2.23 2.23 2.01 1.79
Industry 22.35 22.32 21.71 21.25 20.71 20.49 20.20 20.16
Building industry 5.59 5.69 5.68 5.78 5.79 5.90 6.14 6.38
Services 69.61 69.53 70.04 70.63 71.27 71.38 71.65 71.67
Source: Eurostat and author’s calculation
Like in the case of the cyclical accord, also at this moment it is possible to claim that
both the economies which we have analysed show quite significant differences in their
structure. Comparing the structure of the Czech economy and the structure of the economy
consisting of the Euro Area countries, we will discover that between 1999-2006, industrial
sector, at the expense of the service sectors in particular, contributed to the Czech gross added
[image:9.595.63.527.464.631.2]838
apparently shows, in the analysed period, the Czech industry accounted for 31.23 % in the
creation of the gross added value, whereas in the case of the Euro Area this proportion was
10.08 percentage points lower (an average of 21.15 %). On the contrary, the development in
the services sector was quite opposite, where the EU-13’s share in the creation of the gross
added value amounted to an average of 70.72 percent between 1999-2006, whereas in the case
[image:10.595.101.493.250.505.2]of the Czech economy only 58.92 %.
Figure No. 5 Structure of the Czech economy (a) and the Euro Area economy (b) in 2005 (%)
(a)
agriculture 2,66%
industry 31,63%
building industry 6,44% services
59,27%
a griculture industry building industry services
839
a griculture 1,79%
industry 20,16%
building industry 6,38%
services 71,67%
a griculture industry building industry services
Source: Eurostat and author’s calculation
Should we analyse the structure of the Czech economy in more detail, we shall arrive
at the conclusion that, in addition to the industry, the production of the “Trade; repairs of
motor vehicles and goods for personal consumption and in particular for household” sectors,
“Accommodation and food” and “Transport, storage and telecommunications” sectors
contributed much more significantly to the creation of the Czech gross added value; their
aggregate share in the creation of the gross added value amounting to the average of 20.87 %
in the Czech between 1999-2006, which was 3.90 percentage points more than in the Euro
Area countries. On the contrary, the “Financial intermediation” and “Activities in the area of
real estates and lease; business activities” sectors as well “Public administration and defence;
mandatory social security”, “Education”, “Health and social service; veterinary activity”,
“Other public and social services” and “Household activities” sectors showed far lower share
in the creation of the gross added value, where the aggregate share in the creation of the gross
added value was nearly thirteen percent points lower (Czech 27.22 and Euro Area 39.93 %).
3.
Commercial interconnection of the Czech’s and Euro Area’s economy
The ability of the Czech economy to face asymmetrical shocks is not affected merely
by the degree of the cyclical and structural accord, but also by its level of commercial
interconnection with the individual Euro Area’s countries. For this reason, in the final part of
this contribution, we shall focus on the analysis of the Czech foreign trade, or, as appropriate,
840
Should we proceed from the facts related to the development of the international trade
in the Czech Republic, we shall arrive at the conclusion that between 1999-2006 the degree of
openness of the Czech economy amounted to an average of 131.63 %, providing that the
proportion of the Czech exports and imports in the gross domestic product amounted 65.53
and 66.11 percent, respectively. Hence, the abovementioned facts indicated that the Czech
economy can be regarded as an economy characteristic for a high degree of openness to the
surrounding world, which is a phenomenon which can be, in relation to the Czech’s future
entry, viewed as positive, since thereby the problems related to the loss of autonomy in the
area of monetary policy can be replaced.
Table No. 3 Share of the Czech Republic’s export to, and import from, the Euro Area and the European Union countries in the total export and import between 1999-2006 (%)
1999 2000 2001 2002 2003 2004 2005 2006
import
EU-27 76.53 75.16 74.59 72.53 71.42 80.28 81.41 80.50
Euro area (13) 59.02 56.95 57.31 55.95 55.11 62.58 62.13 59.97
export
EU-27 87.48 85.90 86.48 85.70 87.32 87.14 85.54 85.58
Euro area (13) 65.25 63.17 62.65 61.53 63.39 62.96 59.71 58.68
Source: Eurostat and author’s calculation
As the Table No. 3 indicates, in the analysed period, the import from the Euro Area
countries to the CZ accounted for 58.63 % of the total Czech import, and export to the EU-13
countries accounted for as much as 62.17 percent of the total export, which implies that in that
period the Czech economy achieved a high degree of economic integration with the Euro
Area countries. In this connection, it should be noted that such a high degree of openness of
the Czech to the Euro Area countries can be regarded as one of the most significant arguments
advocating for the soonest possible adoption of the common European currency, since such a
step would within the mutual trade contracts lead to removal of the risks related to the
fluctuations of exchange rates, if any. This idea which we have presented is confirmed also by
the considerable share of the European Union in the Czech foreign trade. Should we proceed
from the statistical facts, we shall arrive at the conclusion that between 1999-2006 the
European Union’ (EU-27) share in the import of goods and services to the Czech Republic
accounted for 76.55 % and the share in the export amounted to as much as 86.39 percent.
Regarding the fact that new European Union member states on their entry adopted the same
commitment as the Czech Republic, i.e. to adopt the common European currency within the
841
economic integration with the Euro Area’s economy shall deepen further in the years to come,
which again confirms the above-mentioned thesis of the soon entry of the CZ into the Euro
Area.
4.
Conclusion
With respect to the fact that at the moment of its entry to the Euro Area the Czech
National Bank shall lose its autonomy in the area of the monetary policy, which may in turn
rather considerably affect the development of the Czech economy, in this connection we find
quite important the compliance with the real economic convergence criteria in particular,
whereas at this moment we understand the nominal criteria rather as a certain political and
economic barrier, which should prevent from a massive entry of new member states to the
Euro Area. The abovementioned facts indicate that in the elapsed years a certain convergence
between the Czech economy and the EU-13 economy occurred, this process being the most
marked both with respect to the gross domestic product per capita in PPS, where the Czech
overtook the first current Euro Area country, Portugal, in 2004, and the degree of commercial
interconnection between the Czech economy and the EU-13 countries’ economy. On the other
hand, it should be noted that in this period certain negative effects appeared, including both
the insufficient tempo of the convergence of the price levels and the increasing imbalance
between the economic cycle of the Czech Republic and EU-13 countries. The potential risks
of the Czech’s entry to the Euro Area also include certain differences in the structure of both
the analysed economies, where the industrial sector plays a considerably more distinct role in
the Czech economy. Should we proceed from the abovementioned facts, it is apparent that in
the upcoming five years the Czech economy will need to undergo quite a dramatic process of
convergence with the Euro Area’s economy, since the current state of its real convergence is
accompanied by a myriad of risks, which in case of an early adoption of the Euro might result
842
References
[1] CZECH STATISTICAL INSTITUTE. Analysis of the Contexts of the Macroeconomic
Development in CZ in 2005. 2007. Access from:
<http://www2.czso.cz/csu/2006edicniplan.nsf/publ/1101-06-za_rok_2005>
[2] EUROSTAT Data navigation tree. 2007. Access from: <
http://epp.eurostat.cec.eu.int/portal/page?_pageid=1996,45323734&_dad=portal&_sche
ma=PORTAL&screen=welcomeref&open=/&product=EU_MAIN_TREE&depth=1>
[3] EUROPEAN CENTRAL BANK. Convergence Report – May 2006. 2007. Access from:
<http://www.ecb.int/pub/pdf/conrep/cr2006cs.pdf>
[4] TULEJA, P. Economic Standard of the Czech Republic from the Perspective of the
Nominal Convergence. Acta academica karviniensis. 2006, vol. 2, pp. 134 - 146. ISSN:
1212-415X.
[5] TULEJA, P. Possibilities and Perspectives of the Czech Republic’s Entry to the Euro
Area. In the proceedings from an international conference. Národná a regionálna
ekonomika VI. CD-ROM. Košice: EF TU. 2006. pp. 410-417. ISBN: 80-8073-721-5.
[6] TULEJA, P. The positron of the Czech Republic in the European Union. In Starzyczná et
all.:Exogenous and Endogenous Factors of the Regional Development – Evaluation of
the Empirical Experience and Theoretical Approaches to the Development Poles. A
scientific Monograph. Studia Oeconomica. Karviná: OPF SU Karviná. 2005. pp. 34-49.
ISBN: 80-7248-337-4.
[7] TULEJA, P. The Czech Republic on the Road to the Euro-zone – Nominal Convergence
Criteria. In Poloucek, S., Stavarek, D. (eds.): Future of the Banking after Year 2000 in
the World and in the Czech Republic. X. Karviná: OPF SU v Karviné. 2005. pp.
1939-1954. ISBN: 80-7248-342-0.
[8] ZIMMERMANN, CH. HP-Filter. 2007. Access from: EUROSTAT <