http://dx.doi.org/10.4236/wjnst.2015.51005
Evaluation of Natural Radioactivity Levels
for Structural Material Used in the
Construction of the Neutrino Detector
Vladimir G. Zinovyev, Anatolii P. Serebrov, Ivan A. Mitropolsky, Yuriy E. Loginov,
Georgiy I. Shulyak, Tatyana M. Tyukavina, Sergey L. Sakharov, Anatoly V. Chernyj
National Research Centre “Kurchatov Institute”, B.P. Konstantinov Petersburg Nuclear Physics Institute, Gatchina, RussiaEmail: pitzinovjev@yandex.ru
Received 7 January 2015; accepted 26 January 2015; published 29 January 2015
Copyright © 2015 by authors and Scientific Research Publishing Inc.
This work is licensed under the Creative Commons Attribution International License (CC BY). http://creativecommons.org/licenses/by/4.0/
Abstract
In this work, the evaluation of natural radioactivity and spontaneous fission rates was performed for 8 nuclides from the natural radioactive 238U, 235U and 232Th decay chains. For this purpose,
three samples of structural materials of the neutrino detector, i.e. aluminum, titanium and glass were analyzed by gamma spectroscopy and by neutron activation analysis to quantify a specific radioactivity of the samples. According to the results of this investigation, glass and aluminum samples have maximum values of the mean uranium concentrations 7.3(7) × 10−4% and 3.1(6) ×
10−5%, respectively, while the lowest value for mean concentration of the uranium was found in
titanium samples to be 4.7(3) × 10−6%. Aluminum sample had maximum values of the mean
tho-rium concentrations, 2.5(8) × 10−3%, while the lowest value for mean concentration of the
tho-rium was found in titanium samples to be 6.2(3) × 10−7%.
Keywords
Spontaneous Fission, Radioactive Decay Chain, α-Decay, β-Decay, Radionuclide, Branching Factor, Decay Rate
1. Introduction
allows carrying out monitoring of the reactor core.
Depending on the neutrino flavour, there are several possible detection reactions in a liquid-scintillator detec-tor. The most important ones are the inverse beta decay channel for
ν
e:Gamma radiation from capture of slow neutrons in 157Gd is used as signal to neutrino registration after ther-malization of fast neutrons in neutrino detector. The 158Gd emits gamma-ray cascade with the total energy of 8 MeV
(
Sn=7937.33 keV)
. The inverse beta decay reaction has a threshold of 1.8 MeV. It provides a delayed coincidence signal while the positron gives a prompt signal and then the neutron is captured by a free proton or 157Gd in ~200 μs [1]. The neutrino detector has to measure the desired signal at the input count rate of 300 day−1under the assumption of the 0.5 m3 detector volume, the 5 m distance between centers of the reactor core and the neutrino detector and reactor power of 17 MW. Due to the passive and active shielding the neutrino detector provides ultra-low background counting rate in the detector. The cosmic muon capture reaction
(
µ,n)
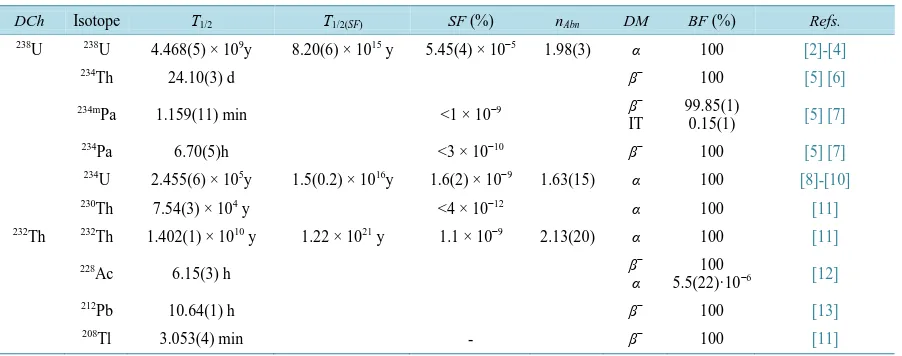
on the heavy elements is source of the natural radiation background (fast neutrons). Lead is one of these elements usually used for the construction of the passive shielding. In fact, real counting threshold of the detector is de-termined by intrinsic radioactive contaminants. As 14C is naturally abundant in organic scintillators, detection of neutrino is not possible below the end point 156 keV of the 14C β-spectrum.The isotopes from the natural uranium and thorium decay chains are intensive alpha and beta radioactive sources. At the same time, the 238U, 235U, 234U and 232Th are disintegrated via spontaneous fission process. The spontaneous fission rate is far less than the α-decay one. The 238U, 235U, 234U, 232Th and their daughter nuclei create signals in the liquid-scintillator detector in their natural α- and β-decays. These signals correlate with those from the fast neutrons which appear in the spontaneous fission of the 238U, 235U, 234U and 232Th. Nuclear characteristics of the 238U, 232Th and their daughter nuclei emitting neutrons in the spontaneous fission are given in theTable 1. Only nuclei of the 232Th emit the neutrons after spontaneous fission in the radioactive 232Th decay chain. The spontaneous fission
probability SF of the 232Th is 1.1 × 10⁻⁹% per decay. So, the neutrino detector, the passive and the active shielding should be built with materials in which natural radioactivity has ultra-low background.
[image:2.595.91.542.520.698.2]The 235U and its daughter nucleus 231Th are important naturally occurring radioactive isotopes; they were used to determine the uranium concentration in the samples analyzed. The 235U decays by 100% α-emission to levels in 231Th. The recommended nuclear decay data of the 235U and 231Th are presented inTable 2. The decay data were taken from the LNHB (available at http://www.nucleide.org/NucData.htm).
Table 1. Nuclear characteristics of the 238U, 232Th and their daughter nuclei.
DCh Isotope Т1/2 Т1/2(SF) SF (%) nAbn DM BF (%) Refs.
238U 238U 4.468(5) × 109y 8.20(6) × 1015 y 5.45(4) × 10−5 1.98(3) α 100 [2]-[4]
234
Th 24.10(3) d β− 100 [5] [6]
234mPa 1.159(11) min <1 × 10⁻⁹ β−
IT
99.85(1)
0.15(1) [5] [7]
234Pa 6.70(5)h <3 × 10⁻¹⁰ β− 100 [5] [7]
234U 2.455(6) × 105y 1.5(0.2) × 1016y 1.6(2) × 10−9 1.63(15) α 100 [8]-[10]
230Th 7.54(3) × 104 y <4 × 10⁻¹² α 100 [11]
232Th 232Th 1.402(1) × 1010 y 1.22 × 10²¹ y 1.1 × 10⁻⁹ 2.13(20) α 100 [11]
228Ac 6.15(3) h β−
α 5.5(22)·10100 −6 [12]
212Pb 10.64(1) h β− 100 [13]
208Tl 3.053(4) min - β− 100 [11]
Т1/2is the half-life time, Т1/2(SF) is the spontaneous fission half-life time, SF is the spontaneous fission probability per decay (%), nAbn is the neutrons
perunitfission, BF is branching factor of the radioactive decay (%), DM is decay mode, Refs. are references, DCh is Decay chain.
𝜈̅𝑒+ 𝑝 → 𝑒++ 𝑛
n + p → d + γ(2.2 MeV)
Table 2. The nuclear data of the 235U and 231Th.
Isotope Т1/2 Т1/2(SF) SF (%) nAbn Decay mode BF Reference
235U 7.04(1) × 108 y 0.98(28) × 1019 y 7.0(2) × 10−9 1.86 α 100 [8] [11] [14]
231
Th 25.52(1) h - β- 100 [15]
2. Examination
The uranium mass concentration and absolute decay rate of the 235U were measured with the gamma spectrome-tric method in samples analyzed (aluminum and titanium sheets and glass samples).
The gamma line of 235U at the Eγ =185.7 keV was used in this case. In the same way the uranium mass concentration and the absolute decay rate of the 238Uwere measured with the 234mPa full absorption peaks at the 766.6 keV and 1001 keV, as the 234mPa is daughter nucleus of natural radioactive 238U.
The first two daughter nuclei of the radioactive 238U decay chain (234Th, 234mPa) are very short-lived compared with 238U so that radioactivity equilibrium is quickly achieved (about in three months) in the samples of natural isotopic composition which need not be subjected to special isotope separation. The 238U, 234Th, 234mPa have the similar radioactivity. Absolute decay rate of 238U, 234Th, 234mPa, 231Th and uranium concentration were deter-mined in the samples analyzed with the use of the gamma-rays listed in theTable 3. The decay data were taken from the ENSDF BNL-NCS-51655-01/02-Rev.
Three daughter nuclei of the equilibrium radioactive 232Th decay chain (228Ac, 212Pb, 208Tl) were used for the determination of the natural radioactive and the spontaneous fission rates of the 232Th. The γ-ray energies and absolute γ-ray abundances of the 228Ac, 212Pb and 208Tl are listed in theTable 4. The recommended decay data were taken from the ENSDF BNL-NCS-51655-01/02-Rev.
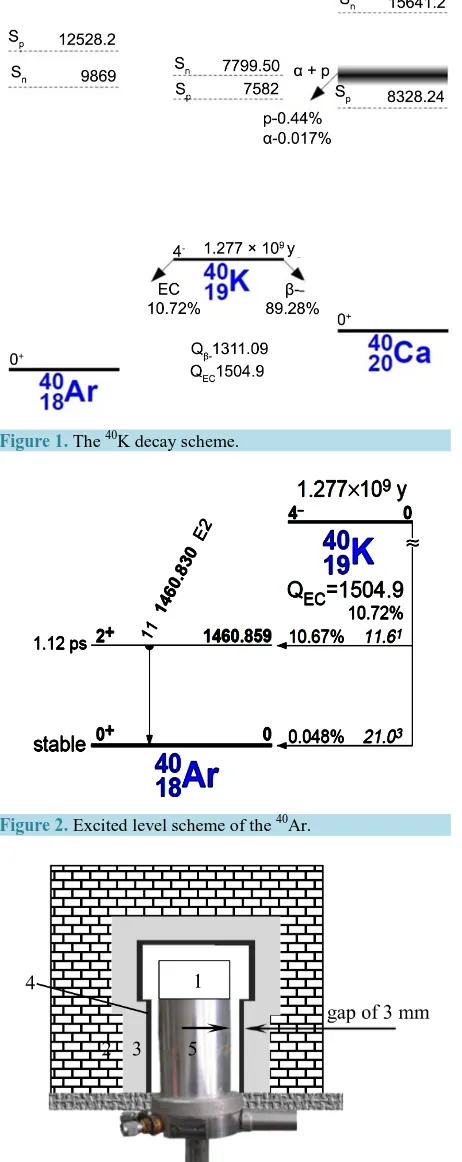
The concentration and natural radioactivity of potassium were measured with the use of the full absorption peak of the 40K at the Eγ =1460.8 keV in a gamma-ray spectrum of the samples analyzed. Nuclear data, the 40K decay scheme and the 40Ar excited level scheme are given inFigure 1and Figure 2, respectively.
The 238U, 235U, 232Th and their daughter nuclei have low-level radioactivity in the samples analyzed, therefore the big cylindrical samples have been used to achieve large statistical reliability. Masses of the aluminum, tita-nium samples and glass of the photomultiplier were about 1800 g, 1871 g, and 771 g, respectively. The concen-trations of the other trace, minor and major elements have been measured with the instrumental neutron activa-tion analysis.
3. Experimental Facility for Spectrometric Measurements
Experimental facility includes gamma-ray spectrometer and a passive shielding of a HPGe detector. The passive shielding consists of 0.5 mm of copper, 1 mm of cadmium and 9 cm of lead with 2.8(4) × 10−3 s−1 counting rate of 210Pb at the 46.5 keV. The usage of cadmium and copper as an inner layers of a multilayer shielding atte-nuates the bremsstrahlung and the X-rays (72.805 keV abundance is 2.75% and 74.969 keV abundance is 4.58%) induced by the beta-particles from the 210Bi decay
(
Eβmax=1.1621 MeV)
in the lead. A special effort was spent to reduce the background from the 41Ar (counting rate is 1.3(2) × 10−3 s−1 for the 1293.7 keV peak at the reactor power of 17 MW). Therefore the distance between the detector and the copper layer of the passive shiel-ding was reduced up to 3 mm (seeFigure 3).Figure 1.The 40K decay scheme.
Figure 2.Excited level scheme of the 40Ar.
Table 3. Main gamma-rays of the radioactive equilibrium 238U and 235U decay chains.
Decay chain Analytical isotope Gamma-ray energy(keV)
Absolute emission intensity (%)
238
U
234Th 63.29(2) 4.4(9)
234mPa 766.36(2) 0.207(30)
234mPa 1001.03(3) 0.59(8)
234U 53.20(2) 0.123(2)
235U
235U 185.715(5) 57.2(8)
[image:5.595.87.538.100.223.2]231Th 84,214(3) 6.71(10)
Table 4.Main gamma-rays of the radioactive equilibrium 232Th decay chain.
Isotope Energy(keV) Absolute emissionintensity (%)
212Pb 238.625(6) 43.4(3)
212Pb 300.09(1) 3.3(1)
228Ac 338.322(2) 11.25(3)
208Tl 583.191(2) 84.4(7)
228Ac 911.205(4) 26.6(7)
228Ac 968.971(10) 16.1(3)
228Ac 1588.210(30) 3.27(10)
208Tl 2614.532(13) 99.9(4)
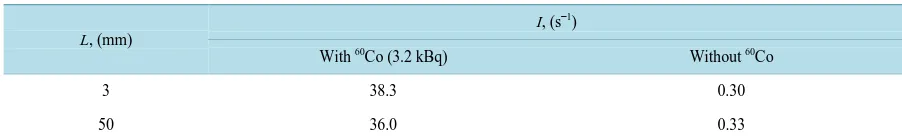
Table 5. Effect of the detector–shielding distance L to the counting rate I of the detector in the energy range from 100 keV to 150 keV.
L, (mm)
I,(s−1)
With 60Co (3.2 kBq) Without 60Co
3 38.3 0.30
50 36.0 0.33
measurements. The energy range 100 - 150 keV is just above the K X-ray absorption edge of the multilayer Pb-Cd-Cu shielding because these elements have corresponding edges at the energies of 87.95 keV, 26.712 keV and 8.982 keV.
The decision threshold g in units of activity was determined using the full absorption peak at the signif-ic-ance level α =0.025
(
P=97.5%)
,(
0)
1.92
1 1 2.08
g R t
P tγ
ε
= + + (1)
where ε is the full energy peak registration efficiency for the sample-detector geometry, Pγ is the gamma- ray emission probability, t is the measurement time and R0 is the count rate in seconds both in a region of 2.5 FWHM beyond the peak. Shown inFigure 4 is the energy dependence of the counting detector efficiency for the size of reference gamma-ray source (62 mm in diameter, 100 mm height). The crystalline hydrate of uranyl nitrate UO2(NO3)2·6H2O (750 g) was taken as the reference gamma-ray source.
Figure 5shows the energy dependence of the decision threshold g under the assumption of Pγ =1 and
1
[image:5.595.88.536.250.407.2] [image:5.595.86.537.441.511.2]Figure 4. The efficiency calibration curve of the GC2018 HPGe detector.
Figure 5.Decision threshold g versus the energy for measurement time of 1 day and the normalized emission probability of Pγ = 1.
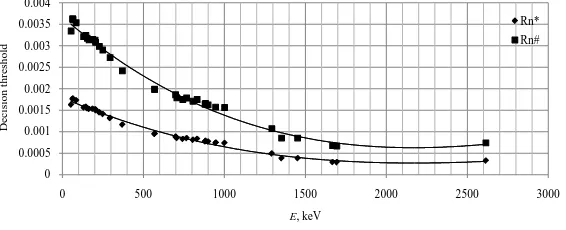
at energies of approximately 200 keV, where the counting detector efficiency is maximum (Figure 4). The decision threshold Rn
∗
and the detection limit Rn# in the units of counting rate at the selected energy
were calculated as
2
1 0
2 1
4 2 2
1 1
2 2
n
k b N l l
R
t l k b b
α
α
∗ −
−
= + +
(2)
and
(
)
(
)
2# 0
1 1 2 1 1
1
1 1
2 4 2
n
N b b
R k k k k
l t l
t
α β α β
− − − −
= + + + + +
(3)
respectively [17]. The k1−α and k1−β are the quantiles of the normal distribution for the error probability
α
of the type I and for the error probabilityβ
of the type II, respectively (α β= =0.025,P=97.5%,0.975 1.96
k = ), N0 is the number of counts below the full absorption peak in the spectrum, the l is full width at half maximum (FWHM) of the full absorption peak, the b=2l is the width of the full absorption peak, the
t is measurement time in the Equations (2) and (3). The energy dependences of Rn∗ and Rn# are shown in the
Figure 6.
The area uncertainty of the full absorption peak is then calculated as [17]
( )
0 ,2
n B
b
U N N N
l
= + (4) 0.01
0.1 1 10
0 200 400 600 800 1000 1200 1400 1600 1800
g
[image:6.595.178.453.314.432.2]where Nn is the area of the full absorption peak and Nb =Nn+N0.Figure 7 shows the energy dependence of the area uncertainty (%) for measurement time of t=1 day, and sample of size Ø 62 mm, height 100 mm.
The Table 6 presents, for example, decision threshold g expressed in terms of activities for 235U, 234Pa and
208Tl containing in the natural aluminum sample. The required decision threshold g for the aluminum sample can
be reached at the measurement time of 7 d and the sample mass of 1.8 kg.
[image:7.595.174.457.185.300.2]The gamma-ray spectra of samples analyzed and large standard reference gamma-ray-emitting sources were measured with the coaxial p-type HPGe-detector of 20% relative efficiency (CANBERRA GC2018) coupled
Figure 6.The energy dependence of *
n R and #
n
[image:7.595.176.458.349.455.2]R of GC2018 HPGe detector for measurement time t = 1 day and for the sample geometry of Ø 62 mm, height 100 mm.
Figure 7. The area uncertainty (%) versus the energy of the full absorption peak at the measurement time of t = 1 d, and sample geometry of Ø 62 mm, height 100 mm.
Table 6.The decision thresholds g for 235U, 234Pa and 208Tl for the aluminum sample at the relative detector efficiency of 20%,
the measurement time of 7 d and the sample mass of 1.8 kg.
Nuclide Pγ ε E (keV) g (Bq)
235U 10.960 0.00646 143.75 0.178
235U 5.080 0.00663 163.33 0.250
235U 57.200 0.00701 185.68 0.073
235U 5.010 0.00734 205.27 0.225
234Pa 20.000 0.00634 131.2 0.135
234Pa 11.400 0.00781 227.2 0.139
234Pa 10.200 0.00624 569.5 0.149
234
Pa 15.000 0.00456 883.24 0.154
234Pa 12.000 0.00403 946 0.190
208Tl 99.830 0.0000243 2614.82 7.988
0 0.0005 0.001 0.0015 0.002 0.0025 0.003 0.0035 0.004
0 500 1000 1500 2000 2500 3000
D
ec
is
io
n
t
h
re
sh
o
ld
E, keV
Rn* Rn#
0 5 10 15 20 25
0 500 1000 1500 2000 2500 3000
u
(
Nn
),
%
[image:7.595.94.541.529.717.2]with “Lynx” multichannel digital analyzer (Canberra, USA). The germanium crystal of the detector has a di-ameter of 62 mm and a length of 30 mm, which is equivalent to a volume and mass of the active germanium of 90.6 cm3 and 0.482 kg, respectively. The FWHM of the detector at the energy of 1.332 MeV was determined to be 1.7 keV.
4. Experiment
The concentration and specific radioactivity of potassium, uranium, thorium and their daughter nuclei were measured with the gamma spectrometric method. The concentrations of As, Ce, Co, Cr, Fe, Hf, La, Na, Sb, Sc, Sm, Th, U, Zn have been measured with the instrumental neutron activation analysis.
1) Relative gamma spectrometric technique
The relative gamma spectrometric technique was used to measure the absolute decay rate and the spontaneous fission rate of the natural radioactive elements in samples analyzed. Here the specific activity SAs of a radioi-sotope is obtained by direct comparison with the activity Ast of the same radionuclide given in a reference gamma-ray-emitting-source by the following equation [18]
( )
( )
st st sm st sm
sm st sm sm
E A S t
SA
m S t E
µ µ
= ⋅ ⋅ (5)
where the subscripts sm and st mark the value belonging to the sample and the reference source, respec-tively, the msm is sample mass and S is the area of the full absorption peak. The t is measurement time of a gamma-ray spectrum. The
µ
sm andµ
st are gamma-ray transmission coefficients of the sample and reference source materials, respectively. The energy dependence of the gamma-ray transmission coefficient assuminga=R can be calculated according to expression
( )
0 1 ( )( 0)0
π 2
cos 2
π
0 0
2 1
d d d e sin d
π
E h h h l a
h
E h
la
τ θ
θ
µ
ρ ρ
ϕ
θ θ
− ⋅ −
+
−
=
∫ ∫
∫
∫
(6)where
τ
( )
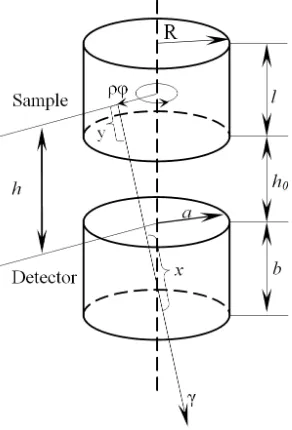
E is the total linear absorption factor of the sample or reference source, respectively. Figure 8 [image:8.595.242.388.484.699.2]shows the registration geometry of the gamma-ray with the Ge detector. The x and y are distances travelled by γ-ray through the detector and the sample, respectively, the a and R are the detector and the sample radii, re-spectively, the b and l are the detector and the sample heights, rere-spectively, the h0 is the detector-sample dis-tance inFigure 8 and in Equation (6).
Given in theFigure 9are the energy dependences of the gamma-ray transmission coefficient for the Al, Ti, KBr, the UO2(NO3)2·6H2O and quartz glass samples of size R=3.1 cm, l=10 cm used in the routine analys-es for the determination of radioactivity of the natural radioactive elements.
To carry out measurements the reference gamma-ray-emitting-sources of 40K, 228Th, 238U, 235U, 234U and their daughter nuclei with the accurately known the absolute decay rates were prepared. The UO2(NO3)2·6H2O (m=750 g,
ρ
=2.807 g cm⋅ −3) and KBr (m=500 g,ρ
=2.75 g cm⋅ −3) were taken as large calibration gam-ma-ray sources. The reference data were taken from the LNHB (available athttp://www.nucleide.org/NucData.htm) and are presented in theTable 7.
[image:9.595.176.455.240.369.2]The samples analyzed and the standard reference gamma-ray-emitting-sources had the same sizes. For mea-surement the time period were taken from 7 to 32 days. The full absorption 208Tl 510.77 keV, 583.19 keV, 40K 1460.82 keV and 214Bi 1729.59 keV, 1764.5 keV peaks registered in the gamma-ray spectra of the samples ana-lyzed given in Figures 10-12.
Figure 9.The energy dependences of the gamma-ray transmission coefficient for the Al, Ti, KBr, the UO2(NO3)2·6H2O and quartz glass samples for R =
[image:9.595.179.451.418.520.2]3.1 cm, l = 10 cm.
Figure 10. The full absorption 208Tl peaks 510.77 keV, 583.19 keV in the ra-dioactive equilibrium 232Th decay chain registered in the gamma-ray spectra of the samples analyzed.
Figure 11. The full absorption 208Tl peak 2614.55 keV in the radioactive
equilibrium 232Th decay chain registered in the gamma-ray spectra of the samples analyzed. 0 0.0005 0.001 0.0015 0.002 0.0025 0.003 0.0035 0.004
500 520 540 560 580 600 620 640 660 680 700
C o u n t s -1·c h a n n el -1 Е, keV Background Ti Glass Al 208Tl 208Tl 0 0.0002 0.0004 0.0006 0.0008 0.001
2550 2600 2650 2700
C o u n t · s -1 · ch an n el -1
E, keV
Background Ti Glass Al
[image:9.595.175.456.571.680.2]Figure 12.The full absorption 40K 1460.82 keV and 214Bi 1729.59 keV, 1764.5 keV peaks registered in the gamma-ray spectra of the samples analyzed.
Table 7. Characteristics of the standard reference gamma-ray-emitting sources.
Material Isotope T½
Absolute decay rate (Bk) Decay mode Particle energy (keV) Particle emission intensity (%)
UO2(NO3)2·6H2O 238U 4.468(5) × 109 y 4.3(3) × 106 α 4198 77.5(5)
4151 22.3(5)
4038 0.13(3)
235U 7.04(1) × 108 y 69.9(2) × 103 α 4397.8 57.19(20)
4366.1 18.30(13)
4214.7 5.95(12)
4596.4 4.74(6)
4556.0 3.79(6)
4322 3.33(6)
4414.9 3.01(16)
4502.4 1.28(5)
234U 2.455(6)·105 y 522(2) × 03 α 4774.6 71.37(2)
4722.4 28.42(2)
4603.5 0.210(2)
228Th 1.9126(9) y 1.70(8) × 103 α 5423.24(22) 74.0(6)
5340.35(22) 26.0(8)
KBr 40K 1.407(7) × 109 y 5.7(2) × 103 β− 1311.09 89.25(17)
11.90(11) × 109 y EC 1504.9 10.55(11)
The decay data were taken from the LNHB (available at http://www.nucleide.org/NucData.htm).
2) Instrumental neutron activation analysis technique
Instrumental neutron activation analysis technique was used to measure the concentrations of 14 trace ele-ments in the samples. The aluminum, titanium, glass samples and comparison standard (IAEA 433 standard ref-erence material) were packed in high-purity quartz glass ampoules. The sample and the comparison standard mass were about 30 - 50 mg. The samples and comparison standard were irradiated in a water channel of the WWR-M reactor for two hours at thermal fth =6.3 10 s× 13 −1⋅cm−2 and epithermal fepi 3.1 10 s12 1 cm2
− −
= × ⋅
neutron fluxes. After irradiation the ampoules were washed out with the 0.5 M HNO3 aqueous solution and the distilled water. The total sample and the comparison standard was measured with the 20% coaxial HPGe detec-tor (Canberra, FWHM 1.7 keV at Eγ =1332.5 keV). The gamma ray spectra were measured after 3, 6 and 20 days of cooling time. The analysis results of the sample and the nuclear characteristics [15] of the nuclides used to determine the concentrations are shown in theTable 8.
0 0.0005 0.001 0.0015 0.002 0.0025 0.003 0.0035 0.004 0.0045
1400 1450 1500 1550 1600 1650 1700 1750 1800
C o u n t · s -1 · c h a n n el -1
E, keV
background
Glass
40K
214Bi
[image:10.595.95.537.245.569.2]Equation (7) shows the time dependence of the daughter nucleus amount for an equilibrium 238U decay chain:
(
) (
) (
)
(
) (
) (
)
1
1 2 1 1,0
2 1 3 1 1 1 2 1
e t e nt
n n
n n n n n
N N
λ λ
λ λ λ
λ λ λ λ λ λ λ λ λ λ λ λ
− − − − = ⋅ + + − ⋅ − − − ⋅ − −
(7)
where the 1,0
100
sm U A
m C a N
N
AW ⋅ ⋅ ⋅ =
⋅ is the number of the uranium nuclei in the samples analyzed, the λ is decay constant, the NA is Avogadro number, the AW is atomic weight, the a is the isotopic abundance, the msm
is sample mass. CU is the mass concentration (%) of uranium in the sample that was measured with the
in-strumental neutron activation analysis. The time period when the activity of the daughter nuclei reaches a max-
imum was calculated with the equation
(
2 1)
2 1 ln mt λ λ
λ λ
=
− . The activity of the daughter nucleus is Ai =
λ
iNi atany time t with the initial condition Ni =0 at t=0. In our case the time t is equal to tm.
5. Discussion
Natural uranium contains 99.274% of 238U, 0.720% of 235U, and 0.0055% of radiogenic 234U. The 238U, 235U and 234
U decay via alpha emission to 234Th, 231Th and 230Th, respectively. The alpha decay energies Qα of the 234U, 235
U, 238U are equal to 4858.5, 4678.7, and 4270 keV [7], respectively. The total radioactivity of the natural ura-nium connected with 238U and 234U for the aluminum, titanium and glass samples shown in theTable 9 can be divided half-and-half between 234U and 238U, as the 235U contribution to the radioactivity of the natural uranium can be neglected. The 238U absolute decay rate is more than 235U rate by the factor of 15.1(30) and 30(12) in the aluminum and glass samples, respectively.
[image:11.595.89.535.443.722.2]The natural radioactivity and spontaneous fission rates of the 238U, 235U, 234U, 232Th and their daughter nuclei were measured with the relative gamma spectrometric technique and were calculated using the INAA data ac-cording to Equation (7). In theTable 9the radioactivities measured Аmeas, calculated Аcalc and spontaneous fis-sion rates I for these radionuclides are listed. Radioactivity of 238U was calculated to be the average of the meas-ured 234Th and 234mPa activity values.
Table 8.Mass concentrations of elements determined measured with NAA technique in Al, Ti and glass samples.
Element Nuclide Eγ
(keV) γ-ray abundance T1/2 (d) CAl (%) CTi (%) Cglass (%)
As 76As 559.1 45 1.078 1.9(1) × 10−3
Ce 141Ce 145.44 48.29 32.5 2.3(3) × 10−4
Co 60Co 1332.49 99.98 1925 2.2(1) × 10−4 7.2(8) × 10−5
Cr 51Cr 320.08 9.91 27.7 2.31(2) × 10−2 1.95(2) × 10−2
Fe 59Fe 1099.25 56.5 44.5 2.2(2) × 10−1 6.8(7) × 10−2
Hf 181Hf 482.18 80.5 42.39 3.9(4) × 10−5
La 140La 1596.21 95.4 1.68 3.2(3) × 10−4 1.6(4) × 10−6
Na 24Na 1368.63 99.99 0.623 1.14(2) × 10−2
Sb 124Sb 602.73 97.79 60.2 1.5(6) × 10−5 9.7(6) × 10−5
Sc 46Sc 889.28 99.98 83.79 3.3(1) × 10−5
Sm 153Sm 103.18 29.25 1.928 9.7(8) × 10−6
Th 233Th 311.90 38.50 26.97 6.1(9) × 10−4
U 239U 106.12 26.3 2.357 3.1(6) × 10−5 4.7(3) × 10−6 7.3(7) × 10−4
Zn 65Zn 1115.54 50.6 244.3 4.66(9) × 10−2
The 238U half-life is 1.41 × 10¹⁷ seconds, therefore 5.58 × 10⁻⁴ g of the 238U have absolute alpha decay rate of 6.8(9) s−1 and produce the same number of 234Th nuclei in the aluminum sample (1800 g). The number of the daughter nuclei with the exception of the 206Pb is decreased with the time but the mass ratio of the daughter nuclei remains constant after the radioactive equilibrium is achieved. If absolute decay rate of 238U is equal to 6.8(9) Bq, then 5.58 × 10⁻⁴ g of the 238U enclose 2.07 × 10⁷ nuclei (7.97 × 10⁻¹⁵ g) of 234Th in the equilibrium radioactive 238U decay chain inside the aluminum sample. Mass concentration of 232Th was calculated according to Equation (9), where a=0.3594 is alpha decay branching of 212Bi, the Asp is specific radioactivity of 208Tl.
[image:12.595.59.540.343.588.2]Mass concentrations and specific activities of 232Th, 234Th and 234mPa in the samples analyzed are listed in the
Table 10.
The 230Th does not have suitable analytical gamma lines for measuring its radioactivity. The radioactivity and neutron emission by spontaneous fission of 230Th were not measured because 238U does not go to radioactivity equilibrium with its daughter nucleus 230Th. The contribution of 230Th in the neutron emission of the sample is negligible since the spontaneous fission probability per decay of 230Th is less than 4 × 10⁻¹²%. The fast neutron radiation intensity normalized to the sample mass was calculated. The intensity values are given in theTable 11.
6. Conclusion
In this work, the evaluation of the gamma and neutron emissions were performed for eight nuclides, from the natural radioactive 238U, 235U and 232Th decay chains for aluminum, titanium and glass. The integral gamma radi-
Table 9.The natural radioactivity A and spontaneous fission rate I of 238U, 235U, 234U, 232Th and their daughter nuclei normalized to the sample mass.
Nuclide T1/2
Eγ
(keV) γabn (%)
Al Glass Ti
Аcalc
(Bk∙g−1) (Bk∙gАmeas−1) (s−1 gI−1) (Bk∙gАcalc−1) (Bk∙gАmeas−1) (s−1I∙g−1) (Bk∙gАmeas−1) (s−1I∙g−1) 238U 4.468 × 10⁹ y 3.8(7) × 10−3 *6.8(9) × 10−3 3.7(5) × 10−9 8.9(9) × 10−3 *1.1(4) × 10−2 6(2) × 10−9 *5.8(3) × 10−4 3.1(2) × 10−10
234Th 24.1 d 92.59 63.3
112.85 4.47 2.562 0.2562
3.8(7) × 10−3 5.9(15) × 10−3 9.0(9) × 10−3 8.2(2) × 10−3 6.5(2) × 10−4
234mPa 1.17 min 766.6
1001 0.207
0.589 3.8(7) × 10
−3 7.7(2) × 10−3 <7.7 × 10⁻¹⁴ 9.0(9) × 10−3 1.4(4) × 10−2 <1.4 × 10⁻¹³ 5.0(4) × 10−4 <5 × 10⁻¹⁵
234Pa 6.70 h 131.2 926.7
880.5 20 22 4
6.2(9) × 10−6 5.3(4) × 10−6 <1.6 × 10⁻¹⁷ 1.4(1) × 10−5 1.9(6) × 10−5 <5.7 × 10⁻¹⁷ Not found
234U 2.455 × 10⁵ y 53.2 2.2 1.6(3) × 10−3 6.5(14) × 10−3 1.1(3) × 10−13 3.6(4) × 10−3 7.6(7) × 10−3 1.2(3) × 10−13 Not found
230Th 7.538 × 10⁴ y
232Th
(208Tl) 1.405 × 10¹⁰ y
2614.9 583.25 510.89
99.16 85.1 22.8
3.7(11) × 10−2 4.1(12) × 10−13 1.32(5) × 10−3 1.5(1) × 10−14 9.1(4) × 10−6 1.0(1) × 10−16
235U 7.038 × 10⁸ y 185.7 54 1.8(3) × 10−4 4.5(3) × 10−4 3.2(3) × 10−14 4.1(4) × 10−4 3.7(1) × 10−4 2.6(2) × 10−14 7.2(2) × 10−5 5.1(3) × 10−15
40K 1.277 × 10⁹ y 1460.8 10.67 - 13.2(3) × 10−2 -
[image:12.595.56.536.629.721.2]The asterisk * marks the average of the measured 234Th and 234mPa activity values because they are daughter nuclei of the natural equilibrium radioactive 238U decay chain. γabn— γ-ray abundance.
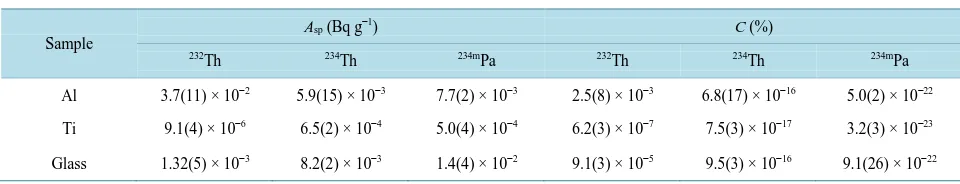
Table 10.The specific activity and content of 232Th, 234Th and 234mPa in the samples analysed.
Sample
Asp (Bq g−1) C (%)
232Th 234Th 234mPa 232Th 234Th 234mPa
Al 3.7(11) × 10−2 5.9(15) × 10−3 7.7(2) × 10−3 2.5(8) × 10−3 6.8(17) × 10−16 5.0(2) × 10−22
Ti 9.1(4) × 10−6 6.5(2) × 10−4 5.0(4) × 10−4 6.2(3) × 10−7 7.5(3) × 10−17 3.2(3) × 10−23
Table 11. Neutron radiation intensity normalized to the sample mass.
Decay chain Nuclide Т1/2 Т1/2(SF) SF (%) nAbn
Ffast s−1∙kg−1
Al Glass Ti
238U 238U 4.468(5) × 109 y 8.202(60) × 1015y 5.45(4) × 10−5 1.98(3) 7.3(11) × 10−6 1.19(46) × 10−5 6.3(5) × 10−7
234
Th 24.10(3) d
234mPa 1.159(11) min <1 × 10⁻⁹
234Pa 6.70(5) h <3 × 10⁻¹⁰
234U 2.455(6) × 105y 1.5(0.2) × 1016 y 1.6(2) × 10−9 1.63(15) 1.7(7) × 10−10 1.98(61) × 10−10
230Th 7.54(3) × 104 y <4 × 10⁻¹²
235U 235U 7.04(1) × 108 y 0.98(28) × 1019y 7.0(2) × 10−9 1.86 5.9(6) × 10−11 4.9(3) × 10−11 9.5(5) × 10−12
232
Th 232Th 1.402(1) × 1010 y 1.22 × 10²¹ y 1.1 × 10⁻⁹ 2.13(20) 8.7(34) × 10−10 3.1(4) × 10−11 2.1(3) × 10−13
ation background normalized to the mass of sample in the energy range 40 keV to 2.7 MeV was determined to be 0.34, 0.084 and 0.81 s−1∙kg−1 for aluminum, titanium and glass, respectively. The background of fast neutrons normalized to the sample mass is determined mainly by spontaneous fission of 238U and is equal to 7.3(11) × 10−6, 1.19(46) × 10−5 and 6.3(5) × 10−7 s−1∙kg−1 for aluminum, glass and titanium, respectively. The 234U radioac-tivity has not been evaluated in the titanium sample. Therefore, the 234U radioactivity was taken to be equal to 238U radioactivity for equilibrium radioactive 238U decay chain in the titanium sample. If the value of the
spon-taneous fission intensity normalized to the sample mass of the titanium is 9.3(16) × 10−15 s−1∙g−1 assuming the spontaneous fission branching of 234U is only 1.6(2) × 10−9 (%) then the radiation intensity of fast neutrons nor-malized to the sample mass is 1.51(4) × 10−10 s−1∙g−1.
References
[1] Wurm, M., Goeger-Neff, M. and Hochmuth, K.A. (2007) Detection Potential for the Diffuse Supernova Neutrino Background in the Large Liquid-Scintillator Detector LENA. Physical Review D, 75, Article ID: 023007.
[2] Schön, R., Winkler, G. and Kustchera, W. (2004) A Critical Review of Experimental Data for the Half-Lives of the Uranium Isotopes 238U and 235U. Applied Radiation and Isotopes, 60, 263-273.
[3] Holden, N.E. and Hoffman, D.C. (2000) Spontaneous Fission Half-Lives for Ground-State Nuclides. Pure and Applied Chemistry, 72, 1525-1562. http://dx.doi.org/10.1351/pac200072081525
[4] Garcia-Toraño, E. (2000) Alpha-Particle Emission Probabilities in the Decay of 238U. Applied Radiation and Isotopes, 52, 591-594. http://dx.doi.org/10.1016/S0969-8043(99)00215-8
[5] Browne, E. and Tuli, J.K. (2007) Nuclear Data Sheets for A = 234. Nuclear Data Sheets, 108, 681-772. http://dx.doi.org/10.1016/j.nds.2007.02.003
[6] Hadler, J.C., Bigazzi, G., Guedes, S., Iunes, P.J., Oddone, M., Tello, C.A. and Paulo, S.R. (2003) Spontaneous 238U Fission Half-Life Measurements Based on Fission-Track Techniques. Journal of Radioanalytical and Nuclear Chemi-stry, 256, 155-157.
[7] Firestone, R.B. (1998) Table of Isotopes [CD-ROM]. Lawrence Berkeley National Laboratory, Berkeley.
[8] Von Gunten, H.R., Grütter, A. and Reist, H.W. (1981) Ground-State Spontaneous-Fission Half-Lives of Uranium Iso-topes. Physical Review C, 23, 1110-1112. http://dx.doi.org/10.1103/PhysRevC.23.1110
[9] Akovali, Y.A. (1994) Nuclear Data Sheets for A = 234. Nuclear Data Sheets, 71, 181-259. http://dx.doi.org/10.1006/ndsh.1994.1006
[10] Wang, S., Brice, P.B., Barmick, S.W., Moody, K.J. and Hulet, E.K. (1987) Radioactive Decay of U234 via Ne and Mg Emission. Physical Review C, 36, 2717. http://dx.doi.org/10.1103/PhysRevC.36.2717
[11] Tuli, J.K. (2011) Nuclear Wallet Cards. 8th Edition, National Nuclear Data Center, Brookhaven National Laboratory, New York.
[12] Artna-Cohen, A. (1997) Nuclear Data Sheets for A = 228. Nuclear Data Sheets, 80, 723-786. http://dx.doi.org/10.1006/ndsh.1997.0007
http://dx.doi.org/10.1016/j.nds.2005.01.002
[14] Browne, E. (2003) Nuclear Data Sheets for A = 235,239. Nuclear Data Sheets, 98, 665. http://dx.doi.org/10.1006/ndsh.2003.0005
[15] Chatani, H. (1983) A Measurement of the Averaged cross Section for the 232Th(n, 2n)231Th Reaction with a Fission Plate. Nuclear Instruments and Methods, 205, 501-504. http://dx.doi.org/10.1016/0167-5087(83)90016-9
[16] Köhler, M., Degering, D. and Laubenstein, M. (2009) A New Low-Level g-Ray Spectrometry System for Environ-mental Radioactivity at the Underground Laboratory Felsenkeller. Applied Radiation and Isotopes, 67, 736-740. [17] DIN 25482-5 (1993) Limit of Detection and Limit of Decision for Nuclear Radiation. Measurements—Part 5:
Count-ing Measurements by High Resolution Gamma. Spectrometry, NeglectCount-ing the Influence of Sample Treatment. Beuth-Verlag, Berlin.
[18] Erdtmann, G. and Petri, H. (1986) Nuclear Activation Analysis: Fundamentals and Techniques. In: Elving, P.J., Ed.,