Adaptation of rabbit cortical collecting duct
HCO3- transport to metabolic acidosis in vitro.
S Tsuruoka, G J Schwartz
J Clin Invest.
1996;
97(4)
:1076-1084.
https://doi.org/10.1172/JCI118500
.
Net HCO3- transport in the rabbit kidney cortical collecting duct (CCD) is mediated by
simultaneous H+ secretion and HCO3- secretion, most likely occurring in a alpha- and
beta-intercalated cells (ICs), respectively. The polarity of net HCO3- transport is shifted from
secretion to absorption after metabolic acidosis or acid incubation of the CCD. We
investigated this adaptation by measuring net HCO3- flux before and after incubating CCDs
1 h at pH 6.8 followed by 2 h at pH 7.4. Acid incubation always reversed HCO3- flux from
net secretion to absorption, whereas incubation for 3 h at pH 7.4 did not. Inhibition of
alpha-IC function (bath CL- removal or DIDS, luminal bafilomycin) stimulated net HCO3- secretion
by approximately 2 pmol/min per mm before acid incubation, whereas after incubation these
agents inhibited net HCO3- absorption by approximately 5 pmol/min per mm. Inhibition of
beta-IC function (luminal Cl- removal) inhibited HCO3- secretion by approximately 9
pmol/min per mm before incubation, whereas after incubation HCO3- absorption by only 3
pmol/min per mm. After acid incubation, luminal SCH28080 inhibited HCO3- absorption by
only 5-15% vs the circa 90% inhibitory effect of bafilomycin. In outer CCDs, which contain
fewer alpha-ICs than midcortical segments, the reversal in polarity of HCO3- flux was
blunted after acid incubation. We conclude that the CCD adapts to low pH in vitro by […]
Research Article
Find the latest version:
J. Clin. Invest.
© The American Society for Clinical Investigation, Inc. 0021-9738/96/02/1076/09 $2.00
Volume 97, Number 4, February 1996, 1076–1084
Adaptation of Rabbit Cortical Collecting Duct HCO Transport to Metabolic
Acidosis In Vitro
Shuichi Tsuruoka and George J. Schwartz
Departments of Pediatrics and Medicine, University of Rochester School of Medicine and Dentistry, Rochester, New York 14642 3
2
Abstract
Net HCO transport in the rabbit kidney cortical collecting duct (CCD) is mediated by simultaneous H1 secretion and
HCO secretion, most likely occurring in a- and b -inter-calated cells (ICs), respectively. The polarity of net HCO transport is shifted from secretion to absorption after meta-bolic acidosis or acid incubation of the CCD. We investi-gated this adaptation by measuring net HCO flux before and after incubating CCDs 1 h at pH 6.8 followed by 2 h at pH 7.4. Acid incubation always reversed HCO flux from net secretion to absorption, whereas incubation for 3 h at pH 7.4 did not. Inhibition of a-IC function (bath Cl2
re-moval or DIDS, luminal bafilomycin) stimulated net HCO secretion by z 2 pmol/min per mm before acid incubation,
whereas after incubation these agents inhibited net HCO absorption by z 5 pmol/min per mm. Inhibition of b-IC
function (luminal Cl2 removal) inhibited HCO secretion
by z 9 pmol/min per mm before incubation, whereas after
incubation HCO absorption was stimulated by only z 3
pmol/min per mm. After acid incubation, luminal SCH28080 inhibited HCO absorption by only 5–15% vs the z 90%
in-hibitory effect of bafilomycin. In outer CCDs, which con-tain fewer a-ICs than midcortical segments, the reversal in polarity of HCO flux was blunted after acid incubation. We conclude that the CCD adapts to low pH in vitro by downregulating HCO secretion in b-ICs via decreased api-cal Cl2/base exchange activity and upregulating HCO
ab-sorption in a-ICs via increased apical H1-ATPase and
baso-lateral Cl2/base exchange activities. Whether or not there is
a reversal of IC polarity or recruitment of g-ICs in this ad-aptation remains to be established. (J. Clin. Invest. 1996. 97:
1076–1084). Key words: acid–base equilibrium • ion trans-port • intercalated cell • kidney • H1-ATPase
3
2
3
2
3
2
3
2
3
2
3
2
3
2
3
2
3
2
3
2
3
2
3
2
3
2
Introduction
The cortical collecting duct (CCD)1 plays an important role in the regulation of acid–base homeostasis. This nephron seg-ment is capable of bicarbonate reabsorption and bicarbonate secretion, depending on the acid–base state of the animal (1–5). Each of these opposing transport processes is believed to be accomplished by a subtype of intercalated cell (5–10). Interca-lated cells comprise about a third of all CCD cells; the majority cell type is the principal cell, which is not believed to be in-volved in acid–base homeostasis (1, 6, 7, 11). Reabsorption of HCO is believed to be accomplished by a-intercalated cells, which are endowed with an apical H1-ATPase and a
basolat-eral Cl2–HCO exchanger (5, 8–10, 12). Secretion of HCO is
accomplished by b-intercalated cells, which have some form of H1 pump in or near the basolateral membrane and a Cl2–
HCO exchanger in the apical membrane (5, 8, 9, 12–14). The function of other types of intercalated cells including “hybrid” and “g” forms (9, 13, 15, 16) is not presently clear.
CCDs taken from control rabbits and perfused in vitro with solutions resembling ultrafiltrate of rabbit plasma generally se-crete net HCO (3, 13, 17, 18). Acid feeding of the rabbit, however, usually results in net HCO absorption, equivalent to net H1 secretion (2, 3, 5, 17, 18). The mechanisms
underly-ing this change in direction of HCO flux are not well under-stood. We have recently developed a model of metabolic aci-dosis in vitro by which CCDs reverse their polarity of net HCO flux after 3 h of incubation at low pH (17). These stud-ies revealed that in vitro exposure to an acid environment in-duced extensive remodeling of HCO -secreting b-intercalated cells, especially apical membrane components including the PNA binding sites and Cl2–HCO exchanger (17). This
re-modeling was accomplished in b-cells by increased apical fluid–phase endocytosis, a marker heretofore associated pri-marily with a-intercalated cells (5, 19–21). Indeed, in response to acid exposure, CCDs showed decreased HCO secretion, a process which required de novo protein and RNA synthesis and integrity of cellular microfilaments (22). Functional changes in response to low pH were apparent in the b -interca-lated cells but not in a limited study of a-intercalated cells (22). It was the purpose of this work to study in more detail how net HCO transport of the mid-CCD responds to acid incuba-tion in vitro. In this study we have focused primarily on a -inter-calated cell function using inhibitors of a cell HCO transport to understand better the cellular mechanisms of adaptation to low pH in vitro. The data show that both a- and b-intercalated cells appear to adapt to low pH in vitro: b-intercalated cells de-crease the secretion of HCO whereas a-intercalated cells in-crease their secretion of protons.
3
2
3
2
3
2
3
2
3
2
3
2
3
2
3
2
3
2
3
2
3
2
3
2
3
2
3
2
Portions of this material were presented in abstract form at the American Society of Nephrology Annual Meeting in San Diego, Cal-ifornia, 5–8 November 1995.
Address correspondence to George J. Schwartz, M.D., Professor of Pediatrics and Medicine, Chief, Pediatric Nephrology, Box 777 University of Rochester Medical Center, 601 Elmwood Avenue, Rochester, New York 14642. Phone: 716-275-9784; FAX: 716-273-1038.
Received for publication 10 August 1995 and accepted in revised form 17 November 1995.
Methods
Animals. Female New Zealand white rabbits weighing 2–3 kg and maintained on normal laboratory chow (Purina lab diet No. 5326; Pu-rina Mills, Richmond, IN) plus free access to tap water were used in this study. The diet provides 0.25% Na, 1.2% K, 0.5% Cl, and 1.1% Ca. Animals were killed by intracardiac injection of 130 mg pentobar-bital sodium after premedication with ketamine (44 mg/kg) and xyla-zine (5 mg/kg). Blood taken from the heart at the time of death yielded a mean pH of 7.3960.01 and an HCO concentration of 26.960.6 mM (n = 33). The urine, obtained postmortem by bladder puncture, had a pH of 7.9960.11 (n = 38).
Tubule isolation. Kidneys were removed quickly and coronal slices were made. They were transferred to dishes with chilled solu-tion for microdissecsolu-tion containing the following (in mM): 145 NaCl, 2.5 K2HPO4, 2 CaCl2, 1.2 MgSO4, 5.5 d-glucose, 1 Na3 citrate, 4 Na lactate and 6 l-alanine, pH 7.4, 29062 mosmol/kg (13, 17). CCDs were isolated by freehand dissection from the medullary rays of the midcortex using fine forceps under a stereomicroscope. The midcorti-cal tubules used in this study did not contain arcades or the outermost part of the CCD, wherein g-intercalated cells have been reported to be most common (15). The mean length averaged 1.260.2 mm (n = 33). In one series, collecting ducts were obtained from the outer 1.5 mm of cortex, just distal to the last branch point (23) but clearly prox-imal to where mid-CCDs were microdissected. The length of these segments averaged 0.760.1 mm (n = 6).
In vitro microperfusion. In vitro microperfusion developed by Burg (24) was used with modification (5, 17, 22). An isolated CCD was rapidly transferred to a 1.2-ml temperature-controlled chamber mounted on an inverted microscope (Diaphot; Nikon Instrument Corp., Madison, WI) and perfused and bathed at 378C. The collecting end of the CCD was sealed into a holding pipet using Sylgard 184 (Dow Corning Corp., Midland, MI). Samples of tubular fluid were collected under water-saturated mineral oil by timed filling of a cali-brated volumetric constriction pipette (12–14 nl). Three collections were made during each experimental period.
Bicarbonate transport. The concentration of total CO2 (assumed to be equal to that of HCO ) in perfusate (Co) and collection fluid (CL) were measured by microcalorimetry (Picapnotherm; Microana-lytical Instrumentation, Mountain View, CA). Because there is no net water absorption in this segment (5, 25), the rate of HCO transport (JHCO3) was calculated as follows: JHCO3 = (CO2 CL) (VL/L), where VL is the rate of collection of tubular fluid determined from the time (in minutes) required to fill the calibrated volumetric pipette, L is the tu-bular length (in mm), and J is in pmol/min per mm. When JHCO3 is . 0 there is net HCO absorption, and when JHCO3 is , 0 there is net HCO secretion. Net HCO absorption is considered to be net H1
secretion, and these terms are used interchangeably. The effect of an experimental maneuver on baseline or control HCO transport was determined as the change in HCO flux or DJHCO3. A positive DJHCO3 indicates an increase in HCO absorptive flux, which can be medi-ated by increased H1 secretion and/or decreased HCO secretion,
whereas a negative DJHCO3 indicates an increase in HCO secretory flux, which can be mediated by decreased H1 secretion and/or
in-creased HCO secretion.
The sensitivity of the Picapnotherm ranged between 9 and 18 counts per pmol tCO2, so that for samples of 13 nl there were 117–234 counts/mM tCO2. The coefficient of variation for a 20-mM standard measured in quadruplicate was , 0.3% (,10 counts for a sample of 2,500 counts). This level of sensitivity allowed us to reliably detect HCO concentration differences of 1 mM between perfused and col-lected fluids.
Each solution was adjusted to pH 7.4 and 29062 mosmol/kg and continuously bubbled with 94% O2/6% CO2 gas at 378C (22, 26). The bath chamber and perfusate reservoir were suffused by the same gas continuously. The flow rate of bathing solution entering the specimen chamber was kept at 14 ml/h by a peristaltic pump. The perfusion rate was maintained at 1–3 nl/min.
3
2
3
2
3
2
3
2
3
2
3
2
3
2
3
2
3
2
3
2
3
2
3
2
3
2
Transepithelial voltage (Vte). Vte was measured using the perfu-sion pipette as an electrode. The voltage difference between calomel cells connected via 3 M KCI agar bridges to perfusing and bathing so-lutions was measured with a high impedance electrometer (World Precision Instruments, New Haven, CT).
After the initial equilibration, the study protocols were started. Collections of tubular fluid were initiated once the Vte had stabilized, and readings were recorded at the conclusion of each collection. Sam-ple collections after each experimental maneuver did not commence until the Vte had stabilized (generally . 20 min).
Viability. Evidence for damaged cells and gross leak of perfusate were assessed by addition of 0.15 mg/ml FD & C green dye to all per-fusates during the study (22).
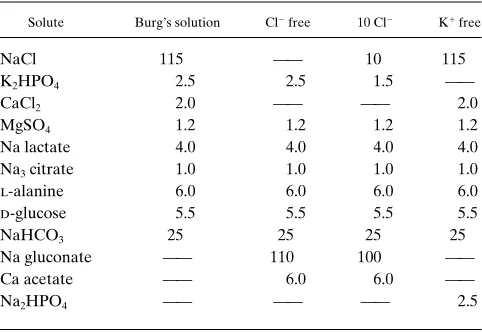
Solutions. The composition of solutions used in this study are shown in Table I. Calcium concentration was raised in Cl-free solu-tion to allow for addisolu-tional complexing by gluconate (5, 17, 25). The concentration of chloride in Cl2-free solution and potassium in K1
-free solution were confirmed to be zero by electrode and flame pho-tometer, respectively.
3-h incubation. In most protocols, JHCO3 was measured under control conditions, experimental conditions, and recovery before and after an acid incubation. A 3-h incubation at pH 7.4 served as a time control for the acid incubation. Because we (22) had previously shown a significant reduction in stimulated HCO secretion (accom-plished by removing bath Cl2) after 1 h at pH 6.8 followed by 2 h at
pH 7.4, we used the same maneuver to examine net HCO -transport in the present studies. The rationale for dividing the 3-h incubation into a 1-h exposure to low pH followed by a 2-h recovery is based on the expectation that renal cell physiology, metabolism, and protein synthesis are better maintained at “normal” ambient pH, and that the adaptive process to respond to the acid stimulus would be facilitated at higher pH. The preincubation studies were generally completed within 3 h of death. After the 3-h incubation, the fluid collections and equilibrations were completed within 2 h, so that the total time of each experiment was usually 7–8 h.
The pH 7.4060.02 solution for incubation contained DME with 44 mM NaHCO3 (GIBCO BRL, Gaithersburg, MD), Burg’s solution, and HCO -free dissecting solution in a ratio of 3:5:1, respectively. The pH 6.8060.02 solution contained DME with no NaHCO3 (GIBCO BRL,) Burg’s solution, and dissection solution in a ratio of 3:2:4, respectively (17, 22). These solutions also contained 30 U/ml penicillin, 30 mg/ml streptomycin (GIBCO BRL), and 3.3% FCS (GIBCO BRL).
Chemicals. Bafilomycin A1, 4,49-diisothiocyanostilbene-2,29 -disul-fonic acid (DIDS), and ouabain were purchased from Sigma Chemi-cal Co. (St. Louis, MO).
2-methyl-8-(phenylmethoxy)imidazo[1,2-a]pyridne-3-acetonitrile (SCH28080) was kindly provided by Dr. Ted 3
2
3
2
3
[image:3.612.315.556.556.722.2]2
Table I. Composition of Solutions
Solute Burg’s solution Cl2 free 10 Cl2 K1 free
NaCl 115 —— 10 115
K2HPO4 2.5 2.5 1.5 ——
CaCl2 2.0 —— —— 2.0
MgSO4 1.2 1.2 1.2 1.2
Na lactate 4.0 4.0 4.0 4.0
Na3 citrate 1.0 1.0 1.0 1.0
l-alanine 6.0 6.0 6.0 6.0
d-glucose 5.5 5.5 5.5 5.5
NaHCO3 25 25 25 25
Na gluconate —— 110 100 ——
Ca acetate —— 6.0 6.0 ——
Na2HPO4 —— —— —— 2.5
Sybertz from Schering-Plough Research Institute (Kenilworth, NJ). Bafilomycin, SCH28080, and DIDS were dissolved in DMSO at 0.1% final concentration.
Statistics. Results are presented as mean6SE, where n is the number of tubules. Data from each tubule before incubation were compared with those from after the incubation in a paired t test. Comparisons of mid-CCDs to outer-CCDs were made by unpaired t
test. P, 0.05 was regarded as significant. Statistical comparisons were performed using Number Cruncher Statistical System (Kaysville, UT).
Results
Acid incubation
We first performed two pilot studies to determine the mini-mum time required for a reversal of polarity of HCO flux. After a baseline net transport period, one CCD was exposed to pH 6.8 solutions in lumen and bath for 1 h, after which Burg’s solution was restored to both sides of the tubule for re-peat HCO transport studies. Two more cycles of low pH ex-posure and transport measurements were then performed. The net HCO flux was as follows: control, 24.49; 1 h, 24.46; 2 h, 1.20; and 3 h, 4.23 pmol/min per mm. After a baseline net transport period, a second CCD was exposed to pH 6.8 for 1 h followed by 1 h at pH 7.4, after which repeat net HCO flux was measured. Then, after another hour of incubation at pH 7.4, net HCO flux was determined again. The net HCO flux was as follows: control, 23.96; 2 h, 20.86; and 3 h, 3.51 pmol/ min per mm.
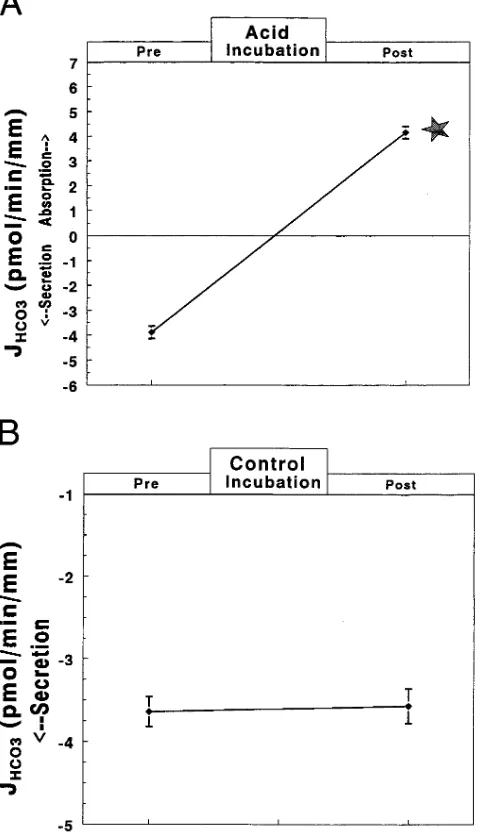
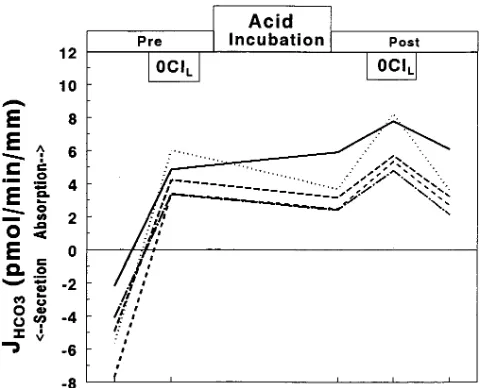
Our preliminary studies showed that the secretion of net HCO flux reversed to approximately the same rate of ab-sorption after 3 h of incubation at low pH or after 1 h of incu-bation at low pH followed by 2 h at pH 7.4, similar to what was previously reported by our group (17). As shown in Fig. 1 A, CCDs secreted HCO before incubation, and this secretory flux converted to about the same rate of HCO absorption af-ter 1 h at pH 6.8 followed by 2 h at pH 7.4 (from 23.8760.23 to 4.1060.23 pmol/min per mm, n = 29, P, 0.01). The mean shift in net HCO flux (DJHCO3 = 7.9860.26 pmol/min per mm, P, 0.01 vs 0). Concomitant with the increase in H1 secretion was
a decrease in electronegativity of Vte from 24.160.2 to 23.660.2 mV (mean change in voltage 0.460.1, n = 29, P, 0.01).
Time control. On the other hand, tubules that were incu-bated for 3 h at pH 7.4 (Fig. 1 B) showed no change in JHCO3, from 23.6460.18 to 23.5760.21 pmol/min per mm (DJHCO3 = 0.0760.10 pmol/min per mm, n = 4, P. 0.5 vs 0). Nor was there a significant change in Vte (mean change 20.260.1 mV, P . 0.2). Thus, there was no time-dependent decrease in HCO secretion, as previously observed by others (27), per-haps because of factors contained in the incubation medium or FCS that helped to maintain HCO secretion under the present experimental conditions.
Inhibition of a-intercalated cell function
To investigate the cellular mechanisms of this change, we ex-amined the effects of several inhibitors of a-intercalated cell function to this adaptation. We hypothesized that if a -interca-lated cells were stimu-interca-lated to secrete protons after incubation at low pH, then inhibition of a cell function would have a larger effect after than before acid incubation.
Cl2-free bath. Removal of basolateral Cl2 inhibits the
ac-tivity of the basolateral Cl2- base exchanger, thereby blocking
HCO exit and luminal H1 secretion from a-intercalated cells
3
2
3
2
3
2
3
2
3
2
3
2
3
2
3
2
3
2
3
2
3
2
3
2
3
2
(5, 10, 11, 28). This maneuver was performed in four CCDs to evaluate the magnitude of H1 secretion (in the simultaneous
presence of HCO secretion) before and then after acid in-cubation. Before incubation (Fig. 2), removal of Cl2
revers-ibly increased net HCO secretion from 23.8860.16 to 26.3160.13 and back to 23.9060.16 pmol/min per mm (mean DJHCO3 = 22.4260.09 pmol/min per mm, P , 0.01 vs zero).
After acid incubation (see Fig. 2), net HCO flux was in the absorptive direction and was completely inhibited by re-moving basolateral Cl2 (from 4.3160.42 to 20.4160.03 pmol/
min per mm, with mean DJHCO3 = 24.7260.44 pmol/min per mm, P, 0.01 vs 0). Note that the inhibition in HCO flux af-ter acid incubation was 2.30 pmol/min per mm more than that observed before incubation. The effect of removing basolat-eral Cl2 was completely reversible after acid incubation.
3
2
3
2
3
2
3
[image:4.612.317.557.66.486.2]2
Figure 1. Mean6SE of net HCO flux (JHCO3, pmol/min per mm) before and after (A) acid incubation (1 h at pH 6.8 followed by 2 h at pH 7.4; n = 29 CCDs) or (B) control incubation (3 h at pH 7.4; n = 4 CCDs). Transport of HCO was obtained while perfusing and bath-ing each CCD in Burg’s solution (25 mM HCO , pH 7.4). The star in-dicates P, 0.01.
3
2
3
2
3
Basolateral DIDS. We used 50 mM DIDS as a direct inhib-itor of the basolateral Cl2-base exchanger of a-intercalated
cells (10, 15, 16) in four CCDs (Fig. 3). Before acid incubation (when CCDs were secreting HCO ), DIDS increased net HCO secretion from 23.4360.21 to 27.1960.66 pmol/min per mm (mean DJHCO3 = 23.7760.53 pmol/min per mm, P, 0.01 vs 0).
After acid incubation, the resulting HCO absorption was completely inhibited by DIDS, and some small residual HCO secretion was uncovered (4.4360.35 to 21.8160.27 pmol/min per mm). The mean DJHCO3 was 26.2460.44 pmol/min per mm, 2.47 pmol more than that observed with DIDS before acid incubation (P, 0.01). The effect of DIDS was reversible, as shown previously (29), because after acid incubation all CCDs were absorbing net HCO (see Fig. 3), comparable to
3
2
3
2
3
2
3
2
3
2
what was observed in the Cl2-free bath studies described
above.
Luminal bafilomycin. We next examined the effect of 5 nM bafilomycin (30, 31) to inhibit the luminal H1-ATPase of
a-intercalated cells (Fig. 4). Before the incubation, bafilomy-cin caused a small increase in net HCO secretion from 23.2460.33 to 24.3160.28 pmol/min per mm (mean DJHCO3 = 21.0760.34, n = 5, P, 0.05). However, after the acid incuba-tion there was net HCO absorpincuba-tion (4.0960.36 pmol/min per mm), and this was completely inhibited by luminal bafilomycin (0.2360.45 pmol/min per mm) with mean DJHCO3 = 23.8660.41 pmol/min per mm, n = 6, P, 0.01. The effect of bafilomycin on net HCO transport was 2.79 pmol/min per mm larger after acid incubation compared with that observed before the incubation. Also, after acid incubation, when these CCDs were absorbing HCO , the effect of bafilomycin was completely reversible (recovery JHCO3 = 3.9160.51, not differ-ent from postincubation period before bafilomycin, P. 0.2), as shown previously (32).
As expected from the inhibition of electrogenic H1
secre-tion, bafilomycin caused Vte to become more electronegative before incubation when net HCO was secreted (from 24.160.5 to 24.860.3 mV, P, 0.05), and after incubation when net H1 was secreted (from 23.860.3 to 24.960.3, P,
0.01). The mean change in Vte, DVte, was 57% larger after acid incubation (mean DVte = 20.760.2 before and 21.160.1 mV after incubation).
Bafilomycin was also tested in four CCDs incubated at pH 7.4 for 3 h (Fig. 5). Before the incubation, bafilomycin caused an increase in net HCO secretion of 2.0960.22 pmol/min per mm (P , 0.01), which was completely reversible (control, 23.6460.18; bafilomycin, 25.7360.1; recovery, 23.5060.20 pmol/min per mm). After incubation at pH 7.4, net HCO se-cretion was maintained at 23.5760.22 pmol/min per mm and was stimulated to the same extent by bafilomycin (25.8860.14 pmol/min per mm). The mean increase in HCO secretion was 2.3160.15 pmol/min per mm, similar to the increase observed before incubation.
The effect of bafilomycin to increase the electronegativity of Vte was comparable before and after incubation at pH 7.4
3
2
3
2
3
2
3
2
3
2
3
2
3
2
3
[image:5.612.58.300.57.255.2]2
Figure 2. Effect of Cl2-free bath on J
HCO3 in four individual tubules before (Pre) and after (Post) acid incubation. Unless noted in the boxes at the top of this and subsequent figures, JHCO3 was measured using Burg’s solution (25 mM HCO ) in both perfusate and bath. Each line represents a separate tubule.
3
[image:5.612.64.557.516.710.2]2
[image:5.612.309.557.516.708.2]Figure 3. Effect of 50 mM DIDS added to the bath on JHCO3 in five CCDs before (Pre) and after (Post) acid incubation.
(DVte = 21.560.2 before and 21.560.2 mV after incubation). The effect of bafilomycin on Vte before pH 7.4 incubation was entirely reversible (control, 22.760.1; bafilomycin, 24.260.2; recovery, 22.660.2 mV).
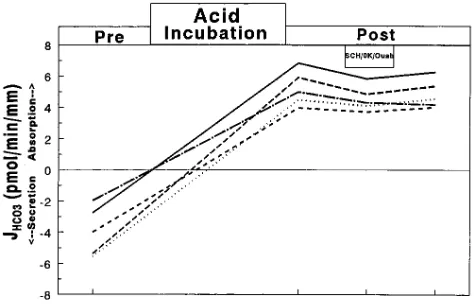
Luminal SCH28080. In view of the potential role of the H1,K1-ATPase in mediating H1 secretion in a-intercalated
cells (31, 33, 34), the effect of 10 mM SCH28080, a specific in-hibitor of this transporter, applied to the luminal solution, was examined after acid incubation (Fig. 6). The rate of net HCO absorption was inhibited only 5% by SCH28080 (incubation, 3.7160.26; SCH28080, 3.5360.22; P, 0.05). The effect was not completely reversible (recovery, 3.6460.24; P , 0.05 vs postincubation). The inhibitor had no significant effect on Vte (postincubation, 22.760.4; SCH28080, 22.760.4; recovery, 22.760.4).
Because HCO absorption was only minimally inhibited in the CCD by SCH28080, it was possible that the sensitivity of the H1,K1-ATPase in the CCD was different from that in
outer medullary collecting duct (OMCD) or in gastric mucosa. We therefore tried a second approach: inhibiting the H1,K1
-3
2
3
2
ATPase not only by SCH28080, but also by removing luminal K1 (34) (see Table I) and adding 0.1 mM ouabain to the
solu-tion bathing the tubule to inhibit any K1 secretion by
neigh-boring principal cells (Fig. 7). Still, the net HCO absorption observed after acid incubation was inhibited by only 10–15% (postincubation, 5.2660.45; SCH28080/0K1/ouabain, 4.5860.3
pmol/min per mm; P, 0.05). The mean rate of H1 secretion
after SCH28080 was 89.461.3% of that observed after acid in-cubation. The effect on JHCO3 was reversible (recovery, 4.8960.38 pmol/min per mm, arithmetically lower but not different from the postincubation period before SCH28080; P. 0.1).
The use of ouabain, in addition to SCH28080, caused Vte to become electropositive, but this was not completely revers-ible (postincubation, 23.260.3; SCH28080, 1 1.060.1 mV, P, 0.01; recovery, 21.560.6, P, 0.05). Presumably the small positive voltage reflects electrogenic H1 secretion that was not
inhibited by this maneuver (approximately of the same order of magnitude as that which was inhibited by bafilomycin after acid incubation [see above]).
Inhibition of b-intercalated cell function
The adaptation to metabolic acidosis might involve other acid– base transporting cells in addition to a-intercalated cells. In-deed, we have previously shown that acid incubation causes a decrease in maximally stimulated HCO secretion (accom-plished by removing bath Cl2 to inhibit any H1 secretion) (17,
22). In the present study we evaluated the effect of incubating CCDs for 1 h at pH 6.8 followed by 2 h at pH 7.4 on the rate of net HCO transport.
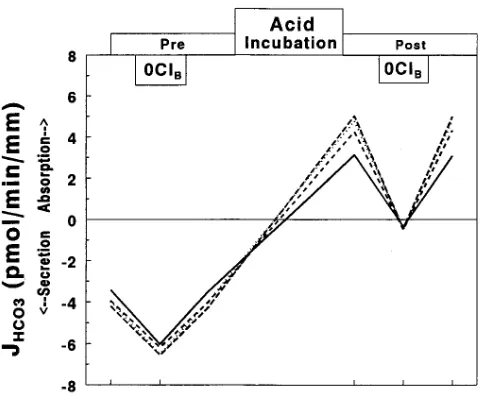
Cl2-free lumen. We removed luminal Cl2 before and after
acid incubation to determine the rate of Cl2-dependent HCO
secretion, a function of b-intercalated cells (13, 35–37). To avoid the high bath-to-lumen gradient, we reduced basolateral Cl2 to 10 mM (Table I). Before incubation when HCO
secre-tion was inhibited (Fig. 8), a large H1 secretory flux was
un-covered (control, 24.9260.91; Cl2-free lumen, 4.3860.50
pmol/min per mm). After acid incubation, net H1 secretion
was observed, and this was further stimulated by luminal Cl2 removal (postincubation, 3.5460.64; Cl2-free lumen,
6.3860.69; recovery, 3.5660.68). The change in net HCO flux due to luminal Cl2 removal was more than three times larger
before incubation (DJHCO3 = 9.2960.93 before and 2.8360.46 3
2
3
2
3
2
3
2
3
2
3
[image:6.612.58.299.56.254.2]2
Figure 5. Effect in five CCDs of 5 nM luminal bafilomycin on JHCO3 before (Pre) and after (Post) control incubation.
[image:6.612.315.552.550.703.2]Figure 6. Effect in four CCDs of 10 mM luminal SCH28080 on JHCO3 before (Pre) and after (Post) acid incubation.
Figure 7. Effect in five CCDs of 5 mM luminal SCH28080 plus K1
[image:6.612.56.299.557.712.2]pmol/min per mm after incubation, P, 0.01 vs before incuba-tion). The increment observed after acid incubation was 6.46 pmol/min per mm smaller than before incubation, suggesting that the b-intercalated cells have downregulated HCO secre-tion in response to the low pH exposure. Also, the maximum rate of net HCO absorption (6.38 pmol/min per mm in Cl2
-free luminal solution) was achieved after, not before, acid in-cubation, indicating that, in addition to the decrease in HCO secretion, H1 secretion had been stimulated.
Outer CCD
Because of the heterogeneity of the CCD, it is not possible to be unequivocally certain that regulation of HCO transport is occurring exclusively in a- or b-intercalated cells. This is a lim-itation of our net HCO flux analysis that cannot be readily addressed by cell pH experiments, morphological studies, or immunocytochemistry. Nevertheless, we surmised that an-other segment of the collecting duct, which has a different dis-tribution and number of intercalated cell types, might respond differently to acid incubation and inhibition of a cell function. The outer CCD has few a-intercalated cells (16) and relatively more b and g cells (15, 23). If there are fewer a-intercalated cells, then the magnitude of net HCO absorption resulting from acid incubation would be smaller than in mid-CCDs un-less there is recruitment of other intercalated cell types. Also, removal of Cl2 from the bath would not likely have as large an
effect as in mid-CCDs because there is little HCO absorption to inhibit.
Cl2-free bath. Removal of basolateral Cl2 inhibits the
ac-tivity of the Cl2-base exchanger and thereby inhibits luminal
H1 secretion by a-intercalated cells (5, 10, 11, 28). This
maneu-ver was performed in six outer CCDs to evaluate the magni-tude of H1 secretion before and then after acid incubation.
Be-fore incubation, CCDs (Fig. 9) secreted net HCO at a rate similar to that of mid-CCDs, and Cl2 removal increased this
rate of HCO secretion from 23.9460.22 to 24.2160.19 pmol/min per mm, P, 0.05, n = 6). The mean DJHCO3 was 20.2860.11 pmol/min per mm (P, 0.01 vs 0) and was only 11% of that observed in four mid-CCDs studied similarly (P, 0.01; see Fig. 2 and above).
3
2
3
2
3
2
3
2
3
2
3
2
3
2
3
2
3
2
After acid incubation (see Fig. 9), a small but significant net HCO absorptive flux was observed, and this was com-pletely inhibited by removing basolateral Cl2 (from 0.5160.07
to 20.5060.15 pmol/min per mm, with mean DJHCO3 = 20.9460.15 pmol/min per mm, P, 0.01 vs 0). The absorptive HCO flux after acid incubation was only 11% as large, and the DJHCO3 after Cl2 removal was only 20% of that observed in four mid-CCDs studied similarly (P, 0.01 for both unpaired comparisons). As observed above, the removal of Cl2 was
completely reversible (recovery, 20.5460.10 pmol/min per mm, see Fig. 9).
In keeping with the resulting net absorptive flux and as seen for mid-CCDs, the Vte fell significantly after acid incuba-tion (preincubaincuba-tion, 24.460.2; postincubation, 24.160.2 mV; P, 0.01). This decrement of 0.3 mV was smaller than the 0.7 mV observed in the four mid-CCDs (P, 0.05).
Discussion
The kidney adapts to metabolic acidosis in part by increasing urinary acid excretion. Much of this adaptation occurs at the level of the collecting duct. The CCD is unique in that it is ca-pable of changing the vectorial direction of HCO flux in vitro in response to acid–base perturbations in vivo (2–5). To char-acterize the adaptation of the CCD better, we have developed a model of metabolic acidosis in vitro (17). Normally, CCDs taken from control rabbits secrete net HCO , but, after 3 h of exposure to low pH in vitro, the polarity of HCO flux re-verses to that of net HCO absorption (equivalent to net H1
secretion) (17). Subsequent studies enabled us to show that in-hibitors of protein or RNA synthesis or of cytoskeletal func-tion impair the ability of the CCD to adapt to acidosis (22).
Our in vitro model has been validated by the findings of de-creases in apical peanut agglutinin labeling and apical Cl2–
HCO exchange and reversal of polarity of net HCO flux that are comparable to those observed in CCDs taken from acid-fed rabbits in vivo (2, 5, 17, 22). In the present study, 29 of 29 CCDs exposed to 1 h at pH 6.8 followed by 2 h at pH 7.4 showed a reversal of polarity of net HCO flux from secretion to absorption (see Fig. 1 A).
Our recent studies have emphasized that HCO secretion, presumably by b-intercalated cells, is decreased by adapting CCDs (17, 22). The reduction in HCO secretion is
accom-3
2
3
2
3
2
3
2
3
2
3
2
3
2
3
2
3
2
3
2
3
[image:7.612.315.557.57.215.2]2
Figure 8. Effect in five CCDs of luminal Cl2 removal on J
HCO3
[image:7.612.57.299.515.709.2]be-fore (Pre) and after (Post) acid incubation.
Figure 9. Effect of Cl2-free bath on J
plished in part by endocytotic removal of apical Cl2–HCO
exchangers (17). These studies confirm two previous ones in which acid loading in vivo caused primarily a decrease in HCO secretion, although a small increase in HCO absorp-tion was also observed (18, 37).
Our previous data did not allow us to directly demonstrate adaptive changes in a-intercalated cell function (manifested by increased H1 secretion or HCO absorption); however, CCDs
from in vivo acid-treated animals have generally absorbed net HCO (2, 3, 5). On the other hand, in the OMCD of the outer stripe, which is comprised of only a-type (not b) intercalated cells, acidosis has not consistently stimulated H1 secretion (28,
38, 39). Morphologically, in chronically acidotic animals, changes in H1-secreting cells have regularly been
demon-strated: the cells become larger, with increased apical mem-brane surface area, decreased cytoplasmic tubulovesicles, in-creased basolateral membrane area, and redistribution to the apical and basolateral plasma membranes of H1-ATPase and
band 3, respectively (40–42). Based on the morphologic and morphometric changes, it would be likely that these cells would secrete protons at higher rates.
The salient findings of the present study indicate that the a-intercalated cell does indeed modify its function in response to in vitro metabolic acidosis. Thus, we believe that this is the first functional demonstration that adaptation to acidosis in vitro is comprised of changes occurring in both H1-secreting
and HCO -secreting cells of the CCD. Not only do b -interca-lated cells decrease HCO secretion, but a-intercalated cells also increase H1 secretion. This result can be examined in
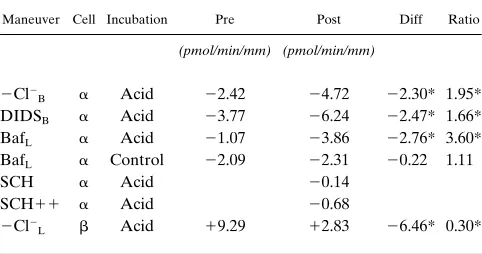
depth in Table II. Note that the tests of a cell function (Cl2
-free bath, basolateral DIDS, and luminal bafilomycin) elicit a much larger effect (increased by 2–3 pmol/min per mm) after acid incubation compared with before incubation. These re-sults indicate that a cell function has been stimulated by the acid incubation in parallel with the reversal in polarity of net HCO flux. On the other hand, the test of b cell function (Cl2
-free perfusate) shows a much smaller effect (decreased by 6.5 pmol/min per mm) after acid incubation, indicating that b -inter-calated cells have downregulated HCO secretion, as shown previously (17, 22, 37). And in outer CCDs, where few a cells are present, the effect of inhibiting a cell function after acid in-cubation was much smaller than in mid-CCDs (0.7 vs 2.3 pmol/min per mm) (see Table II).
The adaptive increase in H1 secretion is accomplished
pre-dominately via the vacuolar H1-ATPase rather than the
P-type H1,K1-ATPase, because . 80% of resulting net H1
se-cretion was inhibited by nanomolar concentrations of bafilo-mycin, a specific H1-ATPase inhibitor (30, 32, 43). Also, in
two protocols using SCH28080, there was , 15% inhibition of HCO absorption in the acid incubated CCD (see Figs. 6 and 7 and Table II). SCH28080 alone inhibited HCO absorption by only 5%; we reasoned that secreted K1 could have been
competing with the inhibitor for the apical H1,K1-ATPase. In
the second protocol, SCH28080 combined with basolateral ouabain to inhibit K1 secretion by principal cells (44) plus
elimination of luminal K1 should have served to inhibit all
api-cally oriented H1,K1-ATPase activity (31, 34); however, the
inhibition averaged only 11%. Contrary to what has been ob-served in the OMCD taken from K1 replete rabbits in which
H1,K1-ATPase plays a major role in luminal acidification (31,
34), the adapted CCD appeared to depend more on luminal H1-ATPase activity; the bulk of net HCO absorption was
in-3
2
3
2
3
2
3
2
3
2
3
2
3
2
3
2
3
2
3
2
3
2
3
2
hibited by 5 nM bafilomycin, and relatively little (5–15%) was inhibited by SCH28080 (see Table II). In agreement with these findings, SCH28080 has been previously shown not to inhibit net HCO absorption in isolated perfused rat cortical collect-ing ducts (45).
Our results differ from Zhou and Wingo’s studies (33) showing that an increase in HCO absorption after exposure to 10% CO2 was totally inhibited by luminal 10-mM SCH28080, suggesting that the enhancement of HCO flux was mediated by an H1,K1-ATPase (33). To account for the
differences between Zhou and Wingo’s experiments and the present study, one must consider that the mechanism of acido-sis was different, their CCDs were from deeper in the cortex, and the diet of the rabbits was different (ours were fed more than adequate amounts of K1 [10–20 mEq/kg per d] and theirs
were K1 replete).
One might question whether luminal bafilomycin also per-meates the cell to inhibit HCO secretion by b-intercalated cells. That appears not to be the case from the preincubation data and the control incubation studies, both of which showed that luminal bafilomycin actually stimulated HCO secretion (see Figs. 4 and 5 and Table II)2. Also, there are experimental data from single-cell electrical measurements that show that N-ethylmaleimide, an inhibitor of H1-ATPase, depolarized
the basolateral membrane potential of b-intercalated cells when applied from the basolateral but not from the luminal
3
2
3
2
3
2
3
2
3
[image:8.612.315.556.83.210.2]2
Table II. Effect of Maneuvers on DJHCO3 before and after Incubation
Maneuver Cell Incubation Pre Post Diff Ratio
(pmol/min/mm) (pmol/min/mm)
2Cl2
B a Acid 22.42 24.72 22.30* 1.95* DIDSB a Acid 23.77 26.24 22.47* 1.66* BafL a Acid 21.07 23.86 22.76* 3.60* BafL a Control 22.09 22.31 20.22 1.11
SCH a Acid 20.14
SCH11 a Acid 20.68
2Cl2
L b Acid 19.29 12.83 26.46* 0.30*
Values are means.
*Significantly different from 0 (Diff) or 1 (Ratio) (P, 0.05). Positive pre and post values denote increased HCO absorption or decreased HCO secretion and negative numbers denote decreased HCO ab-sorption or increased HCO secretion. Each maneuver was performed before (Pre) and after (Post) a 3 h incubation and was generally revers-ible; the SCH11 protocol also involved the use of ouabain, which, in combination with SCH28080, was not completely reversible and there-fore was not used bethere-fore incubation. Acid incubation was 1 h at pH 6.8 plus 2 h at pH 7.4; control incubation was 3 h at pH 7.4. Baf, bafilomy-cin; SCH, SCH28080; SCH11, SCH plus O K1 in lumen plus 0.1 mM bath ouabain; Diff, difference of post DJHCO3 minus pre DJHCO3; Ratio,
ratio of post DJHCO3 divided by pre DJHCO3. 3
2
3
2
3
2
3
2
2. In one CCD absorbing net HCO (after acid incubation), the addi-tion of 5 nM bafilomycin to the bath did not inhibit acid secreaddi-tion; if anything, there was a slight stimulation, perhaps because residual HCO secretion was inhibited: (postincubation, 3.51; bath bafilomy-cin, 3.98; recovery, 3.52 pmol/min per mm). The result of this experi-ment suggests that basolateral bafilomycin does not influence the lu-minal H1-ATPase of HCO -absorbing CCDs.
3
2
3
2
3
side (29). This would suggest the presence of a predominant H1-ATPase on the basolateral membranes of b-intercalated
cells, but the inhibitor does not appear to permeate the cell and inhibit the H1-ATPase from the opposite membrane.
Whether or not this adaptation to low pH in vitro repre-sents recruitment of preformed H1 pumps from the apical
cy-toplasm via exocytosis (6, 21, 46) or de novo synthesis of one or more subunits of the proton pump cannot yet be deter-mined. In previous studies of chronically acidotic rats, there was no increase in synthesis of H1 pumps but rather a
redistri-bution of preformed pumps from cytoplasm to apical mem-brane (42). A similar conclusion might be drawn from rabbits based on a recent immunolocalization study (41) that showed apical polarization of H1-ATPase and basolateral polarization
of band 3 after 12 d of acid feeding compared with more cyto-plasmic vesicular staining of both H1-ATPase and band 3 in
control rabbits. Also, in response to acute cellular acidosis, there is fusion of cytoplasmic vesicles containing H1 pumps
with the apical membrane so as to increase net H1 secretion in
the CCD (46). Most of these studies would indicate that adap-tation of a-intercalated cell would be rapid and rather inde-pendent of the cell’s synthetic machinery. Indeed, early studies in isolated perfused CCDs initially showed a change in vecto-rial HCO transport z 20 h after an acid load (2), whereas others involved several days of acid loading in vivo (3, 5, 37). The present studies show an adaptation of both a- and b -inter-calated cells after 3 h of incubation. Recently, we (22) have shown that the adaptation cannot be demonstrated after 2 h of acid incubation in vitro, and this has been confirmed again in two pilot experiments (see Results). Respiratory acidosis in vitro for 30 min stimulated HCO absorption by 252% in the CCD (47). Acidosis in vivo for 6 h or less in rabbits, however, did not cause obvious changes in CCD HCO transport (39). Alkalosis in vitro for 1 h had no effect on net HCO transport in isolated perfused rat CCDs (48).
A variety of studies have indicated that not all intercalated cells can be classified as a or b: some show characteristics of both cell types (9, 10, 15). Of greatest relevance to the present study is the finding of a subtype of intercalated cells with both apical and basolateral Cl2–HCO exchangers; these cells were
called g cells and comprise . 50% of intercalated cells of the outer CCD (15). A more recent cell pH study, however, indi-cated that all CCD intercalated cells possessed basolateral Cl2–HCO exchange activity (when the apical anion
ex-changer was concurrently inhibited) (16). b-intercalated cells had both apical and basolateral Cl2-base exchangers, and both
of these were insensitive to DIDS, whereas a-intercalated cells showed basolateral Cl2-base exchange that was sensitive to
DIDS (16). These investigators did not demonstrate the pres-ence of g cells. It is possible that not all b-intercalated cells se-crete HCO and that this function might depend on the rela-tive magnitudes of apical and basolateral anion exchange activities. Perhaps endocytotic retrieval of apical Cl2–HCO
exchangers, as previously demonstrated by our laboratory, re-sults in sufficient diminishment of apical anion exchangers to substantially reduce HCO secretion by these adapted cells. Thus, the b or g cell may be capable of regulating its transcel-lular HCO transport rate by controlling the activity of its api-cal Cl2–HCO exchanger.
Whether or not g cells can change into a-intercalated cells still remains an open question. Acid incubation of outer CCDs resulted in smaller, rather than larger, rates of HCO
absorp-3
2
3
2
3
2
3
2
3
2
3
2
3
2
3
2
3
2
3
2
3
2
3
2
tion compared with mid-CCDs, suggesting relatively little re-cruitment of g cells under these conditions. Previous studies from our laboratory demonstrated that peanut agglutinin– labeled intercalated cells (presumably b-intercalated cells) be-came endocytotically active in response to in vivo metabolic acidosis: The lectin caps disappeared and net HCO transport converted from secretion to absorption (5). The evidence sug-gested a reversal of polarity of intercalated cells from b to a, but we were not able to demonstrate cells clearly in the midst of interconversion. Indeed, we later showed that endocytosis might not be a property of all intercalated cells (10); that is, not all H1-secreting cells regulate transport by endocytosis/
exocy-tosis of H1 pumps.
On the other hand, recent studies (49) in a clonal cell line of b-intercalated cells indicate that the density of plating influ-ences the phenotype of such cells: At low density the cells have the b-intercalated cell phenotype and secrete HCO , but when plated at high density they assume an a-intercalated cell phenotype, showing basolateral band 3 and secreting protons. A specific extracellular matrix protein of 230 kD produced by the cells plated at high density was able to induce a similar re-versal of epithelial polarity (49). Our data in the mid-CCD are certainly consistent with either an upregulation of H1
secre-tion in existing a-intercalated cells plus a downregulation of HCO secretion in b-intercalated cells or with a recruitment of a cells from the pool of b/g cells, with a reversal of polarity of these cells resulting in an increase in H1 secretion and a
de-crease in HCO secretion. Studies to actually “catch” these in-tercalated cells in the process of interconversion should be able to resolve this important issue of renal acid–base physi-ology.
Acknowledgments
We are grateful for the technical assistance of Ms. J. Jenkins and Ms. A. Kittelberger. We appreciate the kind gift of SCH28080 from Dr. T. Sybertz of Schering-Plough Research Institute.
Dr. Tsuruoka was supported by a postdoctoral fellowship award from the American Heart Association, New York State Affiliate. Dr. Schwartz was supported by National Institutes of Health grant DK50603.
References
1. Alpern, R.J., D.K. Stone, and F.C. Rector, Jr. 1991. Renal acidification mechanisms. In The Kidney. B.M. Brenner and F.C. Rector, Jr., editors. WB Saunders, Philadelphia. 318–379.
2. McKinney, T.D., and M.B. Burg. 1977. Bicarbonate transport by rabbit cortical collecting tubules. J. Clin. Invest. 60:766–768.
3. Lombard, W.E., J.P. Kokko, and H.R. Jacobson. 1983. Bicarbonate transport in cortical and outer medullary collecting tubules. Am. J. Physiol. 244: F289–F296.
4. Atkins, J.L., and M.B. Burg. 1985. Bicarbonate transport by isolated per-fused rat collecting ducts. Am. J. Physiol. 249:F485–F489.
5. Schwartz, G.J., J. Barasch, and Q. Al-Awqati. 1985. Plasticity of func-tional epithelial polarity. Nature (Lond.). 318:368–371.
6. Madsen, K.M., and C.C. Tisher. 1986. Structural-functional relationships along the distal nephron. Am. J. Physiol. 250:F1–F15.
7. Schuster, V.L., S.M. Bonsib, and M.L. Jennings. 1986. Two types of col-lecting duct mitochondria-rich (intercalated) cells: lectin and band 3 cytochem-istry. Am. J. Physiol. 251:C347–C355.
8. Brown, D., S. Hirsch, and S. Gluck. 1988. An H1-ATPase in opposite plasma membrane domains in kidney epithelial cell subpopulations. Nature (Lond.). 331:622–624.
9. Schuster, V.L., G. Fejes-Toth, A. Naray-Fejes-Toth, and S. Gluck. 1991. Colocalization of H1 ATPase and band 3 anion exchanger in rabbit collecting duct intercalated cells. Am. J. Physiol. 260:F506–F517.
10. Schwartz, G.J., L.M. Satlin, and J.E. Bergmann. 1988. Fluorescent char-3
2
3
2
3
2
3
acterization of collectng duct cells: a second H1-secreting type. Am. J. Physiol. 255:F1003–F1014.
11. Weiner, I.D., and L.L. Hamm. 1990. Regulation of intracellular pH in the rabbit cortical collecting tubule. J. Clin. Invest. 85:274–281.
12. Alper, S.L., J. Natale, S. Gluck, H.F. Lodish, and D. Brown. 1989. Sub-types of intercalated cells in rat kidney collecting duct defined by antibodies against erythroid band 3 and renal vacuolar H1-ATPase. Proc. Natl. Acad. Sci.
USA. 86:5429–5433.
13. Satlin, L.M., T. Matsumoto, and G.J. Schwartz. 1992. Postnatal matura-tion of rabbit renal collecting duct. III. Peanut lectin-binding intercalated cells.
Am. J. Physiol. 262:F199–F208.
14. Verlander, J.W., K.M. Madsen, D.K. Stone, and C.C. Tisher. 1994. Ul-trastructural localization of H1 ATPase in rabbit cortical collecting duct. J. Am.
Soc. Nephrol. 4:1546–1557.
15. Emmons, C., and I. Kurtz. 1994. Functional characterization of three in-tercalated cell subtypes in the rabbit outer cortical collecting duct. J. Clin. In-vest. 93:417–423.
16. Weiner, I.D., A.E. Weill, and A.R. New. 1994. Distribution of Cl2/ HCO exchange and intercalated cells in rabbit cortical collecting duct. Am. J. Physiol. 267:F952–F964.
17. Satlin, L.M., and G.J. Schwartz. 1989. Cellular remodeling of HCO -secreting cells in rabbit renal collecting duct in response to an acidic environ-ment. J. Cell Biol. 109:1279–1288.
18. Garcia-Austt, J., D.W. Good, M.B. Burg, and M.A. Knepper. 1985. Deoxycorticosterone-stimulated bicarbonate secretion in rabbit cortical collect-ing ducts: effects of luminal chloride removal and n vivo acid loadcollect-ing. Am. J. Physiol. 249:F205–F212.
19. Weiner, I.D., and L.L. Hamm. 1989. Use of fluorescent dye BCECF to measure intracellular pH in cortical collectng tubule. Am. J. Physiol. 256:F957– F964.
20. Brown, D., P. Weyer, and L. Orci. 1987. Nonclathrin-coated vesicles are involved in endocytosis in kidney collecting duct intercalated cells. Anat. Rec.
218:237–242.
21. Brown, D. 1989. Membrane recycling and epithelial cell function. Am. J. Physiol. 256:F1–F12.
22. Yasoshima, K., L.M. Satlin, and G.J. Schwartz. 1992. Adaptation of rab-bit cortical collecting duct to in vitro acid incubation. Am. J. Physiol. 263:F749– F756.
23. Emmons, C.L., K. Matsuzaki, J.B. Stokes, and V.L. Schuster. 1991. Ax-ial heterogeneity of rabbit cortical collecting duct. Am. J. Physiol. 260:F498– F505.
24. Burg, M., and N. Green. 1977. Bicarbonate transport by isolated per-fused rabbit proximal tubules. Am. J. Physiol. 233:F307–F314.
25. Star, R.A., M.B. Burg, and M.A. Knepper. 1985. Bicarbonate secretion and chloride absorption by rabbit cortical collecting ducts. Role of chloride/ bi-carbonate exchange. J. Clin. Invest. 76:1123–1130.
26. Schwartz, G.J., A.M. Weinstein, R.E. Steele, J.L. Stephenson, and M.B. Burg. 1981. Carbon dioxide permeability of rabbit proximal convoluted tu-bules. Am. J. Physiol. 240:F231–F244.
27. Schuster, V.L. 1985. Cyclic adenosine monophosphate-stimulated bicar-bonate secretion in rabbit cortical collecting tubules. J. Clin. Invest. 75:2056– 2064.
28. Kuwahara, M., S. Sasaki, and F. Marumo. 1992. Mineralocorticoids and acidosis regulate H1/HCO transport of intercalated cells. J. Clin. Invest. 89: 1388–1394.
29. Furuya, H., M.D. Breyer, and H.R. Jacobson. 1991. Functional charac-terization of a- and b-intercalated cell types in rabbit cortical collecting duct.
Am. J. Physiol. 261:F377–F385.
30. Drose, S., K.U. Bindseil, E.J. Bowman, A. Siebers, A. Zeeck, and K. Al-3
2
3
2
3
2
tendorf. 1993. Inhibitory effect of modified bafilomycins and concanamycins on P- and V-type adenosinetriphosphatases. Biochemistry. 32:3902–3906.
31. Armitage, F.E., and C.S. Wingo. 1994. Luminal acidification in K-replete OMCDi: contributions of H-K-ATPase and bafilomycin-A1-sensitive H-ATPase.
Am. J. Physiol. 267:F450–F458.
32. Yoshimori, T., A. Yamamoto, Y. Moriyama, M. Futai, and Y. Tashiro. 1991. Bafilomycin A1, a specific inhibitor of vacuolar-type H1-ATPase, inhibits acidification and protein degradation in lysosomes of cultured cells. J. Biol. Chem. 266:17707–17712.
33. Zhou, X., and C.S. Wingo. 1994. Stimulation of total CO2 flux by 10% CO2 in rabbit CCD: role of an apical Sch-28080- and Ba-sensitive mechanism.
Am. J. Physiol. 267:F114–F120.
34. Armitage, F.E., and C.S. Wingo. 1995. Luminal acidification in K-replete OMCDi: inhibition of bicarbonate absorption by K removal and luminal Ba.
Am. J. Physiol. 269:F116–F124.
35. Fejes-Toth, G., A. Naray-Fejes-Toth, L.M. Satlin, F.M. Mehrgut, and G.J. Schwartz. 1994. Inhibition of bicarbonate transport in peanut lectin-posi-tive intercalated cells by a monoclonal antibody. Am. J. Physiol. 266:F901– F910.
36. Weiner, I.D., and L.L. Hamm. 1991. Regulation of Cl2/HCO exchange in the rabbit cortical collecting tubule. J. Clin. Invest. 87:1553–1558.
37. Hamm, L.L., K.S. Hering-Smith, and V.M. Vehaskari. 1989. Control of bicarbonate transport in collecting tubules from normal and remnant kidneys.
Am. J. Physiol. 256:F680–F687.
38. McKinney, T.D., and K.K. Davidson. 1987. Bicarbonate transport in collecting tubules from outer stripe of outer medulla of rabbit kidneys. Am. J. Physiol. 253:F816–F822.
39. Laski, M.E., and N.A. Kurtzman. 1990. Collecting tubule adaptation to respiratory acidosis induced in vivo. Am. J. Physiol. 258:F15–F20.
40. Madsen, K.M., J.W. Verlander, J. Kim, and C.C. Tisher. 1991. Morpho-logical adaptation of the collecting duct to acid-base disturbances. Kidney Int.
40(Suppl. 33):57–63.
41. Verlander, J.W., K.M. Madsen, J.K. Cannon, and C.C. Tisher. 1994. Ac-tivation of acid-secreting intercalated cells in rabbit collecting duct with ammo-nium chloride loading. Am. J. Physiol. 266:F633–F645.
42. Bastani, B., H. Purcell, P. Hemken, D. Trigg, and S. Gluck. 1991. Ex-pression and distribution of renal vacuolar proton-translocating adenosine triphosphatase in response to chronic acid and alkali loads in the rat. J. Clin. In-vest. 88:126–136.
43. Bowman, E.J., A. Siebers, and K. Atlendorf. 1988. Bafilomycins: a class of inhibitors of membrane ATPases from microorganisms, animal cells, and plant cells. Proc. Natl. Acad. Sci. USA. 85:7972–7976.
44. Grantham, J.J., M.B. Burg, and J. Orloff. 1970. The nature of transtubu-lar Na and K transport in isolated rabbit renal collecting tubules. J. Clin. Invest.
49:1815–1826.
45. Gifford, J.D., L. Rome, and J. H. Galla. 1992. H1-K1-ATPase activity in rat collecting duct segments. Am. J. Physiol. 262:F692–F695.
46. Schwartz, G.J., and Q. Al-Awqati. 1985. Carbon dioxide causes exocyto-sis of vesicles containing H1 pumps in isolated perfused proximal and collecting tubules. J. Clin. Invest. 75:1638–1644.
47. McKinney, T.D., and K.K. Davidson. 1988. Effects of respiratory acido-sis on HCO transport by rabbit collecting tubules. Am. J. Physiol. 255:F656– F665.
48. Gifford, J.D., M.W. Ware, R.G. Luke, and J.H. Galla. 1993. HCO transport in rat CCD: rapid adaptation by in vivo but not in vitro alkalosis. Am. J. Physiol. 264:F435–F440.
49. van Adelsberg, J., J.C. Edwards, J. Takito, B. Kiss, and Q. Al-Awqati. 1994. An induced extracellular matrix protein reverses the polarity of band 3 in intercalated eithelial cells. Cell. 76:1053–1061.
3
2
3
2
3