REVIEW PAPER ON THE VARIOUS METHODOLOGICAL
DIFFERENCES AMONG CLUSTER ANALYSIS TECHNIQUES
K. K. Saxena & Ajay Kumar
Professor of Statistics, University of Dodoma, Dodoma, Tanzania
ABSTRACT
Cluster analysis is a technique of assigning a set of objects into groups called clusters
so that the objects in the same cluster are more similar in some or another sense. Clustering
is one of best approaches of data reduction and a common methodology for statistical data
analysis. It is used in all major domains like pattern recognition, image analysis, banking,
marketing, health care, robotics, agriculture, bioinformatics and other disciplines. The raw
data of cluster analysis is obtained by the experimenter in the form of the familiar (n×p)
matrix of multivariate observations in which p variable values are given for each of n
individuals. Such data are often also analyzed by means of other multivariate techniques such
as principal components, factor analysis, discriminant function analysis, multivariate analysis
of variance, and increasingly by informal graphical methods. Clustering can be viewed by
different algorithms that differ independently, in their view what is meant by a cluster and
how to find them perfectly. Popular notions of clusters include groups with minimum
distances among the cluster members. The clustering problem has been discussed by many
researchers with respective domains. It reveals broad scope of clustering and it is very
important in the process of data analysis as one step. However, it is very difficult because of
the researchers may assume in different contexts. In this paper we have made an attempt to
review all the historic papers upon which the cluster methods are based.
Keywords: cluster analysis, factor analysis, principal component analysis.
1. Introduction
Clustering is often confused with classification, but there is a basic difference
between the two.In classification, the objects are assigned to pre-defined classes, where as in
Inte rnational Research Journal of Natural and Applied Sciences
ISSN: (2349-4077) Impact Factor- 5.46, Volume 4, Issue 7, July 2017 We bsite- www.aarf.asia, Email : editor@aa rf.asia , ed itoraarf@g mail.co m
clustering the classes are formed. In any scientific investigation a comprehensive review of
relevant literature is imperative. Besides giving a knowledge of the work already done in the
study area, it provides an insight into the methods and procedures. There has been a large
number of studies where various methods of clustering have been used, but very few
literature is available in which all the historic papers have been reviewed at one place. Hence
in this paper an attempt has been made to cover all the available literature on the basics of
clustering procedures in respect of measures of similarity, clustering techniques- hierarchical
techniques and their comparison, clustering by optimizing pre defined measure , choosing a
"Best" clustering technique and choosing the number of clusters.
1.1 Cluster analysis and factor Analysis
A distinction which is often made between these two sets of techniques is that cluster
analysis is concerned with the classification of individuals, whilst factor analysis techniques
assess relationships between variables and could be considered to be concerned with the
classification of these variables. Such a distinction is however rather artificial since there is
essentially, no reason why many clustering techniques could not be used to cluster variable
into groups, and it is also possible to use Q-mode factor analysis to directly classify
individual (Cattell, 1952).
A more fundamental difference arises from consideration of the well formulated
linear model of factor analysis. This has no equivalent in most methods of cluster analysis.
Such a clearly defined model has advantages in leading to testable hypotheses concerning
certain aspects of the structure of the data. It has disad vantages in respect to the linearity
constraint, which the majority of users conveniently ignore. Such a model also has little
meaning when applied to individuals rather than variables and consequently Q -mode factor
analysis has been subjected to much criticism (Fleiss and Zubin,1969 and Fleiss et al.,1971).
The method has also been criticized by Blashfield (1976) on more pragmatic grounds, namely
that it performs very poorly in practice.
1.2 Cluster analysis and discriminant analysis
Discriminant function analysis requires an existing two (or more) group classification
as starting point. However, it may often be usefully employed in association with cluster
analysis as an informal indicator of which variables have contributed most to cluster
formation (the usual significance tests are not however valid), and as a means by which
clusters and the relationships between them may be examined visually. Such canonical
variate plots are used in the NORMAP program written by Wolfe (1970), and an example of
1.3 Cluster analysis and multivariate analysis of variance
A method of cluster analysis originally proposed by Friedman and Rubin (1967) uses
Wilk's lambda statistic originally proposed in the context of multivariate analysis of variance,
as its clustering criterion. Its connection with analysis of variance is mentioned here so that
the problem of between clusters 'significance tests' can be discussed. Wilk‟s lambda, | T | / | W
|,arises from consideration of the fundamental equation
T = W + B
where T, W and B are (p × p) matrices containing, respectively, 'total', 'within' and 'between'
sums of squares and products. The distribution of lambda is known under the null hypothesis
that the g groups are samples from the same population, and this distribution is used in the
analysis of variance context to assess the significance of differences between group mean
vectors. Such significance tests are not, however, valid in cluster analysis applications since
here we construct groups which maximize | T | / | W |, and it is, consequently, the distribution
of max {| T | / | W |} under the null hypothesis, that we would need to study to answer
questions of the statistical significance of the groups found by this form of clustering. Similar
remarks hold for other clustering criterion, and for the significance tests sometimes carried
out on individual variables after clustering using the usual t or F-tests. Paykel and Rassaby
(1978) gave a number of F-tests which are judged for significance using the usual tables of
the F-distribution; such tests, if performed at all, should however be assessed against the
critical values given in Englemann and Hartigan (1969).
Again in the multivariate analysis of variance context, cluster analysis has been
proposed as an alternative to multiple comparison procedures for grouping means; see Scott
and Knott (1974).
2. Measures of similarity
The basic data consist of a vector of observations x‟i = (xil, ..., xip) on each entity Ei in a set , or of a similarity structure S on or on x (Kendall, 1966). In many fields of study
these entities are essentially unique individuals. In some, notably in the taxonomy of living
organisms, it is assumed that the entities are well-defined populations from which individuals
may be sampled. The observations on these individuals have a probability distribution,
usually summarized by the mean and covariance matrix. Thus in the classification of such
population entities, data on within-entity variation are available in addition to the entity mean
ranked (but not unordered qualitative) variables, it is natural to visualize the set , as n points
in [p]-space, which, as humans, we should like to be geometric or Euclidean, although this is
not a necessary condition (Cormack, 1971). Hartigan (1967) lists twelve similarity
structures:
S1 S defined on x is Euclidean distance;
S2 S defined on x is a metric;
S3 S defined on x is symmetric real-valued;
S4 S defined on x is real- valued;
S5 S is a complete order < on x ;
S6 S is a partial order < on x (each comparable pair of entities can be ordered, but
not all pairs of entities need be comparable);
S7 S is a tree on {a partial similarity order, (I,j)< (k,l) whenever sup (i,j)> sup (k,
l)}
S8 S is a complete relative similarity order <i on for each Ei in : j<ik means that Ej is
no more similar to Eithan Ek is;
S9 S is a partial relative similarity order <i on ;
S10 S is a similarity dichotomy on x in which x is divided into a set of similar
pairs and a set of dissimilar pairs;
S11 S is a similarity trichotomy on x (similar pairs, dissimilar pairs, and the rest);
S12 S is a partition of intosets of similar objects.
Most empirical studies have started with one of the structures S1 to S3, and virtually
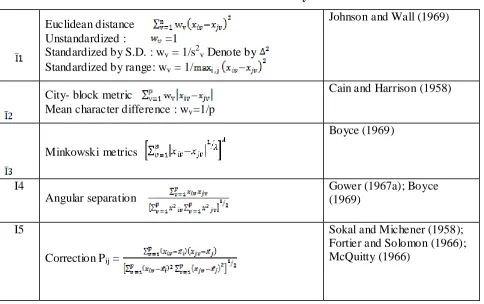
each author has its own details of proceeding from X to S. Some proposals are listed in Table
2.1, indices that are measures of dissimilarity, decreasing with increasing similarity, being
denoted by Ī. The final three indices are used essentially for binary data and are therefore
inapplicable to the classification of population entities. The complement of 18 has been
proposed for use with quantitative data the "Canberra" metric Ī8, when all variables are quantitative, S1 can be obtained directly, Ī1.
Sokal (1961) pointed out that Σ(xiv– xjv)2 is not Euclidean distance in this case. If the entities to be classified are populations from which several individuals can be sampled,
information is available on the scales of, and the correlation between, the variables within
these populations. Thus Mahalanobis's D2, as advocated by Bolshev (1969) and, in a form modified for discrete data, by Balakrishnan and Sanghvi (1968) and by Kurczynski (1970),
can be used to determine the appropriate axes with reference to which distances between
entities should be evaluated.
The matrix of covariances between variables calculated from n unique entities has been
used to transform the axes of measurement. Minkoff (1965) found that this yielded results less
in agreement with expectations than the correct use of D2. There are two major objections to basing a distance measure on such an overall covariance matrix. Firstly, most of the correlation
present is likely to be caused by the existence of the clusters being sought. This must be
retained (Gower, 1969). Secondly, the correlation structure within clusters may vary
considerably from cluster to cluster, so that a pooled covariance matrix is inappropriate. The
first point does not wholly imply that “in general, the contribution of any one
property-resemblance to overall similarity should not be influenced with respect to other
features” (Hall, 1969), unless care has been taken to ensure that all variables measured are in
fact uncorrelated within the clusters.
If replicates do not exist, there appears to be a circularity in trying to transform data
by properties of the cluster that it is hoped to determine. Rohlf (l970), however, has proposed
a sequential scheme for cluster formation in which distances from an already clustered
individual are measured in the local geometry of that cluster. Such a distance is not
symmetric-type S4. This procedure eliminates both scaling and correlation problems, by
being invariant under any linear transformation of the original variables. A different way
round these problems is found in Gower's (1966) proposal to replace the standardized
observed variables by principal components before calculating Euclidean distances.
Euclidean distance also has the property, disliked by some users, of giving extra
weight to outlying values of a single variate. This is partly overcome by scaling. However,
some sets of variables (e.g. measurements of different plant species in an area) seem unsuited
to scaling, and it is possible (Bannister, 1968) for two areas containing identical botanical
species in differing amounts to be further apart than two areas with no species in common.
Some objections to Euclidean distance reduce to the complaint that it does not behave in the
desired way: “taxonomic distance has distortions that make it clearly not suitable” (Hall,
1969), although distortion is not defined.
Similarity indices with properties akin to correlation coefficients are often sought.
Cattell(1949) has advocated a series of such indices of which I6, I7 are examples. The
correlation coefficient I5 is not often used. Some arguments against it are circular, amounting
to saying that it can give Pij<Pik when entities Ei, Ej are obviously more similar than Ei, Ek.
variables are encoded, comparable measurements or counts; it is not invariant under scaling
of variables, or even under alterations in the direction of coding of some variables (Minkoff,
1965).
If the variables are all binary characters, all coefficients of association from the 2 x 2
table of numbers of characters possessed or not possessed by entities Ei, Ej
are candidates for an index of similarity. The proper ties of these S3 measures are discussed
thoroughly by Sokal and Sneath (1963). The choice among I8, I9, I10 is dependent on
whether co-absence of a particular character is assumed to contain information. Rayner
(1966) distinguished between dichotomies (d unimportant) and alternatives. Intermediate
weightings of a, d can be used. Such a scheme was used by Hayhoe et al. (1964) in order to
incorporate in the similarity index the differing frequencies of occurrence of different
attributes, co-presence of a rare attribute scoring much higher than its co-absence or than the
co-presence of a common attribute. This approach has been condemned by some on the basis
that it is unjustified scaling. The simple matching coefficient 110 was supported by Williams
and Dale (1965) as being the one-complement of a Euclidean distance, while 18 and 19 are
not, although their one-complements do satisfy the triangle inequality (Ihm, 1965). Versions
[image:6.596.68.552.435.739.2]of I8, I9, I10 have been used with quantitative variables,Ī8 most extensively.
Table 2.1: Indices of Similarity
Euclidean distance Unstandardized : =1
Standardized by S.D. : wv = 1/s2v Denote by Standardized by range: wv = 1/
Johnson and Wall (1969)
City- block metric
Mean character difference : wv=1/p
Cain and Harrison (1958)
Minkowski metrics
Boyce (1969)
I4
Angular separation
Gower (1967a); Boyce (1969)
I5
Correction Pij =
I6
Profile similarity index where
Cattell (1949)
I7 Coefficient of nearness :
Cattell and Coulter (1966)
I8
“Canberra” metric :
Bray and Curtis (1957); Lance and Williams (1966)
Czekanowski (1913): Dice (1945)
I9
Jaccad (1901); termed “connection” by Needham (1963)
I10
Simple matching
Sokal and Michener (1958)
3. Clustering techniques
There are many intuitive ideas, often conflicting, of what constitutes a cluster, but two
basic ideas are involved: internal cohesion and external isolation. Sometimes isolation is
stressed: Rogers et al. (1967) found the maximal acceptable restriction to be that similar
entities shall not be placed in different classes and that a discontinuity should be observable
between classes. Sometimes cohesion is stressed: an individual should be accepted into a
cluster if its smallest correlation with any member is greater than some threshold (Cattell,
1944). More usually, both are included: the distance between any two points in the set is less
than the distance between any point in the set and any not in it (Gengerelli, 1963); the sum of
the similarities of any member to the other members should exceed the sum of its similarities
to non- members and vice versa for non-members (Needham, 1963).
In the social sciences the search has been for tight clusters or cliques in which each
entity resembles every other, and in which all are satisfactorily described by one-the profile
of the set. Even when found they have been often seen to be not necessarily unique (Cattell
and Coulter, 1966), as one entity can be a member of more than one cluster. Clusters thus
proved difficult to define (Fisher, 1969) even when present, and most subjects have accepted
Most techniques for clustering have been developed, without formal basis, as
algorithms. A formal approach would set up a criterion to be optimized over the set of
partitions of 6. Unfortunately there are far too many partitions of n, for n > 20 say, for a
complete enumeration to be feasible. The search must be conducted over a limited range of
partitions Jackson (1970). Three types of procedure are in general use for finding clusters
(Jardine and Sibson, 1968a):
(a) agglomerative-a series of successive fusions of the n entities into groups;
(b) divisive-partition of complete set & successively into finer partitions;
(c) clustering-successive re-allocation of individuals between the sets of some initial
partition.
Of these, (a) and (b) are methods for representing the data as a dendrogram, from
which clusters are obtained by cutting at any level; (c) are procedures for finding directly a
partition of with properties approximating to some desiderata (Cormack, 1971).
Some sorting strategies do yield clusters with well-defined properties and hence are
exact algorithms for a properly defined method. Williams et al. (1966) have made the
distinction between the clusters and the route by which the clusters are obtained, but even an
exact algorithm for a properly defined method is no t necessarily optimal. With other sorting
strategies, the resulting clusters are defined only by the algorithm by which they were
obtained.
Inte r-cluster similarity:a selection of definitions of similarity between entities is available.
The similarity between clusters must also be defined. The measures proposed mostly satisfy a
recurrence formula for the dissimilarity between group k and a group (ij) formed by the
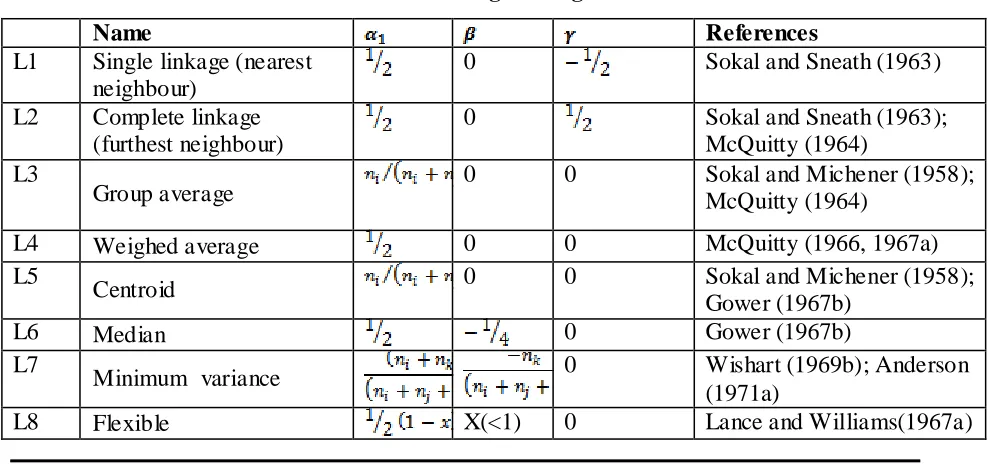
fusion of groups i and j (Lance and Williams, 1966, Anderson 1971):
dk(ij) = αidki +αjdkj+βdij+γdki–dkj.
The values of the parameters for several well-known sorting strategies are given in
Table 3.1. If similarities sij rather than dissimilarities dij are given, the same relation holds,
with dijreplaced by sij = 1- dij; if α1 + α2 + β = 1, s can replaced directly.
These relations are usually applied in clustering as an agglomerative procedure,
starting with a similarity or dissimilarity matrix between entities. A sorting procedure not
satisfying a relation such as the above has the computational disadvantage of requiring the
initial data, in addition to the cluster data, to be retained at all stages (Cormack, 1971).
Standard arithmetic procedures, however, are not invariant under monotonic
(dki, dkj) (Johnson, 1967).
Nearest neighbour is the simplest agglomerative sorting procedure and requires only a
similarity structure in the form of a complete ordering on x . The procedure may be
continued to give a complete dendrogram, in which form results are usually expressed, or
may be terminated at any threshold t. The clusters so formed are defined by the condition that
two entities Ej, Ej belong to the same cluster if there exists a chain of entities Ek, E1,...,Eq, Er
such that Sik, Ski,... Sqr, Srj are all greater than t. Sorting strategy Ll is an exact algorithm for
such single- linkage clusters. Entities tend to be incorporated into existing clusters rather than
joined to form the core of an independent cluster. Williams et al. (1966) define a coefficient
of chaining to give numerical expression to this tendency. In the absence of a formal
definition of chaining such a coefficient gives only spurious precision to any argument about
the undesirability of this property. Lance and Williams (1967) term this feature of the sorting
strategy “space-contraction”, a concept whose value is reduced by its lack of formal
definition. One advantage of single linkage is that successive fusions always occur at lower
levels of inter-cluster similarity.
Single linkage does not give satisfactory results if intermediates are present between clusters
(Hodson et al., 1966). Such intermediates can be viewed as the result of random noise, and
methods have been proposed for eliminating noisy entities (Wishart, 1969a,b,c) or noisy
variables (Baron and Fraser, 1968). Shepherd and Willmott (1968) suggest imposing a
requirement that an entity is added to a cluster only if its similarities to k or more members of
[image:9.596.66.561.517.752.2]the cluster are all greater than some threshold.
Table 3.1: Sorting Strategies
Name References
L1 Single linkage (nearest
neighbour)
0 Sokal and Sneath (1963)
L2 Complete linkage
(furthest neighbour)
0 Sokal and Sneath (1963);
McQuitty (1964) L3
Group average 0 0 Sokal and Michener (1958); McQuitty (1964)
L4 Weighed average 0 0 McQuitty (1966, 1967a)
L5
Centroid 0 0 Sokal and Michener (1958);
Gower (1967b)
L6 Median 0 Gower (1967b)
L7
Minimum variance 0 Wishart (1969b); Anderson
(1971a)
Furthest neighbour sorting also requires only a similarity ordering on x . If the
dendogram is terminated at a threshold t the clusters so formed are defined by the condition
that the similarity between all pairs of entities in a cluster must be greater than t. Strategy L2
is an exact algorithm for such complete- linkage clusters. Since the similarity of a single entity
with a cluster is the minimum of its similarities to the individual ent ities in the cluster, this
strategy produces compact clusters with no chaining. Again successive fusions occur
monotonically with inter-cluster similarity (Cormack, 1971).
Group average methods require numerical similarity indices and are intermediate in e ffect
between Ll and L2. Only similarity indices whose average is meaningful should be used. The
similarity between groups is given as
by (Sokal and Sneath, 1963). Strategy L3 takes wi= 1, L4 takes wi = nA. These strategies are
monotonic. However, the clusters formed are defined only by the strategies.
Centroid sorting has its origins in the characterization of the data matrix as points in
Euclidean space. Every cluster is regarded as a single point at its centroid. Agglomerative
techniques fuse either the two clusters with minimum between-centroid distance (L5) or those
which yield minimum within-cluster variance (L7). However, the former is not monotonic
(Cormack, 1971).
Although the geometrical basis of the method suggests that Euclidean distance Ī1 be
used as dissimilarity index, the method can be used with any index, although a recurrence
relation such as those in Table 3.1 need not result. The method first appeared as Sokal and
Michener‟s (1958) unweighted pair-group method. The geometric properties are given by
Gower (1967).
With Ī1 as dissimilarity measure, it is natural to seek to minimize the within- group
sum of squares. at each fusion (L7). The k-partition of resulting at any level of the
dendogram may be regarded as an approximation to the k-partition minimizing the total
within group sum of squares. This is a measure of the disorder in the system. Algorithms and
discussions have been given by Ward (1963), Ward and Hook (1963), Orloci (1967) and
Wishart (1969b). A related method, described earlier by Sawrey et al. (1960), built up a
hierarchy from mutually dissimilar nucleus groups by incorporating in each group those
points nearer than a preassigned threshold: centroids and distances were recomputed for these
The true significance levels for one-dimensional problem described by Fisher (1958)
have been obtained by Engelman and Hartigan (1969). The relationship between clustering
and multiple comparison tests has been explored by Calinski (1969): although overlapping
clusters are usually apposite, Engelman and Hartigan's table might yield instructive
comparisons with standard procedures.
Fisher (1969) considers a generalization of the problem to allow weighting of the
points and their interactions so that there is a cost involved in expressing the n points as n*
centroids. The aim is to minimize this cost. Fisher (1969) allows a general metric similarity
which can be transformed to Euclidean distance in the way proposed by Gower (1966). The
algorithm improves on that of Ward (1963) by trying some sub-optimal fusions at specified
places in the hierarchy in the hope that one of these may lead to a better clustering than that
obtained by optimizing the hierarchical route. Fisher (1969) suggests t hat, for small n, the
degree of optimality attained be assessed by continuing the fusion until there are only two
clusters, whose composition can be compared with the optimal found from enumerating all
such partitions.
An alternative strategy for building the whole dendrogram simultaneously is to
complete each cluster that is initiated before starting a new cluster. This technique has been
used by MacQuitty (1964) and Carmichael et al. (1968) using LI, and by Sokal and Michener
(1958), Kendall (1966) and Hope (1969) using L3. Hope(1969) places the extra requirement
that inter-cluster fusions up to a chosen threshold be made before entity-cluster ones. He
forms a dendrogram by a set of decreasing thresholds. Otherwise an arbitrary stopping rule
has to be chosen, usually on the basis of some discontinuity in the similarity with the cluster
of the next entity to be incorporated. In this case, overlapping clusters are a logically
inescapable development. MacQuitty‟s (1964) proposed stopping rule-to add a new entity
only if it is nearer to a point in the cluster than to a point not in the cluster-seems less
arbitrary, avoids overlapping clusters and undoubtedly lessens chaining.
4 . Hierarchical techniques
We begin by considering the class of hierarchical cluste ring techniques. These are
perhaps the most popular of all the multitude of cluster methods, and the literature
surrounding them is enormous. The concept of the hierarchical representation of a data set
was developed primarily in biology. The structures output from a hierarchical clustering
method resembles the traditional hierarchical structure of linnean taxonomy with its graded s
into genera, etc. Although any numerical taxonomic exercise with biological data need not
replicate the structure of traditional classification, there nevertheless remains a strong
tendency among, biologists to prefer hierarchical classifications. However, these methods are
now used in many other fields in which hierarchical structures may not be the most
appropriate, and the logic oftheir use in such areas needs careful evaluation. For example, in
their biological applications questions concerning the optimal number of groups do not
arise-here the investigator is specifically interested in the complete tree structure. Such questions
are however raised by other users of these techniques, who consequently require a decision
regarding that stage of the hierarchical clustering process which may be regarded as optimal
in this sense. Informal methods which have been suggested for this purpose are generally of
the type where the dendrogram is examined for large changes of level, this being taken as
indicative of the correct number of groups. However Everit (1974) showed that such a
procedure may in many cases be misleading; it appeared that a large change in fusion level in
a dendrogram is a necessary but not a sufficient condition for the presence of clear-cut
clusters. A slightly more formal approach to the problem is taken by Mojena (1977) who
described two possible 'stopping rules'. From empirical studies described in the paper, one of
these rules does appear worthy of further consideration as a pragmatic means of objectively
assessing the selection of a particular partition from a hierarchic clustering.
The late 1960's saw the first attempts at constructing a theoretical framework within
which to study the properties of hierarchical techniques. Johnson (1967) showed that
hierarchical clusters correspond to a distance metric which satisfies the ultrametric
inequality, and that consequently a hierarchic dendrogram is characterized by an ultrametric.
Since the input similarities or distances are not generally ultrametric (and only occasionally
metric), Jardine and Sibson (1968) suggest that a cluster method which transforms a
similarity matrix into a hierarchic dendrogram should therefore be regarded as a method
whereby the ultrametric inequality is imposed on a similarity coefficient. They then spec ify a
number of criteria which they argue it is reasonable for any such transformation to satisfy,
and prove that single-linkage is the only method satisfying all the criteria, the implication
seemingly being that it is therefore the only acceptable method. This conclusion has led to a
certain amount of controversy. For example, Williams et al., (1971) question the need for
cluster methods to satisfy all of Jardine and Sibson's proposed criteria, and adopt a more
pragmatic approach to clustering, insisting that in practice single-linkage did not provide
solutions which investigators found useful. Again, Gower (1975) revealed that Jardine and
whether their criteria were not too stringent. His conclusion was that some of the criteria are
not essential. It must be said that the approach taken by Jardine and Sibson appears to have
had little impact on the majority of cluster analysis users; single- linkage is not particularly
popular and .the alternative mathematically acceptable method provided by these two authors
is applicable only to small data sets and the solutions given are generally extremely difficult
to Interpret.
An alternative and very promising approach for understanding and evaluating the
variety of hierarchical techniques available is to compare the effectiveness of different
methods across a variety of data sets generated to have a particular structure. In this way the
solutions obtained by a particular technique may be compared with the generated structure.
Several studies of this type have been undertaken (for example, Cunningham and Ogilvie
1972, Kupier and Fisher 1975, and Blashfield 1976). In general the results of such studies
indicate that (1) no single method is best in every situation (2) the mathematically respectable
single linkage is, in most cases, the least successful for the data used and (3) group average
clustering and a method due to Ward (1963), do fairly well overall. Such empirical stud ies
can, of course, never afford a complete evaluation of clustering methods; the results obtained
do however, appear to indicate that Williams et al. (1971) are correct in the pragmatic
approach they take and that there are more useful clustering methods than the mathematically
acceptable single linkage technique.
On the other hand the single linkage method does have a number of desirable
properties, perhaps the most important of which is that its results are invariant under
monotonic transformations of the similarity matrix. (Other monotone invariant methods have
been suggested by Hubert (1973) and D'Andrade (1978). This has led various authors to
adapt the method in some way so as to retain its useful mathematical properties but to make it
more practicably relevant. Examples are the methods proposed by Wishart (1969c). In
addition Sibson (1973) has produced a very efficient algorithm for the technique which
enables it to handle very large data sets and this may be regarded as a distinct advantage in
many practical situations.
4.1 Comparison of various hierarchical techniques:
Among the hierarchical techniques, single linkage was found to be the only method to
satisfy the various mathematical criterion proposed by Jardine ant Sibson (1971). These
criterion are:i) It is invariant to transformations.
ii) „Powerful‟ in estimating the true partitions when the true partitions include a single
iii) Set consistent and optimizes the connected set of pairs (Jardine and Sibson, 1971)
iv) Possesses the property of chaining and monotonicity.
Fisher and Van Ness (1971) observed that Centroid linkage, Average linkage, Median
linkage and Ward‟s methods cannot produce a hierarchical tree with strictly increasing
amalgamation distances. In these cases it may be seen that stray branches do not connect to
others. If this happens Single or Complete linkage methods should be considered. Fisher and
Van Ness (1971) concluded that these and other problems made Centroid, Average, Median
and Ward‟s (as well as k-means) “inadmissible” clustering procedures. In practice and in
Monte Carlo simulations, however, they sometimes perform better than Single and Complete
linkage.
Williams et al. (1971) compared the performance of certain methods classified under
the hierarchical approach i.e., average linkage, complete linkage, divisive and the Ward's
minimum variance method.
The concept of „power‟ for comparing the efficiency of single and complete linkage
methods was considered by Baker and Hubert (1975). They found on the basis of empirical
data that the single linkage method was more „powerful‟ in estimating the true partitions
when the true partitions include a single larges subset. However, when this largest subset
consisted of less number of objects complete linkage procedure was found to be performing
better.
Milligan(1980) compared and tested all of the hierarchical techniques in a large
Monte Carlo simulation of clustering procedures. White and Perry (1989) compared the
performance of six methods of clustering viz., the average and complete linkage methods, the
centroid, Ward minimum variance method and the k- means method in addition to the
principal components method and found that performance of Ward's minimum variance and
complete linkage methods was similar to the extent of classifying 87 percent of the similar
areas.
Fernau and Samson (1990) compared the performance of the three clustering methods
i.e., average linkage, centroid, and Ward's method for defining the periods of meteorology
and precipitation chemistry in East -North America and found that Ward's method yielded
clusters of approximately equal size (which are non-overlapping), while the other methods
4.2 Clustering by optimizing a predefined measure
Let us now move on to consider those clustering techniques which seek a partition of
the data into k groups by attempting to optimize some predefined numerical measure
indicative of a desirable clustering solution. Such methods differ from the methods discussed
above in that the solution does not portray hierarchical relationships among the entities. The
clusters denoted in a partitioning solution are discrete and exist at a single rank. For the
moment we shall assume that the value of k is given a priori; the problem of deciding on an
appropriate value for k will be discussed in detail later.
Several numerical criterion have been proposed for this approach to clustering. The
most common is minimization of trace (W), a criterion which has been discussed by
Friedman and Rubin (1967), McRae (1971) and Gordon and Henderson (1977). According to
a survey of classification in 1973 conducted by Blashfield (1976), this method is, in fact, one
of the three most popular techniques of cluster analysis. It however suffer s from a number of
problems. Firstly the method is transformation dependent; in general different results will be
obtained from applying the technique to, say, the raw data, or to the data standardized in the
usual way, that is to zero mean and unit standard deviation. This is of considerable practical
importance in many applications where variables are on different metrics and some form of
standardization is, in general, unavoidable. A further problem with the min {trace (W)}
criterion is that the clusters produced are constrained to being hyper spherical; in cases where
the real clusters in the data are of some other shape this may produce misleading solutions.
Examples are given in Wishart (1969c) and Everitt (1974).
The transformation dependency problem of the min{trace (W)} criterion led Friedman
and Rubin (1967) to suggest other numerical cluster measures invariant to non-singular linear
transformations of the data. Amongst these the one that has become most popular is
minimization of det (W). Friedman and Rubin (1967) led to this criterion by consideration of
Wilks' lambda used as a test statistic in multivariate analysis of variance. Scott and Symon
(1971) showed how it arised using likelihood ratio considerations and Binder (1978) using a
Bayesian approach to clustering showed it may be justified as maximizing certain
approximated posterior probabilities. Apart from its advantages with regard to
standardization considerations it has a further point in its favour, namely that it does not
restrict clusters to being hyperspherical. It does however assume that all clusters in the data
have the same shape, and again this can be a problem when the actual structure is not
overcoming this particular disadvantage of the det (W) criterion are made by Scott and
Symons (1971). and Maronna and Jacovkis (1974).
4.3 Choosing a ‘Best’ clustering technique
The increasing number of cluster analysis methods available has led several authors to
consider the perplexing problem of choosing a „best‟ method in some sense. Fisher and Van
Ness (1971), for example, while not considering this problem to be defined well enough for a
complete solution, suggest various admissibility conditions which they suggest will eliminate
obviously bad clustering algorithms. Jardine and Sibson (1968) made some recommendations
regarding which techniques are acceptable and which are not. Whils t such theoretical
approaches to this problem may be illuminating in various respects, they have not led to
results acceptable in practice, and it appears unlikely that the relations between different
methods and data types will be untangled solely by formal analysis and argument. An
alternative and very promising approach to understanding and evaluating the variety of
clustering techniques available is to compare the effectiveness of different methods across a
variety of data sets
5. Choosing the numbe r of clusters
There are no completely satisfactory methods for determining the number of
population clusters for any type of cluster analysis (Everitt,1979; Hartigan, 1985a,b and
Bock,1985).
Ordinary significance tests, such as analysis-of-variance F tests, are not valid for
testing differences between clusters. Since clustering methods attempt to maximize the
separation between clusters, the assumptions of the usual significance tests, parametric or
nonparametric, are drastically violated. Methods that purport to test for clusters against the
null hypothesis that objects are assigned randomly to clusters (McClain and Rao 1975;
Klastorin 1983) are useless.
Most valid tests for clusters either have intractable sampling distributions or involve
null hypotheses for which rejection is uninformative. For clustering methods based on
distance matrices, a popular null hypothesis is that all permutations of the values in the
distance matrix are equally likely (Ling 1973; Hubert 1974). Using this null hypothesis, a
permutation test or a rank test can be used. The trouble with the permutation hypothesis is
that with any real data, the null hypothesis is implausible even if the data do not contain
clusters. Rejecting the null hypothesis does not provide any useful infor mation (Hubert and
Another common null hypothesis is that the data are a random sample from a
multivariate normal distribution (Wolfe 1970, 1978; Duda and Hart 1973; Lee 1979). The
multivariate normal null hypothesis is better than the permutation null hypothesis, but it is not
satisfactory because there is typically a high probability of rejection if the data are sampled
from a distribution with lower kurtosis than a normal distribution, such as a uniform
distribution. The tables in Englemann and Hartigan (1969), for example, generally lead to
rejection of the null hypothesis when the data are sampled from a uniform distribution.
Perhaps a better null hypothesis is that the data are sampled from a uniform
distribution (Hartigan 1978; Arnold 1979; Sarle 1983). The uniform null hypothesis leads to
conservative error rates when the data are sampled from a strongly unimodal distribution
such as the normal. However, in two or more dimensions and depending on the test statistic,
the results can be very sensitive to the shape of the region of support of the uniform
distribution. Sarle (1983) suggested using a hyperbox with sides proportional in length to the
singular values of the centered coordinate matrix.
Given that the uniform distribution provides an appropriate null hypothesis, there are
still serious difficulties in obtaining sampling distributions. Some asymptotic results are
available (Hartigan 1978, 1985; Pollard 1981; Bock 1985) for the within-cluster sum of
squares, the criterion that Ward's minimum variance method attempt to optimize. No
distributional theory for finite sample sizes has yet appeared. Currently, the only practical
way to obtain sampling distributions for realistic sample sizes is by computer simulation.
Arnold (1979) used simulation to derive tables of the distribution of a criterion based
on the determinant of the within-cluster sum of squares matrix |W|. Marriott (1971, 1975)
also gave useful information on |W| as a criterion for the number of clusters.
Sarle (1983) used extensive simulations to develop the cubic clustering criterion
(CCC), which can be used for crude hypothesis testing and estimating the number of
population clusters. The CCC is based on the assumption that a uniform distribution on a
hyper-rectangle will be divided into clusters shaped roughly like hyper-cubes. In large
samples that can be divided into the appropriate number of hyper-cubes, this assumption
gives very accurate results. In other cases the approximation is generally conservative.
Milligan and Cooper (1985) and Cooper and Milligan (1984) compared thirty
methods for estimating the number of population clusters using four hierarchical clustering
methods. The three criteria that performed best in these simulation studies with a high degree
of error in the data were a pseudo F statistic developed by Calinski and Harabasz (1974), a
ˆ
pseudo t2 statistic, and the cubic clustering criterion.
Mixture models, usually Gaussian, provide a useful statistical model for cluster
analysis. Hypothesis testing requires bootstrapping except in special cases (Titterington et
al.,1985; McLachlan and Basford,1988); The Bayesian approach is promising for a variety of
mixture models, both Gaussian and non-Gaussian {see Binder (1978, 1981) and Banfield and
Raftery (1993)}.Some research has tended to de-emphasize mixture models in favor of
nonparametric models in which clusters correspond to modes in the probability density
function. Hartigan and Hartigan (1985) and Hartigan (1985) developed a test of unimodality
vs. bimodality in the univariate case.
Nonparametric tests for the number of clusters can also be based on nonparametric
density estimates. This approach requires much weaker assumptions than mixture models,
namely, that the observations are sampled independently and that the distribution can be
estimated nonparametrically. Silverman (1986) describes a bootstrap test for the number of
modes using a Gaussian kernel density estimate, but problems have been reported with this
method under the uniform null distribution. Further developments in nonparametric methods
were given by Mueller and Sawitzki (1991), Minnotte (1992), and Polonik (1993). All of
these methods suffer from heavy computational requirements.
One useful descriptive approach to the number-of-clusters problem is provided by
Wong and Schaack (1982), based on a nearest-neighbor density estimate. The
kth-nearest- neighbor clustering method developed by Wong and Lane (1983) is applied with
varying values of k. Each value of k yields an estimate of the number of modal clusters. If
the estimated number of modal clusters is constant for a wide range of k values, there is
strong evidence of at least that many modes in the population. A plot of the estimated
number of modes against k can be highly informative. Attempts to derive a formal hypothesis
test from this diagnostic plot have met with difficulties, but a simulation approach similar to
Silverman's (1986) does seem to work (Girman 1994). The simulation, of course, requires
considerable computer time.
Sarle and Kuo (1993) gave a less expensive approximate nonparametric test for the
number of clusters that has been implemented in the MODECLUS procedure in the
SAS/STAT product. This test sacrifices statistical efficiency for computational efficiency.
References
Geol., 3.
2. Arnold, S.J. 1979. A test for clusters. Journal of Marketing Research, 16: 545-551.
3. Baker, F.B. and Hubert, L.J. 1975. Measuring the power of hierarchical cluster
analysis. Journal of the American Statistical Association, 70 (349): 31-38.
4. Balakrishnan, V. and Sanghvi, L.D. 1968. Distance between pop ulations on the basis
of attribute data. Biomatrics, 24: 859-865
5. Banfield, J.D. and Raftery, A.E. 1993. Model-based Gaussian and non-Gaussian
clustering. Biometrics, 49: 803-821.
6. Banister, P. 1968. An evaluation of some procedures used in simple ordinations.
Journal of Ecology, 56: 27-34.
7. Barnett, V., ed. 1981. Interpreting Multivariate Data, New York: John Wiley & Sons,
Inc.
8. Baron, D.N. and Fraser, P.M. 1968. Medical application of taxonomic methods.
British Medical Bulletin, 24: 236-240.
9. Binder, D.A. 1978. Bayesian cluster analysis. Biometrika, 65: 31-38.
10. Binder, D.A. 1981. Approximations to bayesian clustering rules. Biometrika, 68:
275-285.
11. Blashfield, R.K. 1976. Mixture model tests of cluster analysis: Accuracy of four
agglomerative hierarchical methods. Psychological Bulletin, 83: 377-388.
12. Blashfield, R.K. and Aldenderfer, M.S. 1978. The Literature on cluster analysis.
Multivariate Behavioral Research, 13: 271-295.
13. Bock, H.H. 1985. On some significance tests in cluster analysis. Journal of
Classification, 2: 77-108.
14. Bolshev, L.N. 1969. Cluster analysis. Bull. I.S.I., 43, Book 1, 411-425.
15. Calinski, T. 1969. On the applications of cluster analysis to experimental results. Bull.
I.S.I., 42, Book 2, 101-103.
16. Calinski, T. and Harabasz, J. 1974. A dendrite method for cluster analysis.
Communications in Statistics, 3: 1-27.
Systematic Zoology, 17: 144-150.
18. Cattell, R.B. 1944. A note on correlation clusters and cluster search me thods.
Psychometrika,9: 169-184.
19. Cattell, R.B. 1949. rp and other coefficients of pattern similarity. Psychometrika, 14:
279-298.
20. Cattell, R.B. 1952. The three basic factor analytic research designs – their
inter-relations and derivatives. Psychological Bulletin, 49: 499-520.
21. Cattell, R.B. and Coulter, M.A. 1966. Principles of behavioural taxonomy and the
mathematical basis of the taxonome computer program. Brit. J. Math. Statist.
Psychol., 19, 237-269.
22. Cooper, M.C. and Milligan, G.W. 1984. The Effect of Error on Determining the
Number of Clusters. Proceedings of the International Workshop on Data Analysis,
Decision Support and Expert Knowledge Representation in Marketing and Related
Areas of Research, 319-328.
23. Cormack, R.M. 1971. A review of classification (with discussion). Journal of Royal
Statistical Society (A), 134: 321-367.
24. Cunningham, K.M. and Ogilvie, J.C. 1972. Evaluation of hierarchical grouping
techniques: A preliminary study. The Computer Journal, l5:209-213.
25. D‟Andrade, R.G. 1978. V-statistic hierarchical clustering. Psychometrika, 43: 59-67.
26. Duda, R.O. and Hart, P.E. 1973. Pattern Classification and Scene Analysis, New
York: John Wiley & Sons, Inc.
27. Eades, D.C. 1965. The inappropriateness of the correlation coefficient as a measure of
taxonomic resemblance. Systematic Zoology, 14, 98-100.
28. Englemann, L. and Hartigan, J.A. 1969. Percentage points of a test for clusters.
Journal of the American Statistical Association, 64: 1647-1648.
29. Everitt, B.S. 1974. Cluster Analysis. Heinemann, London.
30. Everitt, B.S. 1974. Cluster analysis. John Wiley, New York pp 1-117.
32. Fernau, M.E. and Samson, P.J. 1990. Use of cluster analysis to define periods of
similar meteorology and precipitation chemistry in Eastern North American Part 1:
Transport patterns Journal of Applied Meteorology,29(8): 735-750.
33. Fisher, L. and Van Ness, J.W. 1971. Admissible clustering procedures. Biometrika,
58: 91-104.
34. Fisher, W. D. 1958. On grouping for maximum homogeneity. Journal of the
American Statistical Association,53: 789-798.
35. Fisher, W.D. 1969. Clustering and Aggregation in Economics. Baltimore: Johns
Hopkins Press.
36. Fleiss, J.L. and Zubin, J, 1969. On the methods and theory of clustering. Multivariate
Behavioral Research, 4: 235-250.
37. Fleiss, J.L., Lawlor, W., Platruan, S.R. and Fieve, R.R. 1971. On the use of inverted
factor analysis for generating typologies. Journal of Abnormal Psychology, 77
:127-132.
38. Friedman,.H.P. and Rubin, J. 1967. On some invariant criteria for grouping data.
Journal of the American Statistical Association, 62: 1159-1178.
39. Gengerelli, J.A. 1963. A method for detecting subgroups in a population and
specifying their membership. Journal of Psychology, 5: 457-468.
40. Girman, C.J. 1994. Cluster Analysis and Classification Tree Methodologyas an Aid to
Improve Understanding of Benign Prostatic Hyperplasia. Ph.D. thesis, Chapel Hill,
NC: Department of Biostatistics, University of North Carolina.
41. Gordon, A.D. and Henderson, J.J. 1977. An algorithm for euclidean sum of squares
classification. Biometrics, 33: 355-362.
42. Gower, J.C. 1966. Some distance properties of latent root and vector methods used in
multivariate analysis. Biometrika,53: 325-338.
43. Gower, J.C. 1967. A comparison of some methods of cluster analysis. Biometrics, 23:
623-628.
44. Gower, J.C. 1969. A survey of numerical methods useful in taxonomy. Acarologia,
45. Gower; J.C. 1975. Goodness-of-fit criteria for classification and other patterned
structures. In: Procedure of the 8th International Conference on Numerical
Taxonomy, W. H. Freeman and Co. 38-62.
46. Hall, A.V. 1969. Avoiding informational distortion in automatic grouping programs.
Systematic Zoology,18: 318-329.
47. Hartigan, J.A. 1967. Representation of similarity matrices by trees. Journal of the
American Statistical Association, 62: 1140-1158.
48. Hartigan, J.A. and Hartigan, P.M. 1985. The dip test of unimodality. Annals of
Statistics, 13: 70-84.
49. Hartigan, P.M. 1985. Computation of the dip statistic to test for unimodality. Applied
Statistics, 34: 320-325.
50. Hayhoe, F.G.J., Quaglino, D. and Doll, W.R.S. 1964. The Cytology and
Cytochemistry of Acute Leukaemlas. Spec. Rep. Ser. M.R.C. No. 304. London:
H.M.S.O.
51. Hodson, F.R., Sneath, P.H.A. and Doran, J.E. 1966. Some experiments in the
numerical analysis of archaeological data. Biometrika, 53: 311-324.
52. Hope, K. 1969. The complete analysis of a data matrix. British Journal of
Psychiatrics, 115: 1069- 1079.
53. Hubert, L.J. 1973. Monotone invariant clustering procedures. Psychometrika, 38:
47-62.
54. Hubert, L. 1974. Approximate evaluation techniques for the single- link and
complete-link hierarchical clustering procedures. Journal of the American Statistical
Association, 69: 698-704.
55. Hubert, L.J. and Baker, F.B. 1977. An Empirical Comparison of Baseline Models for
Goodness-of-Fit in r-Diameter Hierarchical Clustering. In Classification and
Clustering, ed. J. Van Ryzin, New York: Academic Press, Inc.
56. Ihm, P. 1965. Automatic classification in anthropology. In The Use of Computers in
Anthropology (D. Hymes, ed.), pp. 357-76. The Hague: Mouton and Co.
57. Jackson, D.M. 1970. The stability of classifications of binary attribute data. Class.
58. Jardine, N. and Sibson, R. 1968. The construction of hierarchic and non-hierarchic
classifications. Computer Journal, 117-184.
59. Jardine, N. and Sibson, R. 1968a. A model for taxonomy. Math. Biosci., 2: 465-482.
60. Jardine, N. and Sibson, R. 1971. Mathematical Taxonomy, Academic Press I nc. New
York.
61. Johnson, S.C. 1967. Hierarchical clustering schemes. Psychometrika, 32: 241-254.
62. Kendall, M.G. 1966. Discrimination and classification. In: Proc. Symp. Multiv.
Analysis, Dayton, Ohio (P. R. Krishnaiah, ed.), pp. 165-185. New York: Academic
Press.
63. Klastorin, T.D. 1983. Assessing cluster analysis results. Journal of Marketing
Research, 20: 92-98.
64. Kupier, F.K. and Fisher, L. 1975. A Monte carlo comparison of six clustering
procedures. Biometrics, 31: 777-783.
65. Kurczynski, T.W. 1970. Generalized d istance and discrete variables. Biometrics, 26:
525-534.
66. Lance, G.N. and Williams, W.T. 1966. A generalized sorting strategy for computer
classifications. Nature, 212- 218.
67. Lance, G.N. and Williams, W.T. 1967. A general theory of classificatory sorting
strategies. I. Hierarchical systems. TheComputer Journal, 9: 373-380.
68. Ling, R.F 1973. A probability theory of cluster analysis. Journal of the American
Statistical Association, 68: 159-169.
69. MacQuitty, L.L. 1964. Capabilities and improvements of linkage analysis as a
clustering method. Educ. Psychol. Measur., 24: 441-456
70. Maronna, R. and Jacovkis, P.M. 1974. Multivariate clustering procedures with
variable metrics. Biometrics 30: 499-505.
71. Marriott, F.H.C. 1971. Practical problems in a method of cluster analysis. Biometrics,
27: 501-514.
72. Marriott, F.H.C. 1975. Separating mixtures of normal distributions. Biometrics, 31:
73. McClain, J.O. and Rao, V.R. 1975. CLUSTISZ: A program to test for the quality of
clustering of a set of objects. Journal of Marketing Research, 12: 456-460.
74. McLachlan, G.J. and Basford, K.E. 1988. Mixture Models, New York: Marcel
Dekker, Inc.
75. McRae, D.J. 1971. MICKA, a Fortran IV iterative K-means cluster analysis program.
Behavioural Science .16: 423-424.
76. Milligan, G.W. 1980. An examination of the effect of six types of error perturbation
on fifteen clustering algorithms. Psychometrika, 45: 325-342.
77. Milligan, G.W. and Cooper, M.C. 1985. An examination of procedures for
determining the number of clusters in a data set. Psychometrika, 50: 159-179.
78. Minkoff, E.C. 1965. The effects on classification of slight alterations in numerical
technique. Systematic Zoology, 14: 196-213.
79. Minnotte, M.C. 1992. A Test of Mode Existence with Applications to Multimodality.
Ph.D. thesis, Rice University, Department of Statistics, USA.
80. Mojena, R. 1977. Hierarchical grouping methods and stopping rules: An evaluation.
The Computer Journal, 20: 359-363.
81. Mueller, D.W. and Sawitzki, G. 1991. Excess mass estimates and tests for
multimodality. Journal of the American Statistical Association,86: 738-746.
82. Needham, R.M. 1963. A method of using computers in information classification. In
Information Processing, 1962 (C. Popplewell, ed.), pp. 284-287. Amsterdam: North
Holland.
83. Orloci, L. 1967. An agglomerative method for classification of plant communities.
Journal of Ecology, 55: 193-206.
84. Paykel, E.S. and Rassaby, E. 1978. Classification of suicide attempters by cluster
analysis. British Journal of Psychiatry, 33: 45-52.
85. Polonik, W. 1993. Measuring Mass Concentrations and Estimating Density Contour
Clusters--An Excess Mass Approach. Technical Report, Beitraege zur Statistik Nr. 7,
Universitaet Heidelberg.
86. Rayner, J. H. 1966. Classification of soils by numerical methods. Journal of Soil
87. Rogers, D.J., Fleming, H. and Estabrook, G. 1967. Use of computers in studies of
taxonomy and evolution. In Evolutionary Biology, (T. Dobzhansky, M. K. Hecht, and
W. C. Steere, eds)' Vol. I, pp. 169-196. New York: Appleton Century Crofts.
88. Rohlf, F.J. 1970. Adaptive hierarchical clustering schemes. Systematic Zoology. 19:
58-82.
89. Sarle, W.S. 1983. Cubic Clustering Criterion, SAS Technical Report A-108, Cary,
NC: SAS Institute Inc.
90. Sarle, W.S and Kuo, An-Hsiang 1993. The MODECLUS Procedure, SAS Technical
Report P-256, Cary, NC : SAS Institute Inc.
91. Sawrey, W.L., Keller, L. and Conger, J.J. 1960. An objective method of grouping
profiles by distance functions and its relation to factor analysis. Educ. Psychol.
Measur. 20: 651-674.
92. Scott, A.J. and M. Knott 1974. A cluster analysis method for grouping means in the
analysis of variance. Biometrics,30: 507-512.
93. Scott, A.J. and Symons, M.J. 1971. Clustering methods based on likelihood ratio
criteria. Biometrics, 27: 387-397.
94. Shepherd, M.J. and Willmott. A. 1968. Cluster analysis on the Atlas computer.
Computer Journal, II, 57-62.
95. Sibson, R. 1973. SLINK: An optimally efficient algorithm for the single-link cluster
method. The Computer Journal 16:30-34.
96. Silverman, B.W. 1986. Density Estimation, New York: Chapman and Hall.
97. Sokal, .R.R. and Michener, C.D. 1958. A statistical method for evaluating systematic
relationships. Univ. Kansas Sci. Bull., 38: 1409-1438.
98. Sokal, R.R. 1961. Distance as a measure of taxonomic similarity. Systematic Zoology,
10: 70-79.
99. Sokal, R.R. and Sneath, P.H.A. 1963. Principles of Numerical Taxonomy. London:
Freeman.
100. Somers, K.M. 1986. Multivariate allometry and removal of size with principal
101. Titterington, D.M., Smith, A.F.M., and Makov, U.E. 1985. Statistical Analysis of
102. Ward, H.J. 1963. Hierarchical grouping to optimize an objective function. Journal of
the American Statistical Association, 58: 236-244.
103. Ward, J.H. and Hook, M.E. 1963. Application of an hierarchical grouping procedure
to a problem of grouping profiles. Educ. Psychol. Measur., 23: 69-82.
104. White, E.J. and Perry, A.H. 1989. Classification of the climate of England and Wales
based on agro-climatic data. International Journal of Climatology, 9(3): 271-291.
105. Williams, W.T. and Dale, M.B.1965. Fundamental problems in numerical taxonomy.
Advances in Botanical Reasearch (R.d. Preston, ed.), 2: 35-68.
106. Williams, W.T., Lambert, J.M. and lance, G.N. 1966. Multivariate methods in plant V
ecology, V. Similarity analyses and information analysis. Journal of Ecology, 54:
427-445.
107. Williams, .W.T., Lance, G.N., Dale, M.B. and Clifford, H.T. 1971. Controversy
concerning the criteria for taxonometric strategies. The Computer Journal 14:
162-165.
108. Wishart, D. 1969a. Numerical classification method for der iving natural classes.
Nature, 221: 97-98.
109. Wishart, D. 1969b. An algorithm for hierarchical classifications. Biometrics, 25:
165-170.
110. Wishart, D. 1969c. Mode analysis. In: Numerical Taxonomy (A. J. Cole, ed.), pp.
282-308. New York: Academic Press.
111. Wolfe, J.H. 1970. Pattern clustering by multivariate mixture analysis. Multivariate
Behavioural Research, 5: 329-350.
112. Wolfe, J.H. 1978. Comparative cluster analysis of patterns of vocational interest.
Multivariate Behavioral Research, 13: 33-44.
113. Wong, M.A. and Lane, T. 1983. A kth nearest neighbor clustering procedure. Journal
of the Royal Statistical Society, Series B, 45: 362-368.
114. Wong, M.A. and Schaack, C. 1982. Using the kth Nearest Neighbor Clustering
Procedure to Determine the Number of Subpopulations. American Statistical