The Situation of Older
Persons in Myanmar
HelpAge International
East Asia/Pacific Regional Office 6 Soi 17, Nimmanhaemin Road
Suthep, Muang, Chiang Mai 50200, Thailand Tel: +66 53 225440, Fax: +66 53 225441 hai@helpageasia.org
www.helpage.org
HelpAge International helps older people
claim their rights, challenge discrimination
and overcome poverty, so that they can lead
dignified, secure, active and healthy lives.
HelpAge International Myanmar Country Office No 10, Kanbawza Avenue
Shwetaungya Ward No 1, Bahan Township Yangon, Myanmar
The Situation of Older
Persons in Myanmar
By John Knodel
in collaboration with HelpAge International staff
This document is the outcome of a national research on the situation of older people in Myanmar, carried out in 2012. The study was conducted with the partnership, encouragement and facilitation of the Ministry of Social Welfare, Relief and Resettlement, while UNFPA provided valuable support and information.
It is expected that this study will inform social and economic policies, especially those related to increasing income, expanding human security and reducing poverty among older people, their families and communities.
We are indebted to John Knodel, Research Professor Emeritus, Population Studies Center, Institute for Social Research of the University of Michigan. He led the design and data analysis, as well as the writing of this publication. We also acknowledge the team from Myanmar Survey Research who carried out the field work in a professional and timely manner.
Eduardo Klien
Regional Director, East Asia/Pacific
HelpAge International
There is a rapid demographic change occurring all over the world due to high quality health care services, a rise in expected human life span, and a decrease in birth rate as a result of family plan-ning.
The rising older people ratio is an opportunity as well as a challenge. Countries that are yet to be ready for social protection, particularly the developing countries, are more likely to be experiencing this issue.
At this moment, the elderly care services are no longer being carried out as normal social welfare services and a focus should be placed on ensuring elderly right-based services. The income security, dignity and participation of older people should be considered. We need to realise the real situation of older people in order to develop policies and plans for elderly care services. With the intention of filling the gap, the situational analysis on the elderly population has been done with the cooperation between the Department of Social Welfare and HelpAge International.
This survey will significantly contribute to Myanmar’s future planning on elderly care. I would like to extend my deepest gratitude to Department of Social Welfare, HelpAge International, UNFPA, Myanmar Survey Research Team and each and every one who contributed to this process.
U Aung Tun Khaing
Chairman
Older People Project Advisory Committee
Foreword
Executive summary
Chapter 1: Population ageing in Myanmar
Chapter highlights 2
Population ageing as an emerging concern 3 The demography of ageing in Myanmar 4
Survey description 9
Chapter 2: Social characteristics of older people
Chapter highlights 12
Marital status 13
Number of living children 14
Education and literacy 16
Religion
Community participation and social contact Exposure to mass media
Chapter 3: Economic activity and income
Chapter highlightsLifetime employment Current employment Disengagement from work Sources of material support
Chapter 4: Material well-being
Chapter highlightsHousing quality
Household possessions Telephone access Income and assets Savings and debt
Overall economic status
Contents
II
V
1
2 3 4 911
12 13 14 16 18 19 2123
24 25 26 28 3051
5253 57 60
65
66 67 67 71 72 76 78 79 79 81 8287
88 89 92 94 95 99 100 103 106109
110 111114
Chapter 5: Living arrangements
Chapter highlights
Household size and composition
Multi-generation and skip-generation households Location of children
Chapter 6: Family support and intergenerational exchanges
Chapter highlightsSupport from children to parents Material support
Assistance with work Assistance with care Social support
General views regarding filial support and care Support from parents to children
Material support
Housework and home maintenance Grandchild care
Chapter 7: Health
Chapter highlightsSelf-assessed health and memory Current symptoms
Vision and hearing Functional health Nutrition Risk behaviours Health service usage Psychological well-being
Chapter 8: Conclusions and options for the future
The changing situation of older people in MyanmarOptions for the future
51
52 53 57 6065
66 67 67 71 72 76 78 79 79 81 8287
88 89 92 94 95 99 100 103 106109
110 111114
Population ageing and the well-being of older persons are emerging as major challenges for families, communities and states in much of Asia. To respond effectively with appropriate policies and programmes, both government and non-government agencies need reliable and comprehensive information about the situation of the older population. HelpAge International therefore contracted Myanmar Survey Research to conduct the first comprehensive Survey of Older Persons in Myanmar in March and April 2012.* The survey interviewed 4,080 persons
aged 60 and older and covered the entire country except Kachin State.
The ageing of Myanmar’s
population
Myanmar’s population is beginning to age rapidly. Although demographic information for Myanmar is limited because the last national census was in 1983, long term estimates and projections are available from the United Nations Population Division. As in other coun-tries across Southeast Asia, the number of older people in Myanmar is increasing rapidly, having virtually quadrupled over the past 60 years. Moreover, due mainly to the ongoing decline in fertility and to some extent improved life expec-tancy, the proportion of the population that is 60 years and older is increasing. Currently older people account for about 9% of the country’s population. This proportion has grown at a gradual pace over the past 50 years but will accelerate rapidly over the next four decades.
Executive summary
According to UN projections, by 2030 it will rise to 15% of the population, and by 2050 older people will comprise a quarter of Myanmar’s total population. Shortly after 2035, persons aged 60 and older will outnumber children under age 15.
Social characteristics of older
people
In old age, the spouse or adult children are usually a vital source of material and emotional support and serve as caregivers when the need arises. Because just over half of older women are widowed, they must rely more heavily on their children, while three fourths of older men are still married. Older people today have an average of four to five living children and only 6% are childless. But fertility rates in Myanmar have already fallen to two children per woman, so older people in the future will have fewer adult children available to provide support.
Only about a third of older people completed primary school. Over one-third of women have no formal education, compared to less than 10% of men. Only about half of older persons are fully literate with women particularly likely to lack literacy. The lack of education and literacy, and hence a reduced ability to access information, also characterises persons aged 70 years and older and the elderly in rural areas. Access to information may be further compromised by limited exposure to mass media.
many older people regardless of their age, gender or where they live. Three-quarters of respond-ents pray or meditate daily and 95% do so at least once a month. Almost 80% of older persons participate at least occasionally in community or religious ceremonies.
Economic activity and income
The vast majority of older women and men (94%) have been economically active during their lives. Of these, about 60% were primarily engaged in agriculture, either as farmers or agricultural labourers. About 10% engaged in non-agricultural labour and about the same percentage were formally employed, both situa-tions being more common among those living in urban areas. Yet economic activity declines rapidly with age. About half of those aged 60–64 worked during the previous year, but among people aged 70–74 this proportion drops to less than a quarter (23%). Men are twice as likely as women to remain economically active, and older people in rural areas remain economically active longer than their urban counterparts.
As income from work declines, support from children becomes more significant. Over 80% of all respondents receive some material support (cash or goods) from their children. Children are the main source of support for about 60% of older people. Nevertheless, close to a fourth of older people reported that income from their own or their spouse’s work was still their main source of support.
Pensions are very rare. Among older people in rural areas, only a few percent reported any income from a pension compared to about a fifth of urban residents. Men are almost twice as likely as women to have any pension income. Almost no respondents reported receiving any
Material well-being
In the absence of comprehensive social protec-tion, older people’s household situation and income are vital components of their material well-being. In terms of income and assets, older people, especially those in rural areas, can be described as generally poor.
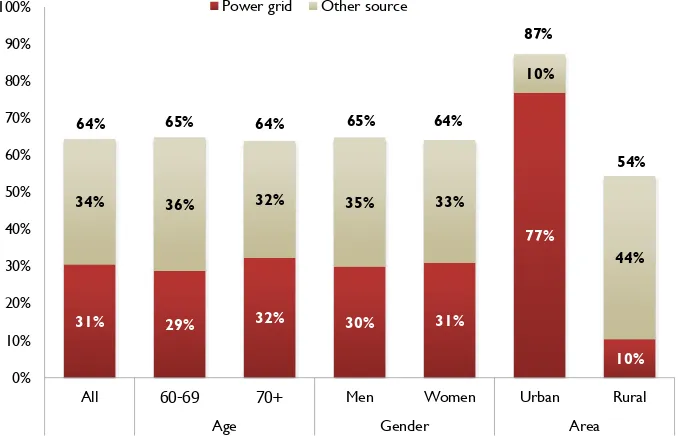
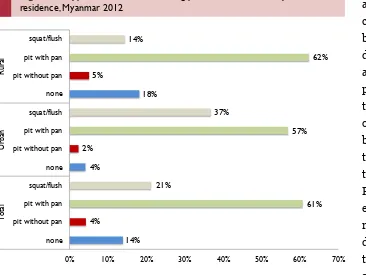
A large proportion of Myanmar’s older people live in houses made with non-permanent mate-rials. A third of older people live in homes without electricity and over half (58%) lack running water, and these situations are particu-larly common in rural areas. Although the situation has improved over the past decade, on average the homes of older people have few possessions. Half have no radio, about a third have neither radio nor television and remarkably few have electrical appliances, despite the fact that two-thirds have some access to electricity.
Older people in Myanmar typically live in low income households. Almost 10% report that their household has a monthly income of no more than 25,000 kyat, or less than US$ 1 per day (at current rates) and just over 60% report that their household income is no more than US$ 3 per day. Less than one in five older persons has savings in the form of money or gold and are twice as likely to have debts as savings. Only 55% of older people feel that their income is regularly adequate to meet their daily needs.
Living arrangements
A large majority of older people in Myanmar (86%) live in households of more than one gen-eration, and are thus potentially able to benefit from exchanges of material and emotional support. More than three-quarters live with at least one of their children; and among older people with living children, 95% have at least one child living in the same village or ward. Half of older persons live in households with at least one grandchild, but ‘skip generation’ house-holds, in which older people live with only grandchildren, are rare. Moreover, older persons usually have close relatives other than adult children who live nearby and have frequent contact with them. Thus few older persons in Myanmar are isolated from family and in general are socially integrated with their children and their kin.
Family support and
intergenerational exchanges
Older people receive substantial support from their families and also contribute significantly in return. Overall, two-thirds of adult children gave some money or goods to their parents in the previous year. Among adult children who do not live with their parents, those living in Myanmar’s two main cities or abroad give larger amounts than those who live closer, likely reflecting greater earnings. In addition, over 40% of adult children assist their parents with economic activities such as farm work or business.
Family is also the source of personal care. Daughters are the main care providers for about half of older people who receive help with daily living activities and when sick or injured. Among older couples, wives are often primary caregivers for husbands, but husbands are less likely to
provide social support through frequent visits to parents. Those at greater distances maintain some contact by telephone, but the fact that less than 10% of older persons live in households with a telephone limits phone contact.
Support is clearly reciprocal between genera-tions in Myanmar. While receiving help from family, older people also contribute substan-tially to their household. Over half who live with children give economic support to their house-hold. Adult children also benefit from significant contributions to grandchild care, housework and house maintenance by older parents who live with them. Over half of older persons who are grandparents provide grandchild care, and 15% have cared for grandchildren whose parents were absent.
Health
Health can greatly affect quality of life, physical independence and financial security. Only a third of older people in Myanmar say that their health is good or very good. Reports of poor health increase from 17% to over 30% between those aged 60–64 and those aged 80 and older. A large majority of older persons experienced one or more symptoms of ill health during the previous month, the most common being pain in their joints and spells of dizziness. Just over one-third of respondents had illness or injury during the past 12 months that prevented them from carrying out normal activities. Overall, nearly 15% of older people indicate problems with hearing and close to 30% with sight.
stand-ences are pronounced with age: respondents 70 years and older reported four times as many serious limitations with physical movement and daily living activities as those in their 60s.
Almost all who were ill or injured in the past year received medical treatment, although just over one-fourth of those who went for treatment did not receive all they felt they needed because they could not afford it. Only 12% of older people had received a general physical examination in the previous three years, and those who had were more likely to live in urban areas.
Conclusions and options for
the future
Many older people in Myanmar remain active and independent. They work for income or else provide help around the home and with grand-children, thus allowing their adult children to be economically more productive. However, many others are vulnerable and need assistance, especially as they reach advanced years.
Currently and in the past, the family (particu-larly spouses and adult children) has been the bedrock of care and support for older people in Myanmar, reflecting the strong cultural tradi -tion of filial responsibility and respect for elders. This is not to deny that gaps exist within the system, often stemming from severe poverty that afflicts both parents and their adult children. Moreover, demographic trends pose serious challenges for the future, especially the inevita-ble decline in family sizes and likely increased migration of adult children as the economy expands and changes. In addition, although small, the proportion of older persons who have no children is expected to increase.
Myanmar has now a window of opportunity to
fill the gaps created by changing family structures, through initiatives by government, empowered communities and civil society. The predictability of the demographic changes that lie ahead and the extensive information provided by the Survey of Older Persons in Myanmar highlight the importance of a social protectionsystem that embraces the older population, their families and communities. This window of opportunity is limited in time and should not be missed.
CHAPTER 1:
CHAPTER 1:
Population ageing in Myanmar
CHAPTER 1:
Chapter highlights
The rapid increase in the number of older persons, their growing share of the total population (i.e. population ageing), and the challenges these pose are a major concern of governments and international agencies in Southeast Asia and elsewhere.
Given the absence of a national census in Myanmar since 1983, there is considerable uncertainty about the current size and age composition of the population.
United Nations estimates suggest that between 1950 and 2012 the size of Myanmar’s population aged 60 years and above almost quadrupled and that their share of the total population rose from under 6% to almost 9%.
The share of the population in older ages will increase more rapidly in the coming decades as a result of the steep fall in fertility over past decades and anticipated improvement in older age survival rates.
UN projections suggest that one-fourth of Myanmar’s population will be 60 or older by 2050. Moreover, following 2035 persons 60 and older will outnumber children under age 15 for the first time in known Myanmar history.
As a result, the majority of the dependent age population outside the working ages will shift from children to older persons. Another result of the expected rapid population ageing is that in the future Myanmar will have far fewer productive age persons per older person to provide support.
As is common elsewhere, women outnumber men in the older ages and especially at the most advanced ages.
Population ageing is occurring throughout most of the developing world. In virtually all countries in Southeast Asia, including Myanmar, not only are the numbers of persons in older ages increas-ing but so is their share of the total population. This latter phenomenon, which is the hallmark of population ageing, started only several decades ago but is virtually certain to continue for decades to come. The balance between major age groups will be radically transformed as steadily increasing life expectancies and lower fertility rates lead to major increases in the share of populations that are in older ages and particularly at the most advanced ages (Nation-al Research Council 2011).
Rapid increases in the numbers of older persons and associated population ageing are often viewed with concern, typically as posing growing burdens of economic support and health care (World Bank 1994). At the same time there is increasing recognition that older persons are also an asset to society (Ananta and Arifin 2009). The United Nations (UN) has been making a concerted effort to place population ageing in a more positive light by encouraging the view of older persons as resources rather than burdens for society. This is reflected in various UN forums, most notably at the Second World Assembly on Ageing in Madrid in 2002 and follow-up meetings that included regional initia-tives, which in the case of East and Southeast Asia resulted in the Macao Plan of Action and the Shanghai Implementation Strategy (Mujahid 2006; United Nations 2002, 2011a). HelpAge International has also called attention both to the needs as well as the contributions of older persons in the developing world (HelpAge 2011). Promoting a “society for all ages” is a common
endorsed by the Myanmar government (Myanmar Delegation 2007).
Limited information is available on the situation of older people in Myanmar. The lack of a national census since 1983 has contributed to the paucity of recent representative information about even their basic characteristics. Two prior reports on population ageing have been issued for Myanmar but they relied largely on data from surveys conducted for other purposes (Depart-ment of Population and UNFPA 2005 and 2012). Consistent with an earlier government recom-mendation for data collection related to older persons (Myanmar Delegation 2007), the Department of Social Welfare of Myanmar’s Ministry of Social Welfare, Relief and Resettle-ment requested assistance from HelpAge Inter-national and UNFPA to conduct the 2012 Survey of Older Persons in Myanmar in multiple regions of the country. This report presents results from this first representative survey of older persons in Myanmar and provides evidence-based knowledge on their needs, concerns and contri-butions that should be helpful in guiding future interventions and policy development on ageing.
In this report, terms such as ‘older population’ or ‘elderly’ are used interchangeably and refer to persons aged 60 years and older. Age 60 corre-sponds to the official retirement age in certain sectors within Myanmar and is also often used as the start of the older age span by the United Nations and other key international organisa-tions when tabulating statistics on older persons. While chronological age is a convenient way to define ageing, it is important to recognise that the elderly age span includes persons at different stages of their lives. Moreover, among persons
Given the absence of a national census in Myanmar since 1983, there is considerable uncertainty about the current size and age com-position of the population. For example, while official estimates indicate the total population in 2010 as 59.8 million and the population 60 and older as 5.2 million, United Nations estimates (medium variant) are considerably lower at 48.0 million and 3.8 million respectively (Depart-ment of Labour 2012; United Nations 2011b). Nevertheless, both sources are reasonably similar with respect to the share of the popula-tion that is 60 and older (8.8% versus 7.9%). The following discussion of the demography of ageing in Myanmar relies on the United Nations assessment (medium variant) because it provides estimates and projections covering an extended period of time. It is important to bear in mind, however, that until results from the census planned for 2014 are available,
popula-tion estimates for Myanmar from whatever source should be considered only tentative.
As Figure 1.1 shows, the number of older persons has been steadily increasing for over half a century in Myanmar. The size of the population 60 and older more than doubled during the 30 years between 1950 and 1980 and almost quad-rupled between 1950 and 2010. Population ageing, as indicated by the percentage of the population in the older age range as distinct from the number of older persons, has also been occurring since the 1960s, although at a rela-tively modest pace with the exception of a dis-tinct uptick between 2005 and 2010. This modest pace of population ageing is due to fact that the rapid expansion of the older population has been accompanied by fairly rapid growth among the overall population.
According to the UN projections, this past slow
Figure 1.1 Population ageing and growth of the older population,
Myanmar 1950-2010 Fig1.1
5.7 5.6 5.7 6.0
6.1 6.2 6.5
6.7 7.0
7.2 7.2 7.3 7.9
2135 2423 2734 3019 3222 3404 3801 2500 3000 3500 4000 5.0 6.0 7.0 8.0 977 1063 1204 1391 1602 1836 2135 0 500 1000 1500 2000 0.0 1.0 2.0 3.0 4.0
1950 1955 1960 1965 1970 1975 1980 1985 1990 1995 2000 2005 2010 Population 60+ as % of total Population age 60+
pace of population ageing is about to change. As seen in Figure 1.2, the uptick in the percentage of the population that is 60 and older observed between 2005 and 2010 is just the beginning of rapid population ageing. In the two decades between 2010 and 2030 the percent-age of those 60 and older will almost double to 15%, and by 2050 persons 60 and older are projected to repre-sent almost one-fourth Source: United Nations 2010 assessment, medium variant (United Nations. 2011b)
60+ as per
cent of total
Population size 60+ (in 1000s)
Not only is the population 60 and older growing faster than the overall population, but within this age range the numbers of those at the most advanced ages are growing even faster. Thus the older population is itself becoming older. Table 1.1 shows the age distribution of the older
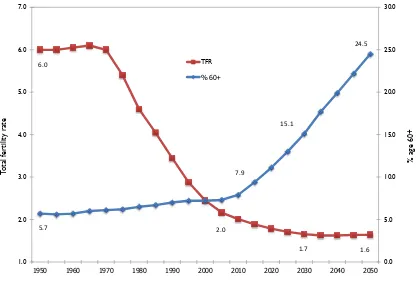
popu-Figure 1.2 Total fertility rate and population ageing, Myanmar 1950-2050
Source: United Nations 2010 assessment, medium variant (United Nations. 2011b) Note: The TFR is the number of births a woman would have if she went through the reproductive years experiencing the fertility rates at each age that prevailed in the year for which the measure is stated.
The main force underlying the projected rapid population ageing in the coming decades is the steep fall in fertility rates that has occurred since the 1970s. In only four decades, fertility as meas-ured by the total fertility rate (TFR) in Myanmar fell from 6 births per woman to just 2 by 2010 and is anticipated to fall even further in the fore-seeable future. This will lead to a shrinking
pro-portion at childhood ages while the propro-portion at old ages expands. Anticipated improving sur-vival rates to and within the older age range will contribute to the growth of older population. According to the 2010 UN assessment, life ex-pectancy is projected to increase from 66 to almost 76 years between 2010–15 and 2045–50.
by the UN between 1970 and 2050. The overall trend shows a reduced proportion of persons in their 60s and increases in the proportions in their 70s and especially in their 80s. This shift is stalled between 2010 and 2030 but is antici-pated to accelerate during the following two Fig1.2
Page 1
0.0 5.0 10.0 15.0 20.0 25.0 30.0
1.0 2.0 3.0 4.0 5.0 6.0 7.0
1950 1960 1970 1980 1990 2000 2010 2020 2030 2040 2050
%
a
ge
6
0+
T
ot
al
Fe
rt
ilit
y
R
at
e
TFR % 60+
2.0 6.0
5.7
7.9
15.1
24.5
1.7 1.6
Total f
er
tility rate
[image:15.595.81.497.267.549.2]changed from 1970 and only slightly lower than projected for 2050. Within the older age range, however, for each year shown the percentage that is women increases with age. Thus in 2010, 60% of persons 80 and older were women and this is projected to be even higher by 2050. The fact that women are more common than men among the older population, sometimes referred to as the ‘feminisation of ageing’, underscores the need to pay attention to those issues that relate to older women. At the same time, it is important to recognise that men constitute a very large share of older persons even among those age 80 and above, and thus gender- specific concerns for older persons of both sexes merit attention.
The changes in fertility and mortality in Myanmar affect not only the share of the popula-tion in older age groups but the entire age struc-ture. Both the magnitude and speed of changes are likely to have substantial socioeconomic im-plications. Figure 1.3 shows the estimated and anticipated changes between 1970 and 2050 in
Table 1.1. Age and sex distribution of persons age 60 and over, 1970 - 2050, Myanmar
% distribution of older persons by age group
Age group 1970 1990 2010 2030 2050
60-69 67.2 63.4 59.8 60.7 52.3
70-79 27.5 29.7 30.7 32.0 34.7
80+ 5.3 6.9 9.5 7.3 13.0
Total percent 100 100 100 100 100
Age group % of age group that is female
60+ 54.9 54.3 54.6 54.8 55.7
60-69 53.7 52.9 52.9 53.3 52.8
70-79 56.7 55.8 56.2 56.3 56.8
80+ 60.5 60.5 59.8 60.8 64.1
three major age groups, 0–14, 15–59, and 60 and over. These correspond roughly to depend-ent children, the working age population, and the older age population, many of whom no longer work. As noted above, the percentage in the older ages increases slowly at first but accelerates after 2005. In contrast, the percent-age of the population in the dependent child-hood ages decreases steadily from1970 through 2050, while the share in the working age popula-tion first increases but starting around 2020 is anticipated to begin a decline.
Table 1.1 also shows the gender composition of the older population ex-pressed as the percent-age that is women. As in all other countries in the region, Myanmar has more women than men among the older population, reflecting the lower female mor-tality rates that pre-dominate throughout the life span. Thus in 2010, 55% of persons 60 and older were
The temporary period during which the per-centage of the popula-tion in the working ages is unusually high is sometimes referred to as a “demographic divi-dend” associated with fertility decline. It is viewed as a time when the economy benefits most from demograph-ic change, provided there are sufficient op -portunities for work, because the number of dependents is low
rela-Figure 1.3. Percentages of total population in major age groups, Myanmar 1950-2050 0 10 20 30 40 50 60 70 80
0-14 15-59 60+ 6.1 41.8 52.1 59.2 24.5 16.2
Source: United Nations 2010 assessment, medium variant (United Nations. 2011b)
tive to the number of providers (Lee, Mason and Park 2011). This period will pass as the share of older persons rapidly increases and more than compensates for the decline in the share of the younger population in dependent ages. Indeed it is anticipated that after 2035, older persons in Myanmar will outnumber those under age 15.
The implications of these trends in the age struc-ture can be conveniently summarised by a common measure referred to as the dependency ratio. It indicates the number of persons in dependent ages (i.e. non-working ages) per 100 persons in productive ages. As in Figure 1.2, the productive ages are considered to be those between 15 and 59 years old while the dependent ages are those outside this range (i.e. children below age 15 and older persons age 60 and older). Obviously, these age ranges only approx-imate the intended groups that are economi-cally productive and unproductive. For example, some persons at the beginning of the productive age range are still in school while some aged 60 and older are still working. Nevertheless, it
the working and non-working populations.
Figure 1.4 shows the trend in the dependency ratio between 2010 and 2050 as projected by the United Nations Population Division. In addition it shows the percentage of the total dependent age population that consists of older persons rather than children. During the next two decades there will be little change in the overall dependency ratio, which will remain at about 50 persons in dependent ages per 100 working age persons. This reflects the fact that the share of the total population that are in working ages will change little, as already documented in Figure 1.3. However, starting around 2030 the UN projections suggest that the overall dependency ratio will increase at an accelerating rate and reach 69 dependent age persons per 100 working age persons by 2050.
Of interest in the context of population ageing is that the share of older persons in the total dependent age population will increase very substantially during the coming decades, from
Per
cent of total population
0 10 20 30 40 50 60 70 80
0-14 15-59 60+
Figure 1.4 Dependency ratio per 100 persons 15-59 and percent of dependency ratio attributable to older persons, Myanmar 1950-2050 fig1.4
50 49 50 51 53 56
59 63 69 38% 44% 49% 53% 57% 60% 40% 50% 60% 70% 50 60 70 80 90 Dependency ratio % due to older persons
Page 1 24% 28% 33% 38% 0% 10% 20% 30% 0 10 20 30 40
2010 2015 2020 2025 2030 2035 2040 2045 2050
Fig1.5 Page 1 2.0 4.0 6.0 8.0 10.0 12.0 14.0 16.0 15.0 20.0 25.0 30.0 35.0 40.0 45.0 Po tent ail s uppo rt ra ti o Me di an ag
e Median age Potential support ratio
18.8
14.5 41.8
3.8
Source: United Nations 2010 assessment, medium variant (United Nations. 2011b) Notes: The dependency ratio is defined as the sum of the number of children (i.e. persons under age 15) plus the number of older persons (i.e. persons 60 and older) per 100 persons inworking ages (i.e. 15-59).
Source: United Nations 2010 assessment, medium variant (United Nations. 2011b)
Dependnecy ratio per 100 persons 15-59
% of dependency due to persons 60+
Figure 1.5 Median age and potential support ratio (population 15-64/65+), Myanmar 1950-2050
Median age Potentail suppor t ratio Fig1.5 Page 1 2.0 4.0 6.0 8.0 10.0 12.0 14.0 16.0 15.0 20.0 25.0 30.0 35.0 40.0 45.0 Po tent ail s uppo rt ra ti o Me di an ag
e Median age Potential support ratio
18.8
14.5 41.8
3.8 Fig1.5 Page 1 2.0 4.0 6.0 8.0 10.0 12.0 14.0 16.0 15.0 20.0 25.0 30.0 35.0 40.0 45.0 Po tent ail s uppo rt ra ti o Me di an ag
e Median age Potential support ratio
18.8
14.5 41.8
3.8
by 2050, while the share that children constitute will decrease correspondingly. Thus, although there will be a decrease in the share of the population that are in dependent childhood ages, the much greater increase in the share that will be older persons will add considerably to the dependency ratio.
The net result of the shifting age structure is a substantial rise in the median age of the population as evident in Figure 1.5. Since 1970 when the median age was less than 20, it has been steadily increasing and is projected to more than double to over 40 by 2050. Another common measure related to popula-tion ageing and shown in Figure 1.5 is the potential support ratio. It is defined as the ratio of the population aged 15–64 to that aged 65 and older. The measure is an approximate indication of the relative size of the support base of persons in economi-cally productive ages and hence available to support those in older ages. A falling potential support ratio reflects a shrinking support
base of adults relative to the old age population. In 1970 the ratio indicates that there were 14.5 persons aged 15–64 for every person 65 and older, and that ratio declines only modestly
Survey description
From March 15 to April 20, 2012, Myanmar Survey Research conducted the 2012 Survey of Older Persons in Myanmar under contract with HelpAge International. The questionnaire cov-ered a wide range of topics relevant to assessing the situation of older persons. The median time to complete an interview was 55 minutes. The survey covered the entire country except Kachin state, which was excluded for security reasons. Multi-staged random sampling resulted in the selection of 4,080 persons aged 60 and above in 60 sample townships. Interviews were con-ducted in 90 urban wards and 150 rural vil-lage tracts within these townships. Households were randomly selected from lists provided by the chairman of the ward or village. The design called for one respondent to be interviewed per household and randomly chosen in those with more than one eligible member.
The sample design also called for a modest over-representation of persons 70 and older in order to enhance the reliability of results for respondents at advanced ages. As a result, the sample consists of 1,960 respondents (or 48%) for the age range 60–69 and 2,120 (or 52%) age 70 and above. However, based on records kept by the survey teams, it was determined that the actual prevalence of the two age strata was 50.7% and 49.3% respectively. Results that refer to the total sample are weighted so that the shares of the two age strata are proportion-ate to their actual share indicproportion-ated in the survey team records. Results are not adjusted for the sample design feature of interviewing one older person per household.
The overall response rate was 92.6%. Most non-response was due to the unavailability of the
entire interview, and in another 6.2% a person other than the designated respondent provided substantial assistance in answering the ques-tions. In about two-thirds of these cases, the person who served as proxy or assisted with the interview was a child or child-in-law. In most of the cases of proxy or assisted interview, the des-ignated respondent was at relatively advanced ages and in 70% was unable or had difficulty to participate in the interview because of health related reasons (illness, hearing difficulty, memory loss, or dementia).
A substantial majority (71%) of the respondents was ethnic Bamar (Burman), and an even larg-er majority (76%) spoke Barmar in their daily lives. Indigenous minorities made up almost all of the rest of sample. The three largest were Rakhine, Kayin (Karen), and Shan making up 8%, 7%, and 6% of the sample respectively. Only 2% of the respondents were non-indigenous minorities (Chinese and Indian). The exclusion of Kachin state and the necessity to make four sample site substitutions likely affects modestly the ethnic composition of the sample.
CHAPTER 2:
Chapter highlights
Just over half of older women are widowed while three-fourths of older men are still married.
The current generation of older persons has an average of over four living children and only 6% are childless. However, falling fertility and lower marriage rates during past decades means that the elderly in the future will have far fewer children and more will be without any children compared to the older generation of today.
About a fourth of the older population received no formal schooling, and only one in eight has more than a primary education. Younger elderly people received more schooling than those of more advanced ages, reflecting the long-term trend towards increased education within the country.
Older women have considerably less education than older men. Over one-third have no formal schooling compared to less than one-tenth of men and are less than half as likely to have progressed beyond the primary level.
Only half of older persons can both read and write with ease, and over one-fourth cannot read or write at all. Problems with literacy are particularly common among the older groups of elderly people, women and rural residents.
Almost all older persons feel that religion is important in their lives, and most pray or meditate on a daily basis. It is also common to attend religious ser-vices, donate money to religious organisations, and among Buddhists, offer food to monks.
While a substantial majority of older persons attended community sponsored ceremonies during the past year and just under half attended a community meeting, very few attended a political meeting or participated in group physi-cal exercise.
Informal social contact with persons outside the household is quite common among older persons: three-fourths report that they socialise with friends, neighbours or nearby relatives on a daily basis.
An elderly person’s marital status has important implications for their well-being. Spouses can be primary sources of material, social and emo-tional support and provide personal care during times of illness or frailty. Thus, living with a spouse typically is advantageous for older The 2012 Survey of Older Persons in Myanmar provides extensive information on the charac-teristics of persons 60 and older in the country. This chapter provides a social profile as reflected
persons. As Table 2.1 shows, almost two-fifths (39%) of Myanmar elders in the sample are widowed and only modestly more than half (54%) are currently married. Only 5% never married and 2% are divorced or separated.
Table 2.1 Marital status distribution by age, gender and area of residence, Myanmar 2012
Single Married separatedDivorced/ Widowed Total
Total 5.2 54.1 1.8 38.9 100 Age
60-64 7.8 69.1 2.3 20.8 100
65-69 4.8 61.5 2.1 31.7 100
70-74 4.4 55.2 1.7 38.6 100
75-79 3.7 38.3 1.7 56.2 100
80+ 3.1 23.9 0.4 72.7 100
Gender
Male 2.7 75.0 1.6 20.7 100
Female 7.0 39.3 1.8 51.8 100
Area of residence
Urban 5.7 53.8 2.2 38.3 100
Rural 5.0 54.3 1.5 39.2 100
Source: 2012 Survey of Older Persons in Myanmar Note: Results are based on household member listing
by marital status, number of living children, education and literacy, religion, social participa-tion and exposure to mass media.
Figure 2.1 Percent currently married, by age and gender, Myanmar 2012
Source: 2012 Survey of Older Persons in Myanmar
% cur
rentl
y mar
ried
Pronounced age and gender differences are apparent, although differences between rural and urban elderly are negligible. The percent-age currently married declines sharply with age while the percentage widowed increases sharply, reflecting the impact of mortality dis -solving marriages and a likely decline in the chances of remarriage with advancing age. The proportions that are single (i.e. never married) declines with age. This is consistent with the trend during previous decades towards declining marriage among reproductive age adults, especially among women, as document-ed by other sources (Department of Population 2009). A similar trend has been observed in numerous other countries in the region (Jones
Figure 2.1 highlights the pronounced gen-der differences in the percentage currently married. Even among the younger elderly in their early sixties a sub-stantial difference is apparent, with 86% of men currently married compared to only 56% of women. However, the relative gender gap increases with age, and among the elderly in their 80s men are almost five times more likely than women to be currently married.
As documented subsequently in this report, adult children remain important providers of material support as well as other forms of
as-2005). The trend of adults of reproductive age to remain single suggests that the never-mar-ried will account for an increasing proportion of the elderly population in the future.
Fully three fourths of elderly men are currently married compared to only about two fifths of elderly women. In sharp contrast, over half of elderly women (52%) are widowed compared to only slightly more than one fifth of men. This gender difference reflects a combination of higher male mortality, a tendency for men to marry women who are younger than themselves and likely higher remarriage rates among men than women in case of marital dissolution.
sistance to their older age parents. At the same time, family sizes of older persons are destined to decline considerably in the future, reflecting
Number of living children
86% 82% 75% 61% 47% 56% 46% 40% 23% 11% 0% 10% 20% 30% 40% 50% 60% 70% 80% 90% 100%
60-64 65-69 70-74 75-79 80+
Men Women 86% 56% 82% 46% 75% 40% 61% 23% 47% 11%
60-64 65-69 70-74 75-79 80+
Figure 2.2 Number of living children among persons 60 and older, Myanmar 2012
6% 7%
11% 14%
16% 15%
12%
9% 9%
0% 2% 4% 6% 8% 10% 12% 14% 16% 18% 20%
0 1 2 3 4 5 6 7 8+
Mean=4.25
4.15
4.36
3.70
4.18
4.33 4.44
2.50 3.00 3.50 4.00 4.50 5.00
60-69 70+ 60-69 70+ 60-69 70+
Total Urban Rural
Overall mean=4.25
mean n
umber of living childr
en
A. Percent distribution
B. Mean number of living children by age and area of residence number of living children
the sharp fertility decline that has already taken place over the last several decades and is pro-jected to continue into the future (as discussed in Chapter 1). The top panel of Figure 2.2 shows the distribution of older persons by the number of their living children, and the lower panel pre-sents the mean number of living children
according to respondents’ age and area of resi-dence.
Overall, persons aged 60 and over in Myanmar have an average of 4.25 living children. Only 6% are childless, over 60% have at least four children and 30% have six or more. Clearly the current generation of older persons has large family sizes. At the same time, it is apparent from the lower panel that the mean number of living chil-dren of persons aged 60−69 is below that of persons 70 and older. Thus the fertility decline that has been taking place in Myanmar is already apparent among the current population of older persons, especially for those who reside in urban areas. Among the urban elder-ly, those in their 60s average almost half a child less than those 70 and older. Still, the fact that even persons in their 60s average more than four children reflects the fact that most of the current genera-tion of older persons had their families prior to the start of the fertility decline.
tribute to increasing childlessness. Hence in the coming years there will be fewer children available to live with (co-reside) and provide support to elderly parents than is the situation today. How this will impact the well-being of the older population will depend on many other changes that will be occurring concomitantly. For example, if there is continuing economic growth, adult children will be financially better off and thus in a better position to provide
ma-terial support. In addition, formal channels of financial support through the government may broaden, reducing dependency on informal support from adult children. Thus the impact of declining family size on the welfare of com-ing generations of older persons in Myanmar remains an important issue to monitor and in-corporate in policy and programme responses to population ageing.
The lack of education and particularly an inabil-ity to read and write fluently can place older persons at considerable disadvantage, impeding their access to important information that influ -ences many aspects of their lives. Table 2.2 provides an overview of the current educational
levels of Myanmar elders. Overall, nearly one-fourth of older persons lack any formal educa-tion, and many others only have monastic schooling or an incomplete primary education.2
Only about one-third have completed formal primary schooling or higher education.
2 The monastic educational system in Myanmar dates back centuries (Wikipedia 2012). In the context of the current older popu- Table 2.2 Educational attainment by age, gender and area of residence, Myanmar 2012
Notes: Middle school includes all with at least some middle school education regardless of whether completed. A small number of respondents with other types of education are excluded.
Source: 2012 Survey of Older Persons in Myanmar
None schoolingMonastic Incomplete primary Complete primary Middle school
Beyond middle
school Total
Total 24.0 28.9 15.7 14.6 9.3 7.5 100
Age
60-64 15.9 24.7 19.2 20.4 8.6 11.2 100
65-69 17.7 24.0 19.2 15.7 13.5 9.8 100
70-74 28.0 31.7 12.5 12.1 9.2 6.6 100
75-79 32.3 35.8 11.3 10.9 6.7 3.0 100
80+ 34.8 33.7 12.4 9.4 6.9 2.7 100
Gender
Male 7.5 41.5 11.2 15.0 12.5 12.3 100
Female 36.5 19.4 19.1 14.4 6.8 3.9 100
Area of residence
Urban 16.2 18.5 15.0 13.9 17.8 18.6 100
Rural 27.4 33.5 16.0 15.0 5.5 2.6 100
Percent distribution
Substantial differences in education are ap-parent with respect to age, gender and area of residence. The educational distribution pro-gressively shifts towards the lack of any edu-cation with each successive age group. The percentage with no formal education increases from 16% among those in ages 60−64 to over a third among those 80 and older. Moreover, the proportion receiving only monastic schooling generally increases with age. Even among the youngest elders, i.e. persons aged 60−64, only one-fifth have educational levels beyond pri -mary school while among those 80 and older, less than one-tenth have achieved such an edu-cational level.
Gender differences in education among the older age population are also pronounced. Men are much more likely than women to have re-ceived some formal education. Monastic edu-cation also clearly favoured men over women. Moreover, men were much more likely than
women to study beyond the primary level, al-though even for men the percentages that did so are quite low. The urban elderly are clearly bet-ter educated than those in rural areas, with over a third of urban elders being educated beyond the primary level compared to less than 10% of those in rural areas.
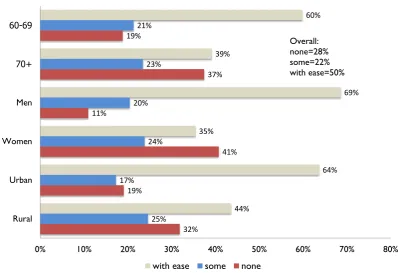
[image:27.595.88.487.476.749.2]While educational levels and literacy are close-ly correlated, some older persons who went to school have forgotten how to read and write, and some with little or no education have ac-quired literacy through other means. Figure 2.3 indicates that overall among persons 60 and older, half could both read and write with ease but that this ability varies considerably accord-ing to age, gender and area of residence. The younger elderly are more likely than those at more advanced ages to be fully literate, while men are twice as likely as women and the urban elderly are substantially more likely than rural elderly to have this ability.
Figure 2.3 Ability to both read and write, by age, gender and area of residence, Myanmar 2012
number of living children
32% 19%
41% 11%
37% 19%
25% 17%
24% 20%
23% 21%
44%
64% 35%
69% 39%
60%
0% 10% 20% 30% 40% 50% 60% 70% 80%
Rural Urban Women Men 70+ 60-69
The vast majority (95%) of respondents adhere to Buddhism. The remainder is divided among Christian (3.2%), Moslem (1.2%) or Hindu (0.6%). Among Buddhists, 75% are ethnic Burman (Bamar) and virtually all the rest belong
Figure 2.4 Importance of religion in daily life, by age, gender and area of residence, Myanmar 2012
Figure 2.5 Religious practices among persons 60 and older, Myanmar 2012
84% 87% 84% 87% 86% 85%
14% 11% 14% 12% 12% 13%
0% 10% 20% 30% 40% 50% 60% 70% 80% 90% 100%
60-69 70+ Men Women Urban Rural
Very important Moderately important
77%
95%
56%
76% 76%
90%
0% 20% 40% 60% 80% 100%
daily at least once at least weekly at least once offered food to
monks at least monthly*
gave money
Prayed or meditated in past month Attended religious service in past Religious donations in past year
Source: 2012 Survey of Older Persons in Myanmar
to indigenous minorities. In contrast, among non-Buddhists, religion is clearly associated with ethnicities other than Burman. For example, among the Christians, all but 8% be-longed to an indigenous minority group. In
con-trast, three-fourths of Islamic respondents and over 90% of Hindu respondents were of non-indigenous ethnic-ity (Chinese or Indian).
As Figure 2.4 shows, virtually all older persons in Myanmar consider religion to be important, and well over 80% consider reli-gion to be very impor-tant. Moreover, there is very little variation ac-cording to age, gender or area of residence. Clearly religion plays a central role in the lives for almost all Myanmar elders.
The importance of reli-gion is reflected in the information gathered concerning religious practices. As Figure 2.5 reveals, over three-fourths of older persons in Myanmar prayed or meditated daily during the past month and fully 95% did so at least
Several items were included in the survey ques-tionnaire concerning participation in organised community activities as well as informal social contact with friends or neighbours and non
co-Source: 2012 Survey of Older Persons in Myanmar
attended a religious service during the last month, with over half attending at least weekly and just over three-fourths attending at least one time. Among Buddhists, the custom of offering food to monks was also widespread, just over
three-fourths having offered food to monks at least monthly during the past year. Among all elderly it was very common to give at least some money to religious organisations; 90% did so during the past year.
resident relatives who live nearby. Table 2.3 shows the frequency with which older persons participated during the past year in four types of organised community activities: attending
com-Table 2.3 Community participation during past year, persons 60 and older, by age, gender and area of residence, Myanmar 2012
Total
60-69 70+ Men Women Urban Rural
Attend community or religious ceremonies
never 21.5 15.3 28.0 19.5 23.1 22.1 21.3
occasionally 57.2 60.6 53.7 59.2 55.6 54.6 58.3
at least monthly 21.3 24.1 18.3 21.3 21.3 23.2 20.4
total 100 100 100 100 100 100 100
Attend community meetings
never 52.3 39.5 65.6 32.5 67.3 57.1 50.3
occasionally 36.5 45.6 27.1 48.3 27.7 32.6 38.2
at least monthly 11.2 14.9 7.3 19.3 5.1 10.3 11.5
total 100 100 100 100 100 100 100
Participate in political meetings or events
never 90.5 87.9 93.1 86.8 93.2 89.3 91.0
occasionally 9.0 11.2 6.6 11.9 6.7 9.8 8.6
at least monthly 0.6 0.8 0.3 1.3 0.0 0.9 0.4
total 100 100 100 100 100 100 100
Do group physical exercise
never 96.1 96.1 96.2 94.6 97.3 94.4 96.9
occasionally 2.5 2.5 2.4 3.4 1.7 3.5 2.0
at least monthly 1.4 1.4 1.4 1.9 1.0 2.1 1.1
Age Gender Area of residence
munity or religious ceremonies, attending com-munity meetings, participating in political meet-ings or events, and doing group exercise. Questions were not asked, however, as to whether such activities were regularly held in their location, and thus the lack of participation may reflect the absence of such activities rather than a lack of interest in participating.
Clearly among those activities shown, participa-tion is most frequent with respect to attending community or religious ceremonies. Almost 80% of respondents indicated they participated at least occasionally in such activities. Persons in their 60s were somewhat more likely to attend than persons 70 and older, but differences with regards to gender and area of residence are quite modest. Attending community meetings is the second most common activity among the four shown; but even so, slightly more than half of respondents indicated they never participated in such an activity. In contrast to the pattern for attending ceremonies, differences in attending
The low proportion participating in such activi-ties likely reflects the fact that in a number of communities these activities did not take place. Our data, however, do not permit verifying this.
The extent of informal social contact is shown in Figure 2.6. Almost two-thirds of older persons in Myanmar socialise with friends or neighbours at least weekly and almost half on a daily basis. Less common is socialising with relatives who live nearby. About a third socialise at least weekly with siblings who live nearby as well as with adult grandchildren and somewhat less than half with other relatives who live nearby. At the same time, fully three-fourths of older persons socialise daily with any of these groups – friends, neighbours or nearby relatives. The vast majority of them do so weekly. The lower rates of socialising with relatives compared to friends or neighbours are attributable to the fact that in many cases respondents had none living nearby. For example, with respect to siblings and adult grandchildren, over half of respond-community meetings
according to both age and gender are quite striking: younger elders and men considerably more likely to attend such meetings.
Participation in politi-cal meetings or events as well as doing group physical exercise is quite uncommon, with 90% or more indicating they never did these ac-tivities during the past year. This is true re-gardless of age, gender
Figure 2.6 Social contact with friends, neighbours and relatives who live nearby among persons 60 and older, Myanmar 2012
47%
27% 27% 33%
75% 17%
7% 5%
13%
12%
0% 10% 20% 30% 40% 50% 60% 70% 80% 90% 100%
Friends or neighbors Siblings Adult grandchildren Other relatives Any of these
Daily Only weekly
64%
34% 32%
46%
Figure 2.7 Exposure to mass media during the past month among persons 60 and older, Myanmar 2012
6%
32%
23%
8%
48%
4%
7%
9%
7%
12%
13%
15%
14%
59%
29%
0% 10% 20% 30% 40% 50% 60% 70% 80% 90% 100%
Newpapers or
magazines Radio Television Public speaker At least one
Daily Weekly A few times
55%
46%
74%
90%
23%
Source: 2012 Survey of Older Persons in Myanmar ents have none living nearby and almost half
have no other relatives nearby. If this is taken into account, socialising with each of these types
Mass media serve as important sources of infor-mation as well as entertainment depending on the type. Figure 2.7 indicates the frequency with which respondents were exposed to four differ-ent types of mass media during the past month: newspapers or magazines, radio, television and public speaker announcements. Having at least some exposure is highest with respect to public speaker systems and lowest with respect to newspapers or magazines. Overall, 90% of older persons were exposed to at least one of these sources during the past month, and almost half had daily exposure to at least one of these sources. Daily
expo-sure is far more common with respect to radios and televi-sion than for reading newspapers or maga-zines or listening to announcements on public speakers.
Exposure to mass media depends on their availability and the ability of the older person to have access. Both the inability to read and the lack of access to newspapers or magazines restrict
the share of the older population that is exposed to information through these media. As indi-cated in Chapter 4, only half of the respondents had a radio in their household and even fewer had a television. In such cases the older person would need to depend on others in the commu-nity to provide access. In addition, as indicated in Chapter 7, vision and hearing problems are not uncommon among the older-age population and are likely to impede exposure to radio and television. Thus there are numerous barriers for older persons in Myanmar to keep informed through the mass media.
of relatives, provided they live nearby, is fairly frequent (not shown in Figure 2.6).
CHAPTER 3:
Chapter highlights
The vast majority of older men and older women worked during their lifetime. The majority were engaged in agriculture, primarily as farmers, reflecting the predominantly rural nature of Myanmar.
In contrast to high levels of lifetime work, just under 30% of persons 60 and older were still economically active during the 12 months prior to the interview.
Among those who worked during the past year, only about half did so through-out the year, whereas others worked on a seasonal basis. Moreover, abthrough-out half of those who worked indicated that they worked less than they had earlier in their lives.
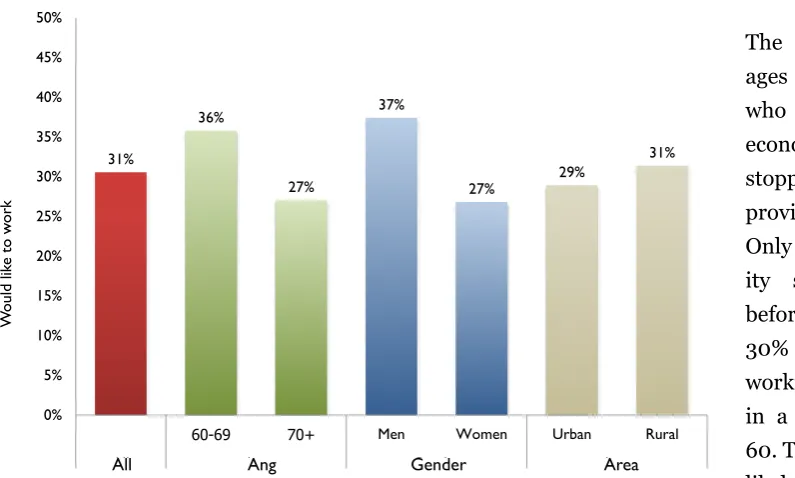
Most older persons who did not work in the previous year said they were satisfied that they were no longer economically active. Still, almost a third said that they would like to work.
Persons who had been employees in the formal sector were distinctly less likely to have worked in the previous year.
Among those who no longer worked, farmers reported stopping work at the oldest age (62) and formal sector employees reported the youngest age (59).
Only a small share of older persons (7%), limited to mainly to urban residents, reported that they or their spouse received a pension; less than 3% indicated that a pension was their main source of support.
Over 80% of older persons reported receiving some material support (income or goods) from adult children, and three-fifths cited children as their main source of support. Work was the second most common main source of support but accounted for only modestly more than one-fifth of older persons.
The importance of children as the main source of support increases rapidly with age among older persons as the importance of work declines.
Compared to older persons who have children, the small proportion with no living children are more likely to depend on work as their main source of support, but even more commonly their main support comes from other family members.
As Table 3.1 shows, the vast majority of persons 60 and older have been economically active during their lives. This differs little between those in their 60s and those 70 and older. Among men, economic activity was virtually universal, but even among women 90% had worked during Older age is typically a time when most persons disengage from their own economic activity and need alternative sources of income and material support. In some cases cessation of work is abrupt and associated with a compulsory retire-ment age. For example, the official retireretire-ment age in Myanmar is 60 for the military and gov-ernment workers (Department of Population and UNFPA 2012). For the majority of the popu-lation that is engaged in agriculture or the infor-mal sector of the economy, however, the concept
Source: 2012 Survey of Older Persons in Myanmar
Notes: Farmers are engaged in agriculture on their own or rented property while agricultural labourers work for wages doing agricultural work for someone else. Own-account workers are self-employed and either have a small business such as being an informal vendor or run a small home-based store or engage independently in a profession or trade and hire no employees.
of a discrete point at which retirement occurs is more ambiguous and often occurs in a progres-sive reduction of activity. Even among those who must leave their job at some specific age, retire -ment does not necessarily mean cessation of economic activity, as they can still find alterna -tive work with no compulsory retirement age. Still, for a variety of reasons including changes in physical strength and health, most persons in Myanmar disengage from economic activities as they progress to advanced ages.
their lifetime, even though the definition of eco -nomic activity in the survey did not include housework. Rural residents reported modestly higher levels of economic activities during their lifetime than urban residents.
Table 3.1 Lifetime economic activity, by age, gender and area of residence, Myanmar 2012
Total
60-69 70+ Men Women Urban Rural
Among all respondents
% that ever worked 93.8 93.7 93.9 99.4 89.6 89.8 95.5
Among respondents that ever worked Main lifetime occupation (% distribution)
farmer (incl. livestock) 52.3 49.2 55.5 57.0 48.4 20.8 65.2
laborer in agriculture 6.6 7.2 5.9 5.5 7.5 2.0 8.4
laborer outside agriculture 10.2 11.8 8.6 9.7 10.6 12.1 9.5
own-account worker 18.3 18.1 18.5 8.1 26.9 33.8 12.0
employee (incl. govt.) 9.9 11.0 8.8 16.8 4.2 25.7 3.4
other 2.7 2.6 2.7 2.9 2.4 5.7 1.4
Total 100 100 100 100 100 100 100
Age Gender Area of residence
Figure 3.1 Percent that worked during the past year, by age and gender, Myanmar 2012 49% 37% 23% 12% 5% 64% 49% 35% 19% 8% 36% 28% 13% 7% 4% 0% 10% 20% 30% 40% 50% 60% 70% All Men Women All 60+ = 29%
Source: 2012 Survey of Older Persons in Myanmar
W
ork
ed last y
ear
60-64 65-69 70-74 75-79 80
Just over half of all older persons who had been economically active during their lifetime re-ported that their primary work was as a farmer working their own or rented land.3 Farming
as the main lifetime occupation was modestly lower among the younger compared to the old-er eldold-erly as well as among men compared to women. As would be expected the difference between urban and rural elderly with respect to farming is very pronounced, with almost two-thirds of those residing in rural areas reporting farming as their main lifetime occupation com-pared to only about one-fifth of urban elderly. If agricultural labourers (i.e. those who work for wages doing agricultural work for others) are combined with farmers, almost 60% of older persons in Myanmar who had been
In contrast to the very high levels of lifetime economic activity, only 29% of the population 60 and older was eco-nomically active during the 12 months prior to the interview. Figure 3.1 shows how the per-centages that were active during the past year decline very rapidly with age. While almost half of persons aged 60−64 had worked during the past year, only 5% of those aged 80 and above did so. Sharp declines with age characterise both men
cally active during their lifetime were primarily engaged in agriculture. As with farming, differ-ences in the percentage who reported agricul-tural labour as the primary lifetime occupation are most pronounced between rural and urban residents. At the same time, non-agricultural labour was the main occupation of 10% of those who had been economically active. Although this occupation is more common for urban than rural residents, the difference is less pro-nounced than in the case of agricultural labour. Women were much more likely than men to re-port they were own-account workers (informal vending and house-based shops), likely reflect -ing a tendency for women to sell food or other things through such means.
3 A small number of persons who raised livestock as their primary occupation are included with the farmers.
and women, although at every age women are proportionately much less likely than men to have been engaged in work (excluding house-work) in the previous year.
Table 3.2 further examines economic activity during the past year of the older population. Besides the contrasts by age and gender de-scribed above, the percentage economically
active during the past year is higher among rural than urban elderly. This reflects the tendency to remain economically active longer into life among persons engaged in agriculture, where retirement is more likely to be a gradual process and not subject to a prescribed retirement age in contrast to many types of formal sector work more common in urban areas.
Source: 2012 Survey of Older Persons in Myanmar
Note: (a) includes a small number of who responded they worked only one to two months.
Table 3.2 Economic activity during past year, by age, gender and area of residence, Myanmar 2012
Total
60-69 70+ Men Women Urban Rural
Among all respondents
% worked in past year 29.1 44.0 13.8 41.7 19.7 21.7 32.3
Among respondents that worked during past year Current occupation (% distribution)
farmer (incl. livestock) 52.4 51.8 54.5 60.0 40.3 23.1 61.0
laborer in agriculture 5.1 5.4 4.0 4.1 6.5 1.1 6.2
laborer outside agriculture 13.6 14.2 11.9 14.0 13.1 12.7 13.9
own-account worker 22.4 22.6 21.7 13.7 36.2 47.8 15.0
employee (incl. govt.) 3.8 3.5 4.7 5.3 1.3 9.0 2.3
other 2.7 2.5 3.2 2.9 2.6 6.3 1.6
total 100 100 100 100 100 100 100
Duration of work (% distribution)
throughout year 56.5 57.4 53.6 54.9 59.0 71.0 52.2
only seasonally(a) 43.5 42.6 46.4 45.1 41.0 29.0 47.8
total 100 100 100 100 100 100 100
Amount of current work compared to when in 50s (% distribution)
less 51.3 49.1 58.8 52.1 50.2 55.4 50.1
about the same 41.6 43.0 36.8 41.5 41.7 37.5 42.9
more 7.1 7.9 4.3 6.4 8.1 7.1 7.1
total 100 100 100 100 100 100 100
Overall, the distribution of the main occupa-tions among those who worked during the past year differs only modestly from that during the lifetime. The main exception is the percentage for employees, which was much less likely to be mentioned as main occupation during the past year than during the lifetime. This low percent-age is likely associated with the fact that com-pulsory or at least standard retirement ages are associated with formal sector employment. As with lifetime employment, over half of older persons who worked during the previous year were associated with agriculture, mainly as farmers but also to a small extent as agricultural labourers.
Among those who worked in the past year, just over half did so regularly throughout the year.
The remainder worked only on a seasonal ba-sis. Differences in this respect are minor by age or gender but considerably more substantial by area of residence, reflecting the fact that season -al work is more common in rur-al areas, where it often corresponds to the agricultural cycle, than in urban areas, where non-agricultural work predominates.
Just over half of older persons who were eco-nomically active indicated that the amount they worked during the prior year was less than the amount they worked earlier in their lives, using the reference point of their 50s. While this dif-fered little by gender, those in more advanced ages as well as those in urban areas were more likely to say that their current work amount was less than their previous work.
differs only modestly between urban and rural residents.
The distribution of ages at which persons who were previously economically active stopped working is provided in Table 3.3. Only a small minor-ity stopped working before age 50. Almost 30% who are no longer working stopped with-in a few years of age 60. To some extent this likely reflects manda -Figure 3.2 Percent that would like to work among those who did not
work in last year, by age, gender and area of residence, Myanmar 2012
31%
36%
27%
37%
27% 29%
31%
0% 5% 10% 15% 20% 25% 30% 35% 40% 45% 50%
60-69 70+ Men Women Urban Rural
All Age Gender Area
W
ould lik
e to w
ork
Respondents who had not worked during the past year were asked if they were satisfied with not working or whether they would like to work.
All Ang Gender Area
As Figure 3.2 shows, just under a third indicated that they would prefer to work. This is higher among the younger elderly and among men but
[image:38.595.52.450.498.737.2]Table 3.3. Age when stopped working among persons who ever worked, by gender and area of residence, Myanmar 2012
Total
Men