2018 3rd International Conference on Computational Modeling, Simulation and Applied Mathematics (CMSAM 2018) ISBN: 978-1-60595-035-8
A Parameter Estimation of Fractional Order Grey Model
Based on Adaptive Dynamic Cat Swarm
Optimization
Bin-yan LIN, Fei GAO
*, Meng WANG, Yu-yao XIONG and An-sheng LI
Department of Mathematics, School of Science, Wuhan University of Technology, Wuhan 430070, China
*Corresponding author
Keywords: ADCSO, Fractional Order Grey Model, Parameter estimation.
Abstract. In this paper, we utilize ADCSO (Adaptive Dynamic Cat Swarm Optimization) to estimate
the parameters of Fractional Order Grey Model. The parameters of Fractional Order Grey Model affect the prediction accuracy of the model. In order to solve the problem that general swarm intelligence algorithms easily fall into the local optimum and optimize the accuracy of the model, ADCSO is utilized to reduce the error of the model. Experimental results for the data of container throughput of Wuhan Port and marine capture productions of Zhejiang Province show that the different parameter values affect the prediction results. The parameters estimated by ADCSO make the prediction error of the model smaller and the convergence speed higher, and it is not easy to fall into the local convergence compared with PSO (Particle Swarm Optimization) and LSM (Least Square Method). The feasibility and advantage of ADCSO for the parameters estimation of Fractional Order Grey Model are verified.
Introduction
Recently, there has been growing interest in the area of the parameters estimation of grey system to improve the predictive accuracy[1-4]. Wu, Wang, C.H and Meng, et al respectively have defined fractional order accumulating operators according to Taylor series expansion[5-8], binomial coefficients[9], Gamma function[10], etc. to reduce the perturbation of the forecasting model and promote the stability, and obtain higher accuracy of prediction. The model has been successfully applied in many disciplines to deal with the uncertainty of the system model and incomplete information cases[11-13]. Although considerable research has been devoted to integer order grey model, little attention has been paid to optimize the parameters of the fractional grey system.
There have been many studies utilizing LSM (Least Square Method) to estimate the parameters of the grey model. But LSM aims to minimize the sum of square deviation instead of average relative error, thus the average relative error cannot reach the minimum. Therefore, more scholars have proposed other algorithms to estimate parameters of the integer order grey model to improve the accuracy of model. Zheng, et al. used Genetic Algorithm to estimate the parameters in the case that optimization function is to minimize the average relative error[14]. He, et al. tried linear programming model to estimate parameters[15]. Zhang optimized the background value and boundary value of the grey model and greatly improved the precision of parameters by Particle Swarm Optimization[16]. However, most intelligent algorithms are easily trapped in local optimum.
Cat Swarm Optimization (CSO) is a new swarm intelligence algorithm proposed by Chu, et al[17, 18]. This algorithm has been applied in many fields such as parameter estimation of nonlinear model[19, 20], path planning, image clustering[21, 22] and linear antenna array[23] etc. due to its better local and global searching ability and faster convergence speed.
This paper is organized as follows. In Section 2, the fractional order grey model is discussed. In Section 3, the Adaptive Dynamic Cat Swarm Optimization is described. In Section 4, the advantage of utilizing ADCSO to estimate the parameters is clarified by two cases. Finally, Section 5 describes the concluding remarks of this work.
Grey System Theory and Grey Model
The forecasting model GM (1,1) is one of the most common models in grey system theory. Essentially, GM (1,1) accumulates the original data sequences in order to minimize the influence from random interfering factors, then simulate the trend with exponential curve and find the parameters of the model by least squares estimation or other methods. Therefore, in some way the model can be denoted as an exponential simulating model based on accumulation and Least Squares Method. Compared with traditional GM (1,1), fractional order accumulating grey model is able to reduce perturbation of the prediction model and enhance the stability[5-8], which can provide higher accuracy of prediction.
Discrete Grey Model Based on Fractional Order Accumulation
Let the original sequence be:
(0) (0) (0) (0)
( (1), (2), , ( ))
X n . (1) Then the r-order accumulation generating sequence is as follows:
( ) (0)
1
( )
( ) ( )
( 1) ( )
k r
i
r k i
k i
k i r
. (2) 1, 2, ,k n.
And the r-order reduction generating sequence is as follows:
1
( ) (0)
0
( 1)
( ) ( 1) ( )
( 1) ( 1)
k
r i
i
r
k k i
i r i
. (3) 1, 2, ,k n.
Similarly, its nearby mean accumulation generating sequence is:
( ) 1 ( ) ( )
( ) ( ( ) ( 1))
2
r r r
k k k
. (4)
2,3, ,
k n.
The r-order accumulating grey model has following definition:
( ) ( ) ( )
( ) ( 1) ( )
r r r
k k a k b
. (5) 2,3, ,
k n.
as to r-order accumulating grey model.
And the whitenization differential equation is:
( ) ( ) ( ) ( ) r r d t
a t b dt
. (6)
then the time response sequence of r-order GM (1,1) is:
( ) (0)
( 1) ( (1) )
ˆr b ak b
k e
a a
. (7)
1, 2, , 1
k n .
(0 (0)
(1)
ˆ (1)
)
1
(0) ( ) ( )
1
ˆ ( 1)
( ) ( ) ( ) ( 1) ( )
( 1) (
ˆ ˆ
1)
k
r r i r
i
r
k k k i
i r i
. (8) wherek2,3, ,n[25].As the parameters A[ , ]a bTof the fractional order grey model directly influence the utility of the model, the estimation of parameter act as an important role in improving the simulating performance of the model. There have been various studies concerning parameter estimation by LSM assuming the data are characterized by normal distribution. But grey model mainly aims to predict small sample data whose characteristics are scarcely distinct and there may be isolated point. As a result, it is not easy to distinguish abnormal value when using least squares estimate, which may finally lead to moderate interference in parameter estimation. For all the reasons above, we estimate the parameters by Adaptive Dynamic Cat Swarm Optimization (ADCSO).
Adaptive Dynamic Cat Swarm Optimization
Cat Swarm Optimization is a swarm intelligence algorithm based on cat behavior and swarm intelligence[17, 18]. The algorithm has two modes: Seeking mode and tracing mode. And cats are grouped randomly with a certain mixture ratio to find the best position.
In order utilize ADCSO to estimate the parameters of Fractional Order Grey Model, we set up a fitness function describing in (9).
0 0 2 0 ˆ | ( ) ( ) | 1 ( , )
1 ( )
n
k
X k X k
f a b
n X k
. (9)Then the problem becomes a nonlinear optimization problem, and the goal is to minimize the fitness function. 0 0 2 0 ˆ | ( ) ( ) | 1
min ( , )
1 ( )
n
k
X k X k
f a b
n X k
. (10)The two modes of ADCSO are described below:
Seeking Mode
Cats have a strong curiosity of moving things, but most of the time they are inactive. They are always alert, and always on guard even when resting[17]. This sub mode is to describe the situation of resting cats which are looking around for next move.
Seeking mode has four general definitions described below:
Seeking memory pool (SMP): define the size of seeking memory of each cat, which indicates the solution space of the parameters of Fractional Order Grey Model. The value of SMP will not be affected by other parameters.
Seeking range of the selected dimension (SRD): define the mutative ratio for the selected dimensions.
Counts of dimensions to be changed (CDC): define the counts of dimensions to change, and its value is between 0 to D, where D is the total dimension.
Self-position considering (SPC): SPC is a Boolean variable, which decides whether the cat will retain the present position as one of the candidates[18].
The process of the seeking mode can be described as follow[18, 24]:
Step1: Make K copies of the present position of the cati, i1, 2, ,N, where K=M and M is the
Step2: For all positions of seeking memory pool { }xij Mj1,i1, 2, ,N, according to the SRD and
CDC, randomly plus or minus (mutative ratio defined by SRD) percent of the present values and then obtain the new position by (11).
| |
j j j
i i i
x x x , where
j
1, 2, ,
M
. (11) Step3: Calculate the fitness of all candidate positions.Step4: Let each candidate position the same probability, if the fitness of all the candidate positions are exactly equal. Otherwise, calculate the probability of each candidate position by (12).
max max min | | | | ij j f f P f f
, where
j
1, 2, ,
M
. (12)Step5: The candidate position with the highest probability is the position the going to move. Then update the cati’s old position with new position, and get new value of parameters.
Tracing Mode
Although cats are mostly resting, their tracing skills are inherent. Based on that, the other sub mode is to describe the situation of tracing targets and food. In this mode, cats move to the new position quickly[17].
The process of the tracing mode[18] can be described as follow: Step1: Update the velocities for every dimension by (13)[24].
,
( )
id d id d best d id
v v r c x x . (13)
where d 1, 2, ,D, i1, 2, ,N.
[0,1]
r U .
id
v is the dthdimension velocity of cati.
id
x is the dthdimension position of cati.
d
c is the adaptive acceleration coefficient and c0 is the initial acceleration coefficient which is usually equal to 2.05.
0 2 d D d c c D
, where d 1, 2, ,D.
d
is the adaptive inertia weight and is the initial inertia weight which is usually equal to 0.6.
0 2
d
D d D
, where d 1, 2, ,D.
Step2: Check if the updated velocity videxceeds the preset velocity range [vmin,vmax].
min min min max max max [ , [ , ] ( , ] id
id id id
id
v v v
v v v v v
v v v
. (14)
Step3: Update the position of catiby (15).
id id id
x x v , where d 1, 2, ,D. (15)
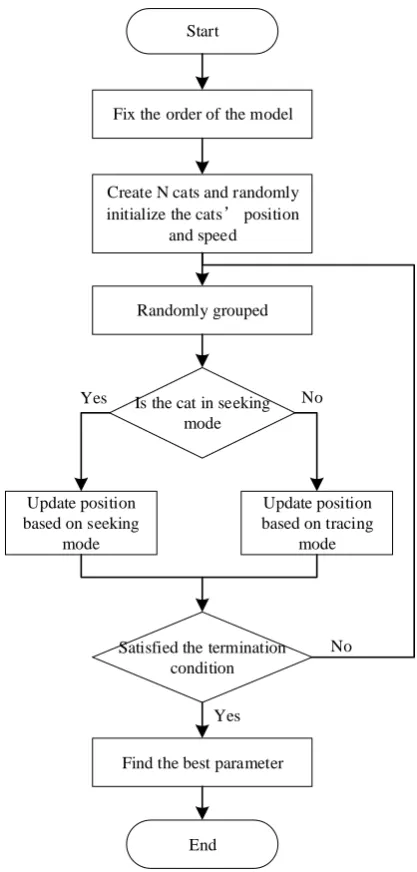
Core Description of ADCSO
Start
Create N cats and randomly initialize the cats position
and speed
Is the cat in seeking mode Randomly grouped
Update position based on seeking
mode
Update position based on tracing
mode
Satisfied the termination condition
End Yes
No
Yes No
Fix the order of the model
[image:5.595.182.391.68.505.2]Find the best parameter
Figure 1. The process of ADCSO.
Step1: Create N cats and randomly initialize the cats’ positions, velocities and the flags for cats[24]. Then we obtain the initial solution space of the parameters of Fractional Order Grey Model.
Step2: Divide the N cats into two groups (seeking group and tracing group) with a certain mixture ratio (mr) randomly.
Step3: Calculate the fitness value of each cat and keep the best cat into memory. And remember the position of the best cat, for it represents the best parameters of Fractional Order Grey Model so far. Step4: Set the cats into seeking process or tracing process according their flags. If the cat is in tracing mode, set the cat into tracing process, otherwise set it into seeking process.
Step5: Check whether the parameters satisfy the termination condition, if satisfied, terminate the program, otherwise return to Step2. The process is shown on Figure 1.
Experiments on Numerical Optimization
Prediction for Wuhan Port’s Container Throughput
Table 1. Wuhan Port’s container throughput.
Year 2011 2012 2013 2014 2015
throughput 714700 765000 860412 1005200 1061400
Parameter settings for CSO and PSO are shown in Table 2 and Table 3.
Table 2. Parameter settings for CSO.
Parameter N M (SRD) mr c w Itermax
Range 40 30 0.2 0.2 1.05 0.6 300
Table 3. Parameter settings for PSO.
Parameter N c1 c2 w Itermax
Range 40 1.5 1.5 0.7 300
[image:6.595.63.521.343.589.2]CSO and PSO are both kinds of swarm intelligence algorithm, so there exist differences among the results when using them. In order to evaluate the estimation of the two algorithms more objectively, we tested each for ten times and take the average of their results. Then put them into comparison, which is shown below.
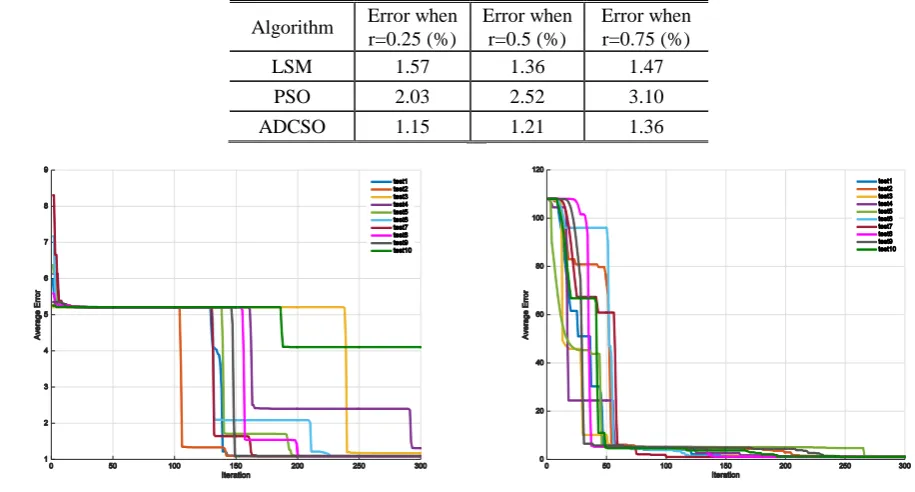
Table 4. Comparison among the three algorithm’s results of data in Table 1.
Algorithm Error when r=0.25 (%)
Error when r=0.5 (%)
Error when r=0.75 (%)
LSM 1.57 1.36 1.47
PSO 2.03 2.52 3.10
ADCSO 1.15 1.21 1.36
Figure 2. The iteration figure of PSO of r=0.21. Figure 3. The iteration figure of ADCSO of r=0.21.
We can see from Table 4, Figure 2 and Figure 3 that the prediction effect of ADCSO is relatively smaller than others of each order. LSM uses linear approximation to process the data, which leads to a considerable error. PSO sometimes can get decent prediction, but the algorithm is unstable. It often plunges into a local optimum in the calculation process, thus it causes larger average error. Therefore, with higher fitness and faster convergence, CSO is a better algorithm to deal with this type of problem.
Besides, since the order of fractional grey model affects the model performance, we set the step size to 0.01, using ADCSO to optimize the order between 0 and 1, and get the best order r=0.21. And the estimated value of parameters for this set of data are
Prediction for Marine Capture Productions in Zhejiang Province
[image:7.595.63.539.266.513.2]We also collected the data about marine capture prod-uctions in Zhejiang Province during 2007-2013[13], which is shown in Table 5.
Table 5. Marine capture productions in Zhejiang Province during 2007-2013.
Year 2007 2008 2009 2010 2011 2012 2013
productions 3210300 327230 0
315230 0
327910 0
341120 0
347460 0
360670 0
After building the fractional order grey model, we used the three algorithms mentioned above again to make a prediction. The parameter settings are the same as Table 2 and Table 3. And the results are shown below.
Table 6. Comparison among the three algorithm’s results of data in Table 5.
Algorithm Error when r=0.25 (%)
Error when r=0.5 (%)
Error when r=0.75 (%)
LSM 2.328 3.0196 2.826
PSO 2.048 3.081 4.785
ADCSO 1.485 2.151 2.158
Figure 4. The iteration figure of PSO of r=0.25. Figure 5. The iteration figure of ADCSO of r=0.25.
By analyzing the information in Table.6, Figure.4 and Figure.5, we can get similar conclusions to the optimization experiment in 4.1. And the estimated value of parameters in this experiment are
r=0.06, a=-0.0409, b=3788.
Conclusion
In order to estimate the parameters of fractional order grey model to improve the accuracy of the model, the paper has utilized ADCSO to optimize the parameters. Compared with some algorithms (LSM and PSO), we have found that the parameters estimated by ADCSO are more stable and can jump out of the local optimum to arrive near optimum solution quickly. Meanwhile the convergence speed of ADCSO is also higher. The fractional order grey model with optimized parameters can be widely used in small sample prediction in various industries for its higher accuracy. Similarly, ADCSO can be widely used to estimate the parameters of nonlinear systems to improve the accuracy of the systems.
Acknowledgements
This work is supported by the 2018 National Students’ Platform for Innovation and Entrepreneurship Training Program.
References
[1] Wang, X. and J. Wang, Objective Programming of Parameters Estimation in Grey GM (1,1) Model. Journal of Qingdao University, 2002. 15(02): pp. 48-50.
[2] He, X. and W. L, Comparison of Several Methods for Parameter Estimation in Grey GM (1,1) Model. Statistics and Decision, 2011(20): pp. 22-24.
[3] Deng, J.L, Grey System Theory Course. Wuhan: Huazhong University of Science and Technology Press, 1990.
[4] Mu, Y., Optimal Method of Estimation to Parameters in The Grey Forecasting Model. Journal of Qingdao University, 2003. 16(03): pp. 95-98.
[5] Wu, L., et al., Grey system model with the fractional order accumulation. Communications in Nonlinear Science and Numerical Simulation, 2013. 18(7): pp. 1775-1785.
[6] Wu, L., et al., Using fractional order accumulation to reduce errors from inverse accumulated generating operator of grey model. Soft Computing, 2015. 19(2): pp. 483-488.
[7] Wu, L., et al., Grey Model with Caputo Fractional Order Derivative. Systems Engineering— Theory & Practice, 2015. 35(5): pp. 1311-1316.
[8] Wu, L., et al., Discrete grey model based on fractional order accumulate. Systems Engineering— Theory & Practice, 2014. 34(7): pp. 1822-1827.
[9] Wang, C.H. and L.C. Hsu, Using genetic algorithms grey theory to forecast high technology industrial output. Applied Mathematics & Computation, 2008. 195(1): pp. 256-263.
[10] Meng, W., B. Zeng, Discrete grey model with inverse fractional operators and optimized order. Control and Decision, 2016(10): pp. 1903-1907.
[11] Liu, S. and Y. Yang, Advances in Grey System Research (2004—2014). Journal of Nanjing University of Aeronautics & Astronautics, 2015. 47(1): pp. 1-18.
[12] Cui, X., and W. Jiao, Grey System Model for the Satellite Clock Error Predicting. Geomatics and Information Science of Wuhan University, 2005. 30(5): pp. 447-450.
[14] Zheng, Z. and D. Liu, Direct Modelling Improved GM (1,1) Model IGM (1,1) by Genetic Algorithm. Systems Engineering—Theory & Practice, 2003. 23(5): pp. 99-102.
[15] He, W., et al. A Class of Algorithms for Estimating GM (1,1) Model Parameter. Systems Engineering — Theory & Practice, 2005. 25(1): pp. 69-75.
[16] Zhang, Q, Improving the Precision of GM (1,1) Model by Using Particle Swarm Optimization. Chinese Journal of Management Science, 2007. 15(5): pp. 126-129.
[17] Chu, S.C. and P.W. Tsai, Computational intelligence based on the behaviour of cats. International Journal of Innovative Computing Information & Control Ijicic, 2007. 3(1): pp. 163-173.
[18] Chu, S.C., P.W. Tsai and J.S. Pan, Cat Swarm Optimization. 2006: Springer Berlin Heidelberg.
[19] Guo, L., et al., Parameter identification and sensitivity analysis of solar cell models with cat swarm optimization algorithm. Energy Conversion & Management, 2016. 108: pp. 520-528.
[20] Wang, Y., X. Sun., Non-linear Model Parameter Estimation Based on Cat Swarm Optimization. Science of Surveying and Mapping. 2015(09): pp. 158-162.
[21] Santosa, B. and M.K. Ningrum. Cat Swarm Optimization for Clustering. in Soft Computing and Pattern Recognition, 2009. SOCPAR '09. International Conference of 2009.
[22] Dong, Y, Application of cat swarm algorithm in image clustering analysis. Microcomputer & Its Applications, 2015. 34(22): pp. 53-56.
[23] Ram, G., et al., Optimal array factor radiation pattern synthesis for linear antenna array using cat swarm optimization: validation by an electromagnetic simulator. Frontiers of Information Technology & Electronic Engineering, 2017. 18(4): pp. 570-577.
[24] Orouskhani, M., et al., A Novel Cat Swarm Optimization Algorithm for Unconstrained Optimization Problems. International Journal of Information Technology and Computer Science, 2013. 5(11): pp. 32-41.
[25] Meng, W., et al., GM(1,1) with optimized order based on mutual fractional operators. Control and Decision, 2016(04): pp. 661-666.