2018 International Conference on Applied Mechanics, Mathematics, Modeling and Simulation (AMMMS 2018) ISBN: 978-1-60595-589-6
Liver of CT Slice Localization and Segmentation Based on GPV-levelset
Lu WANG
1, Li-fang ZHOU
1,2,3,*, Wei-sheng LI
1,
Bang-jun LEI
2and Hong-mei LI
31
Coll. of Computer Science and Technology, Chongqing Univ. of Posts and Telecommunications, Chongqing 400065, China
2Hubei Key Laboratory of Intelligent Vision Based Monitoring for Hydroelectric Engineering, China Three Gorges University, Yichang 443002, China
3
Coll. of Software, Chongqing Univ. of Posts and Telecommunications, Chongqing 400065, China
*Corresponding author
Keywords: Location, Liver segmentation, GPV-levelset.
Abstract. Motivated by the goal of improving segmentation of challenging liver cases, which always contain weak boundary with neighboring organs and the presence of intrahepatic tumors as well as highly varied appearance between different subjects, a multi-level detection segmentation framework is presented. The Gaussian pseudo-variance based on local patch is utilized to improve the level set segmentation technique, which named as Gaussian pseudo-variance level set (GPV-levelset). Our method considers the liver scale, the spatial texture, and the changes of the energy functional over iterations. Therefore, the image with uneven gray scale and noise images can be processed effectively. We demonstrate the capabilities of the method in the domain of medical imaging for segmenting two public databases Sliver07 and 3Dircadb.
Introduction
Although Computed Tomography (CT) images have been extensively implemented in clinics, accurate liver segmentation from CT images is still a challenging task[1]. In abdominal medical images, there are several neighboring organs which share similar intensities, which lead to low contrast and weak boundary. Liver segmentation based on pixel methods is hard to detect the boundary accurately which may easily leak to neighboring organs. Hence, shape priors are advisable since they can prevent the results deviating from reasonable pattern shape[2].
One of the most popular shape prior modeling methods is to learn the prior shape information variations from many training samples by statistical shape models (SSM). It can be always integrated into level set[3] based method to improve the accuracy of segmentation. Payel et al.[4] incorporated derivative-free optimization for the level set function to segment prostate on pelvic of computed tomography and magnetic resonance images.
Method
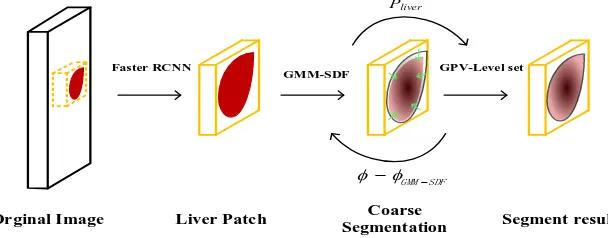
The proposed method is a multi-stage segmentation approach which is shown in Figure 1. First, Faster RCNN extracts the liver patch from the original image, and the red liver area will be separated from the unrelated organs. Next, calculating the GMM-SDF of the liver patch and then the coarse segmentation result can be obtained. The darker the color, the greater the probability that the pixel belongs to the liver region. Finally, the GPV-level set is proposed to evolve the coarse contour to approach the liver boundary accurately.
Faster RCNN
GMM-SDF GPV-Level set
Orginal Image Liver Patch Coarse
Segmentation Segment result
Pliver
[image:2.595.150.454.182.301.2]GMM SDF
Figure 1. The architecture of Multi-level.
Faster RCNN
Faster RCNN is a general object detection algorithm based on deep learning network[6]. Detecting the specific location of the liver is one of the important step for fine segmentation. In detail, we utilize the Faster RCNN to detect the liver. 1500 labeled CT slices of the 3D-IRCADb dataset were trained. The framework is Tensorflow with a learning rate of 0.0005, a momentum of 0.9 and a batch size of 64.
GMM-SDF
Shape modeling. The shape is directly aligned according to the maximum overlap by the signed distance function (SDF). Let I0 is the reference binary image 0, where I0
x 1 if 0
x 0 and
0 x 0
otherwise. Minimize the following energy function to align each SDF i with 0.
2
2
1, 2, 0 1 0 2 1
B T i T i T
F c c X I x c H X I x c H X dx
(1)whereH x
is Heaviside function. Minimizing the energy function F c c XB
1, 2, T
by iterating eachparameter alternately, all shapes can be aligned to the reference function 0.
Let M
1, 2,...,n
is the n aligned training shape matrix. The eigenvalues and eigenvectors ofthe covariance matrix shape matrix are
1, 2,...,m
1 2 ... m
and U
u u1, 2,...,um
respectively. The varied pattern in the PCA shape space can be given as:
1
p
i i i i
u
(2)where
1, 2,...,p
is a vector of shape coefficients. There is no limitation to to ensure thatthe generating shapes is similar to original training shapes.
Matching. Although the liver morphology varies from patient to patient, the intensity of the same tissue is usually uniform in CT scanning. Therefore, the liver distribution can be coarse fitted by one of the Gaussian model in the GMM. Let x is a random variable. The GMM can be defined as
2
1
,
K
i i i
i
P x N x
wherei is weight and
1
1, 0 1
K i i i
. Kis the number of components. N
is the Gaussian probability density function. The Expectation-Maximization (EM) algorithm [7] is used to estimate the parameters
p1,...,pk,1,..., k, 12,...,k2
and the liver-classified GMM . With Eq. 2, GMM can drive the average shape to reach the object boundary. Finally, the coarse segmentation resultGMM SDF
can be obtained.
GPV-level set
In this section, we propose GPV-level set method to convergence boundary since the contour of coarse segmentation is not converged completely.
Edge Stop Function. LetPcon
x is the probability likelihood estimation of data samplex, wherei GMM SDF
x . The edge stop function can be rewritten as
2
1
1 liver con
g x
P P x
(4)
The larger the value ofg x
, the faster the curve evolves. The value of g x
decreases and thecontour evolve slowly, when the gray of pixel has a large difference from the liver-classified.
GPV-levelset. To maintain the edge features and enhance the anti-noise ability, we propose Gaussian pseudo-variance level set. The pseudo-variance is the variance value of pixels at the evolutionary edge corresponding to the liver-classified area. We define the PV term by
21 2
g liver liver
PV g x P I x H dx
(5)Where Pliver is the probability density function of the evolutionary edge, liver is the mean value of
liver-classified,
x is the Dirac delta function, and H
x is the Heaviside function. The value ofthe PV term and g x
are both minimized when the curve is closest to liver boundary.GPV-Level set. For a level set function: , the distance regularized level set evolution energy functional ( ) is defined by
21
( ) ( ) ( ) ( )
2
p g g GMM SDF
R GPV A
(6)
where the last term is the constraint of priori shape. , , are the coefficients of the energy functionsRp( ) , Lg( ) and Ag( ) , respectively. Rp( ) is the level set regularization term[8].
The energy function (6) can be approximated minimized by solving following gradient flow:
2
2
= div dp + gPliver I H I liver + g x GMM SDF
t
(7)
Experimental Implementation
Quantitative Results
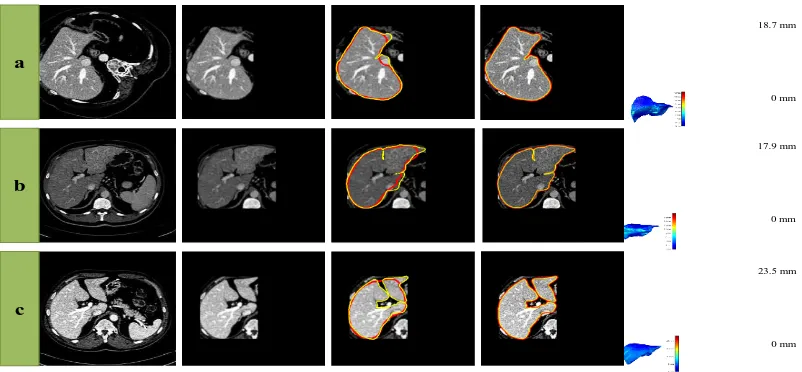
Figure 2 presents three segmentation results of our method. Ground truth is displayed in yellow curves. The red curves are the segmenting curves by our. From the left to right, each column corresponds to the original CT slice, liver-patch, initial segmentation, segmentation results and distance map, respectively. From Figure 2, the proposed method can successfully extract the liver from large intensity (b), and deal the shape variations (a), and handle the ambiguous boundaries (b), capture the long and narrow ravine in liver regions (c). From the distance map, we can see that the overall segmentation results are satisfactory.
0 mm 23.5 mm 0 mm 17.9 mm 0 mm 18.7 mm
a
b
c
Figure 2. Three segmentation results of the proposed method.
Comparison with State-of-the-art Methods
[image:4.595.97.498.192.378.2]To evaluate the performance of the proposed liver segmentation framework, two experiments have been done to compare it with recently published methods based on the Sliver07 database and 3Dircadb database. The results of each measure represent the mean for the overall datasets. Table 1 shows the quantitative comparative results on SLIVER07 database. For all error comparison metrics, our method achieved much better performance than others. Therefore, the performance of our method performance is comparable to that of doctor which can be deployed for effective liver tissue segmentation.
Table 1.Quantitative analysis on SLIVER07. Table 2. Quantitative analysis on 3D-IRCADb.
Method VOE VD AVD MSD MXD Method VOE VD AVD SD MXD
Dou et
al.[10] 7.7 1.9 1.6 4.1 45.9 Lu et al.[13] 14.9 -0.6 1.9 5.9 44.8
Hu et al.[11] 5.4 0.3 1.0 1.8 19.2 Shi et al.[14] 8.7 2.4 1.4 2.6 26.9 Wu et al.[12] 7.78 1.31 1.29 2.5 23.6 Li et al.[15] 9.15 -0.07 1.55 3.15 28.22
Proposed 4.3 0.2 0.7 1.4 16.7 Proposed 5.7 0.6 1.2 2.5 22.1
Table 2 shows the quantitative comparative results on 3D-IRCADb database. Specifically, the mean AVD, VOE and MXD of our method are 1.2mm, 5.7% and 22.1mm, respectively. However, the VD of our method (0.6%) is slightly higher than Li's and method (0.07%), which means that our method tends to over-segment the liver tissue. These results indicate that our method is more accurate and more robust than other state-of-the-art methods.
Discussion and Conclusion
[image:4.595.55.542.548.627.2]segmenting two public databases Sliver07 and 3Dircadb. The experiment results are competitive with state-of-the-art methods.
Although our method has better performance for most CT liver image segmentation, there are still some severe clutter images beyond our consideration due to organ diversity and tumor clutter. In future research, we will committe to seek more accurate characterization. Besides, our method is to segment the 2D CT slice and reconstruct them into 3D which may loss some information. Therefore, we will try to segment CT volumes directly to reduce the loss of spatial information.
Acknowledgement
This study was funded by National Natural Science Foundation of China (No. U1401252), Hubei Key Laboratory of Intelligent Vision Based Monitoring for Hydroelectric Engineering (2017SDSJ02) and Chongqing research and innovation project of graduate students (CYS18247).
References
[1] Campadelli P, Casiraghi E, Esposito A. Liver segmentation from computed tomography scans: a survey and a new algorithm[J]. Artificial intelligence in medicine, 2009, 45(2-3): 185-196.
[2] Heimann T, Meinzer H P. Statistical shape models for 3D medical image segmentation: a review[J]. Medical image analysis, 2009, 13(4): 543-563.
[3] Li C, Wang X, Eberl S, et al. A likelihood and local constraint level set model for liver tumor segmentation from CT volumes.[J].IEEE Transactions on Biomedical Engineering, 2013, 2967-2977.
[4] Ghosh P, Mitchell M, Tanyi J A, et al. Incorporating priors for medical image segmentation using a genetic algorithm[J]. Neurocomputing, 2016, 195(C):181-194.
[5] Hoogi A, Beaulieu C F, Cunha G M, et al. Adaptive local window for level set segmentation of CT and MRI liver lesions[J]. Medical image analysis, 2017, 37: 46-55.
[6] Girshick R. Fast r-cnn[C]//Proceedings of the IEEE international conference on computer vision. 2015: 1440-1448.
[7] Farnoosh R, Zarpak B. Image segmentation using Gaussian mixture model[J]. IUST international journal of engineering science, 2008, 19(1-2): 29-32.
[8] Li C, Xu C, Gui C, et al. Distance regularized level set evolution and its application to image segmentation[J]. IEEE transactions on image processing, 2010, 19(12): 3243.
[9] Heimann T, Van Ginneken B, Styner M A, et al. Comparison and evaluation of methods for liver segmentation from CT datasets[J]. IEEE transactions on medical imaging, 2009, 28(8): 1251-1265.
[10] Dou Q, Chen H, Jin Y, et al. 3D deeply supervised network for automatic liver segmentation from CT volumes[C]//International Conference on Medical Image Computing and Computer- Assisted Intervention. Springer, Cham, 2016: 149-157.
[11] Hu P, Wu F, Peng J, et al. Automatic abdominal multi-organ segmentation using deep convolutional neural network and time-implicit level sets[J]. International journal of computer assisted radiology and surgery, 2017, 12(3): 399-411.
[12] Wu W, Zhou Z, Wu S, et al. Automatic Liver Segmentation on Volumetric CT Images Using Supervoxel-Based Graph Cuts:[J]. Computational and Mathematical Methods in Medicine, 2016,(2016-4-5), 2016, 2016:9093721.
[14] Shi C, Cheng Y, Liu F, et al. A hierarchical local region-based sparse shape composition for liver segmentation in CT scans[J]. Pattern Recognition, 2016, 50: 88-106.