2019 International Conference on Information Technology, Electrical and Electronic Engineering (ITEEE 2019) ISBN: 978-1-60595-606-0
Numerical Simulation Analysis of the Cast-Steel Joint in a Tree-Like
Column Structure
Wen-feng DU, Li-ming ZHU
*, Long-xuan WANG and Peng-fei HE
Institute of Steel and Space Structures in Henan University, 475004, Kaifeng, China
*
Corresponding author
Keywords: Cast-steel joint, Tree-like column structures, Numerical simulation.
Abstract. The cast-steel joint is often used in a tree-like column structure to achieve smooth transition. Its performance is critical to ensure the whole structural safety. In this paper, the load bearing behavior of a cast-steel joint with three branches is investigated. First, a finite element model of the test joint was established by SolidWorks and analyzed by ANSYS considering the geometric and material nonlinearity. Then, the calculation formula for load-carrying capacity of the cast-steel joint with branches was deduced by the method of regression analysis, which is used for estimating the geometric parameters and load-carrying capacity at the stage of preliminary design of the cast-steel joint. Comparison analysis shows that there is a good agreement between the experimental result, the FEM result, and the prediction result from formula.
Introduction
The tree-like column structure has been widely used in engineering practice owing to its beautiful shape and excellent mechanical performances. Since the tree-like column structure was used at Germany Stuttgart Airport in 1991 [1] for the first time, a number of representative projects, such as the ION Orchard shopping center in Singapore (Fig.1), the Stansted Airport in London, the Detroit Airport in USA, and the Shenzhen cultural center in China, has spread its usage quickly [2].
[image:1.595.91.503.468.592.2]
(a) (b) (c)
Figure 1. Tree-like column structures:(a) Germany Stuttgart Airport; (b) ION Orchard Center; (c) Stansted Airport.
It is obvious that such joints play a critical role in tree-like structures. On the one hand, the whole upper structure is only supported through a single joint, and the tree-like structure will collapse if the joint is destroyed. On the other hand, many members including the trunk and branch pipes converge on the joint with smooth transitions, the force responses of such joints are complicated.
Cast-steel joint with branches is usually adopted in tree-like column structures [3]. Compared with welded tubular joints, cast-steel joint can avoid the residual stress due to complex welds at junctions, reduce the construction difficulty, and increase the construction speed of tree-like structures [4-5].
Chongqing Olympic Stadium in China [9]. Numerical analysis has been another approach to obtain complete map of stresses developed in cast-steel joints. The results of finite element analysis provide great helps for the design of cast-steel joint, such as the Cycling Gymnasium for Beijing Olympic Game [10], Guangzhou New Railway Station [11], and Tianjin Convention and Exhibition Center [12]. Eurocode 3 provided the component method, which allows one to evaluate the stiffness and resistance characteristic of the joint by assembling those of all the constitutive components [13, 14].
The geometrical configuration of cast-steel joint with branches comprises of one main pipe and two, three or four branching pipes. It can be foreseen that the application of cast-steel joint with branches will be more and broader with the development of tree-like column structures. However, there are no relevant provisions in the existing building standards or codes by far, and the research on the mechanical performance, calculation theory and structural optimization of the cast-steel joint with branches is still scarce.
In this paper, a typical numerical simulation analysis of a cast-steel joint with one trunk and three branches was conducted. The distribution of the stress, the process of plasticity spreading and the failure mechanism of the joint were calculated by ANSYS. Moreover, the calculation formula for load-bearing capacity of the cast-steel joint with branches was deduced based on the method of regression analysis.
Numerical Simulation Analysis
Analysis Model
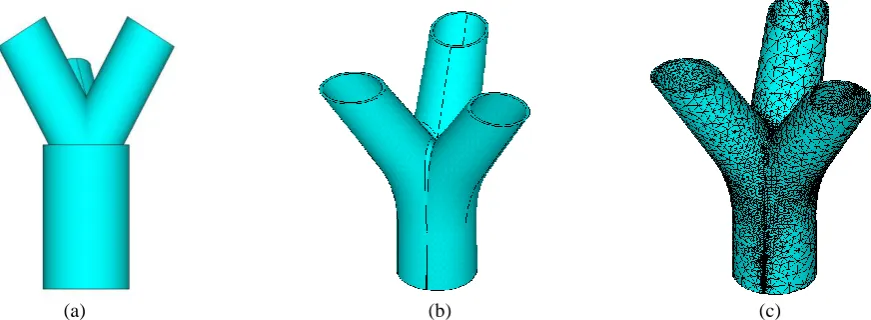
In order to understand the performance of the test joint comprehensively, the corresponding finite element model was established. As shown in Fig.2 (a), the model of the joint was established by using the default ANSYS preprocessor at first. However, it is difficult to achieve a smooth transition between the main pipe and the branches. So the joint was modeled by the 3D modeling software SolidWorks to ensure that the established joint model is consistent with the actual joint, as shown in Fig.2 (b).
[image:2.595.75.511.467.627.2]
(a) (b) (c)
Figure 2. The comparison of models: (a)The model established by ANSY; (b) The model established by SolidWorks; (c) Finite element meshes.
After research and comparison, the three-dimensional solid element Solid65 was chosen from the ANSYS element type library. The element type has a quadratic displacement and it is suitable for irregular grid division. The finite element mesh of the joint is shown in Fig.2(c).
Analysis Results of the Joint
The finite element analysis was conducted for the case of the test joint. Fig.3 shows the stress contours of the joint when the load reaches 1000 kN, 2000 kN, 3000 kN, 4000 kN, 5000 kN respectively. From Fig.3, it can be seen that the overall stress level of the joint under the 1000 kN load is low, and the maximum stress value is mainly distributed in the vicinity of the joint core area. The stress in the main pipe and the branch pipes is obviously less than the stress at the core area of the joint. The former is only 11.5% of the later.
(a) (b) (c)
[image:3.595.69.529.226.580.2](d) (e)
Figure 3. Stress contours of the joint: (a) The stress contour of the joint under 1000 kN; (b)The stress contour of the joint under 2000 kN; (c)The stress contour of the joint under 3000 kN; (d)The stress contour of the joint under 4000 kN;
(e)The stress contour of the joint under 5000kN.
on the core region for the cast-steel joint with branches, which has a great influence on the ultimate load-carrying capacity of the joint.
Figure 4. Load-displacement curves of specimens. Figure 5. The vertical displacement contours of joint.
Fig.4 shows the vertical displacement of the joint under the maximum load 5000 kN. From Fig.5, it can be seen that the maximum vertical displacement (4.366mm) is smaller than that (8.064mm) obtained from the test. It is mainly due to the non-tight contact between the joint and the test equipment piston.
Effect of Joint Parameters on Compression Behavior of the Cast-Steel Joint
[image:4.595.95.498.487.737.2]In order to investigate the influence of different parameters on the ultimate load-carrying capacity of the joint, a parametric study of controlling variables is conducted. The variable is changed one by one while other variables remain constant.
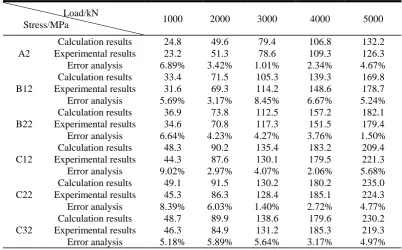
Table 1. Comparison between finite element analysis and experimental results.
Load/kN
Stress/MPa 1000 2000 3000 4000 5000
A2
Calculation results 24.8 49.6 79.4 106.8 132.2 Experimental results 23.2 51.3 78.6 109.3 126.3 Error analysis 6.89% 3.42% 1.01% 2.34% 4.67%
B12
Calculation results 33.4 71.5 105.3 139.3 169.8 Experimental results 31.6 69.3 114.2 148.6 178.7 Error analysis 5.69% 3.17% 8.45% 6.67% 5.24%
B22
Calculation results 36.9 73.8 112.5 157.2 182.1 Experimental results 34.6 70.8 117.3 151.5 179.4 Error analysis 6.64% 4.23% 4.27% 3.76% 1.50%
C12
Calculation results 48.3 90.2 135.4 183.2 209.4 Experimental results 44.3 87.6 130.1 179.5 221.3 Error analysis 9.02% 2.97% 4.07% 2.06% 5.68%
C22
Calculation results 49.1 91.5 130.2 180.2 235.0 Experimental results 45.3 86.3 128.4 185.1 224.3 Error analysis 8.39% 6.03% 1.40% 2.72% 4.77%
C32
Calculation results 48.7 89.9 138.6 179.6 230.2 Experimental results 46.3 84.9 131.2 185.3 219.3 Error analysis 5.18% 5.89% 5.64% 3.17% 4.97%
The modeling results are shown in Table 1, which could be summarized as:
1334.73kN. J8 and J5 have the same geometrical parameters, but the diameter thickness ratio (γ) of J8 is the largest, and that of J5 is the smallest. So the effect of the diameter thickness ratio (γ) on the ultimate carrying-load capacity of joints is the most significant.
2) When only θ increases while other variables remain unchanged, the ultimate carry-loading capacity of the joint is largely reduced. It shows that θ has a great influence on the ultimate load-carrying capacity of the joint.
3) When β and R3 gradually increase and other variables remain unchanged, the ultimate load-carrying capacity of the joint is greatly increased. It shows that β and R3 have a large influence on the ultimate load-carrying capacity of the joint too.
4) When L, R1 and R2 gradually increase and other variables remain unchanged, the ultimate carry-loading capacity of the joint is nearly unchanged. The largest amount of change is less than 5%. It shows that L, R1 and R2 have almost no influence on the ultimate load-carrying capacity of the joint.
5) According to the finite element modeling results, it is concluded that the influence of the geometric parameters should be fully considered when the load-carrying capacity of the cast-steel joint with branches is analyzed. The dimension parameter of the joint should be carefully selected to ensure the safety and reliability of the structure.
Load-Carrying Capacity Estimation of the Three-Branch Cast-Steel Joint
It is found in literatures the load-carrying capacity formulas for the welded tubular T-joints, the steel tubular XK-joints, the multi-planar KX-and KT-joints under axial load are all expressed as the product of the material yield strength and square of the pipe wall thickness. Therefore, the estimation of the cast-steel joint with branches can be expressed similarly as:
2
u y
F KT f
(1) where Fu is load-carrying capacity of the joint; K is a parameter that contains the geometric parameters such as θ, γ and β of the joint; T is the pipe wall thickness; and fy is the material yield strength of the joint.
In Eq. (1), expression of K is the research focus for different type joints. Since K is a comprehensive index reflecting the influence of various geometric parameters on the joint load-carrying capacity, it is no longer a single study of the relationship between K and Fu, but a multiple study of the relationship between each parameter and K.
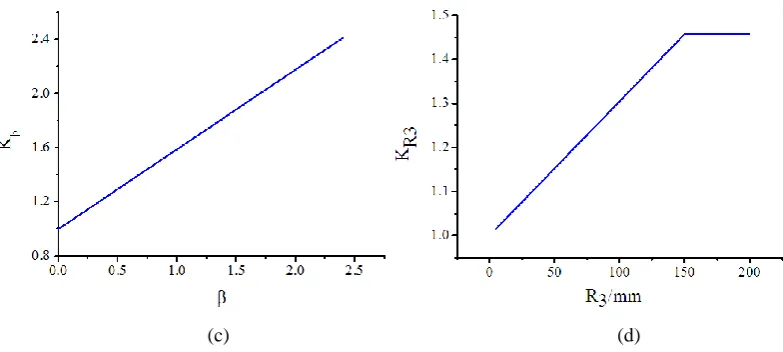
Results of the finite element analysis show that L, R1 and R2 of the joint have little influences on the joint ultimate load-carrying capacity, so these three parameters are ignored during the analysis of comprehensive index K. According to the line charts between θ, γ, β and R3 and K respectively, as shown in Fig.6, a regression analysis is conducted.
(c) (d)
Figure 6. The relationship line chart between geometric parameters (θ, γ, β, R3) of the joint and the K: (a) Relationship line chart between θ and Kθ; (b) Relationship line chart between γ and Kγ; (c) Relationship line chart between β and Kβ;
(d) Relationship line chart between R3 and KR3.
The regression analysis is first conducted on the relationship between θ and Kθ. Through the regression analysis, the relationship between the sine value of θ and Kθ can be given as:
2 3
0.60022 2.5311sin 6.59681sin 5.07388sin
K
(2) For the relationship between γ and Kγ, it could be expressed as a power function:
0.66242 4.3725
K
(3)
A linear relationship could be observed between the β and Kβ from Fig.7 which could be expressed as:
1 0.58856 K
(4)
At last the regression analysis is conducted between R3 and KR3. According to the principle of dimensional analysis, it is required that the item of R3 contained in the formula is dimensionless. A dimensionless chamfer coefficient ρ is defined to consider the influence of R3, which is shown as:
3
R dt
(5) where d is the outer diameter of the branch pipe; t is the wall thickness of the branch pipe. The finite element model shows that the joint ultimate load-carrying capacity is very small when R3 is greater than or equal to 100mm. So R3 is limited less than or equal to 100mm on the ultimate load-carrying capacity calculation formula for the cast-steel joint with three branches. Through regression analysis, the relationship between the chamfer coefficient ρ and KR3 follows a linear relation, which is expressed:
3
3 1 0.33738 R
R K
dt
0.66242 3
2 3 2
4.37251 (1 0.58856 )(1 0.33738 )(0.60022
2.5311sin 6.59681sin 5.07388sin ) y
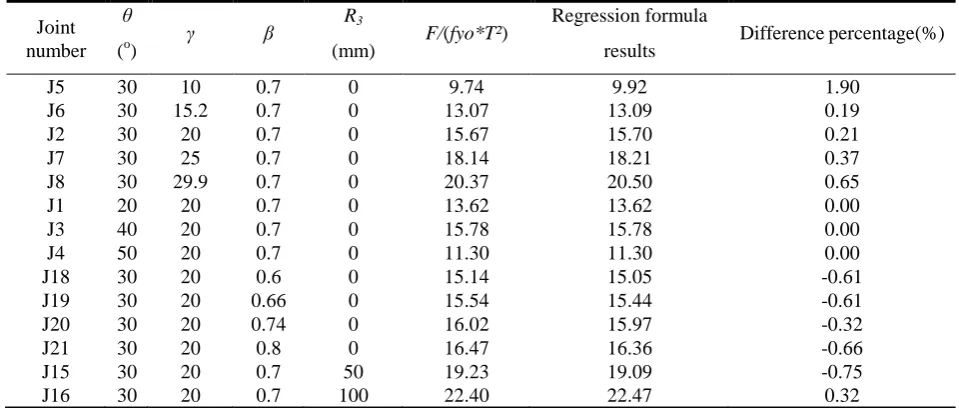
[image:7.595.57.537.221.425.2]R F dt f T (7) In order to validate the accuracy of Eq. (7), the results of finite element modeling and those of regression formula are compared. The comparison results are shown in Table 2. It can be found that the error between the calculation formula and the finite element calculation is very small, and the maximum error is 1.9%. It can be concluded that this suggested formula can predict the ultimate load-carrying capacity of the cast-steel joint with three branches accurately.
Table 2. Calculation formula error table.
Joint number
θ
(o) γ β
R3
(mm) F/(fyo*T²)
Regression formula
results Difference percentage(%)
J5 30 10 0.7 0 9.74 9.92 1.90
J6 30 15.2 0.7 0 13.07 13.09 0.19
J2 30 20 0.7 0 15.67 15.70 0.21
J7 30 25 0.7 0 18.14 18.21 0.37
J8 30 29.9 0.7 0 20.37 20.50 0.65
J1 20 20 0.7 0 13.62 13.62 0.00
J3 40 20 0.7 0 15.78 15.78 0.00
J4 50 20 0.7 0 11.30 11.30 0.00
J18 30 20 0.6 0 15.14 15.05 -0.61
J19 30 20 0.66 0 15.54 15.44 -0.61
J20 30 20 0.74 0 16.02 15.97 -0.32
J21 30 20 0.8 0 16.47 16.36 -0.66
J15 30 20 0.7 50 19.23 19.09 -0.75
J16 30 20 0.7 100 22.40 22.47 0.32
Conclusions
The numerical simulation and experimental investigation of a full-scale cast-steel joint with three branches are presented. A typical full-scale model of cast-steel joint was established by SolidWorks and analyzed by ANSYS considering the geometric and material nonlinearity. The corresponding verification experiment was carried out to confirm the numerical simulation. Moreover, the formula for calculating the load-carrying capacity of the cast-steel joint with three branches was presented, which could satisfy the requirement of engineering design. Through the research of this paper, the investigation yields the following conclusions:
1) Through the analysis of the full-scale joint experimental results, the stress distribution of the joint under compression was obtained. Large stresses are mainly concentrated on the core area of the joint, and the stresses in the main pipe and the branch pipes are small. It provides a basis of evaluating the strength and stiffness of joint to meet design requirements.
2) SolidWorks is applicable to establish the model of cast-steel joint with branches. It solved the problem of modeling the joint of tube and tube intersection with smooth transition to be consistent with the actual joint.
3) The finite element model of the test joint was imported into ANSYS for analysis. The finite element results are compared with the experimental results, and the analysis results are consistent with the experimental results. The verified finite element model could be confidently adopted for evaluating effects of joint geometry parameters on the behavior of the three-branch cast-steel joint.
requirement of engineering design. It will be an available tool for the geometry parameter selections in the structural design of the joint.
5) The stress level in the branch pipes of the cast-steel joint is low overall. It indicates the wall thicknesses or diameters of the branch pipes could be reduced for optimal designs.
Acknowledgement
The authors gratefully acknowledge the support of the National Natural Science Foundation of China for this work (U1704141).
References
[1] L.W. Tong, Y.Z. Chen, Y.Y. Chen, C. Fang. Cyclic behavior of beam-to-column joints with cast steel connectors, J. Journal of Constructional Steel Research.116 (2016) 114-130.
[2] I. M. Rian, M. Sassone. Tree-inspired dendriforms and fractal-like branching structures in architecture: A brief historical overview, J. Frontiers of Architectural Research. 3(3) (2014) 298-323. [3] X.L. Zhao, L.W. Tong. New development in steel tubular Joints, J. Advances in Structural Engineering. 14(4) (2011) 699-715.
[4] C. Fang, B.A. Izzuddin, A.Y. Elghazouli. Modeling of semi-rigid beam-to-column steel joints under extreme loading, J. Frontiers of Structural and Civil Engineering. 7(3) (2013) 245–263.
[5] C. Brett, Y. Lu. Assessment of robustness of structures: current state of research, J. Frontiers of Structural and Civil Engineering. 7(4) (2013) 356–368.
[6] M.S. Aziz, Y.A.E. Sheriff. Biomimicry as an approach for bio-inspired structure with the aid of computation, J. Alexandria Engineering Journal. 55(1) (2016) 707-714.
[7] Z. Wang, X. Zhao, Y. Chen, Z.Y. Shen. Experimental study on cast steel joint of South Railway Station in Shanghai, J. Advances in steel structures.1 (2005) 887-892.
[8] H. Schober. Steel castings in architecture and engineering, J. Modern Steel Construction. 43(4) (2003) 65-72.
[9] J.C. Oliveira, S. Willibald, J.A. Packer, C. Christopoulos, T. Verhey. Cast steel nodes in tubular construction—Canadian experience, C. Proceedings of the 11th International Symposium and IIW International Conference on Tubular Structures, Quebec City, Canada, (2006) 523–529.
[10]L.B Wang, H. Jin, H.W. Dong, J. Li. Balance fatigue design of cast steel nodes in tubular steel structures, J. The Scientific World Journal. 2013(1) (2013) 14-24.
[11]J. G. Cai, J. Feng, J. Wang. Numerical analysis of Y-type cast-steel joint for Guangzhou New Railway Station, C. 2nd IEEE International Conference on Computer Science and Information Technology, (2009) 39-42.
[12]F. Bouafia, S. Boualem, MME. Amin, B. Benali. 3-D finite element analysis of stress concentration factor in spot-welded joints of steel: The effect of process-induced porosity, J. Computational Materials Science, 50(4) (2011) 1450-1459.
[13]Eurocode 3: Design of steel structures. Part 1.8 (design of joints) [S]. 2005.