of the Lumbar Extensors in a Seated Posture
Bochen Jia,1 Maury A. Nussbaum,2 and Michael J. Agnew21 Industrial and Manufacturing Systems Engineering, University of Michigan – Dearborn, Dearborn, Michigan, USA 2 Department of Industrial and Systems Engineering, Virginia Tech, Blacksburg, Virginia, USA
Abstract
The purpose of present study was to develop and evaluate methods to assess stimulation responses of the lumbar extensors, as part of a longer-term goal of detecting fatigue during prolonged sitting. Three stimulation frequencies (2, 5, and 8 Hz) were tested in separate stages, which include 3 stimu-lation trains and 4 sampling blocks. Repeated measures analyses of variance were used to determine whether any significant differences in mean stimulation responses occurred with respect to stimulation frequency, sampling block, and stimulation train. Reliability of measured stimulation responses was assessed within and between sampling blocks using intraclass correlation coefficients. Stimulation fre-quencies significantly affected the stimulation responses and time-to-potentiation differed between the 3 stimulation frequencies; it was highest for 2 Hz stimulation. All 3 stimulation frequencies resulted in excellent reliability within and between sampling blocks. Use of the current protocol at 2 Hz is recommended as appropriate to measure the lumbar extensors status during prolonged sitting.C 2014 Wiley Periodicals, Inc.
Keywords:Muscle stimulation; Stimulation frequency; Lumbar extensors
1.
INTRODUCTION
Modern living increases the tendency to have a more sedentary lifestyle that involves prolonged sit-ting (Ford, Kohl, Mokdad, & Ajani, 2005; Varo et al., 2003). In the United States, for example, an earlier report indicated that more than 60% of adults are rarely physically active and 20% of all adults are com-pletely sedentary (U.S. Department of Health and Hu-man Services, 1996). Current estimates are consistent in terms of leisure-time physical activity in the United States (Pleis, Lucas, & Ward, 2009) and more
gener-Correspondence to: Maury A. Nussbaum, Department of Industrial and Systems Engineering, Virginia Tech, 250 Durham Hall (0118), Blacksburg, VA 24061. Phone: 540-231-6053; e-mail: [email protected]
Received: 21 June 2012; revised 28 February 2014; accepted 7 March 2014
View this article online at wileyonlinelibrary.com/journal/hfm
DOI: 10.1002/hfm.20584
& Sjøgaard, 2003; van Die¨en, Westebring-van der Putten, Kingma, & de Looze, 2009).
Objective signs of muscle fatigue during sitting have typically been obtained from electromyographic (EMG) measures, though the use of EMG in this con-text has associated challenges and has provided some conflicting results. As noted, relatively low contrac-tion levels are involved, and these can be lower than that needed for EMG to detect fatigue-related changes (Gamet, Duchene, Garapon-Bar, & Goubel, 1993; Nagata, Arsenault, Gagnon, Smyth, & Mathieu, 1990; Oberg, Sandsjo, & Kadefors, 1994; Oberg, Sandsjo, Kadefors, & Larsson, 1992; Sood, Nussbaum, & Hager, 2007). McLean and Goudy (2004) also indicated that during low contractions evidence of fatigue is incon-sistent between different muscle groups and across in-dividuals. While Søgaard et al. (2003) and van Die¨en et al. (2009) demonstrated the feasibility of using EMG to detect muscle fatigue during low-level contractions (as low as 2% MVC), their results showed large inter-subject variability.
A common alternative means to identify muscle fa-tigue is through external stimulation to obtain stimu-lation responses. In this approach, fatigue is indicated when stimulation responses fall significantly below initial, prefatigue levels (Binder-Macleod & Snyder-Mackler, 1993; Edwards, Hill, Jones, & Merton, 1977; Johnson, 1998; Johnson, Lehman, & Rempel, 1995a). Muscle fatigue has been measured by comparing the decrement of response ratio between results to high-frequency (50–100 Hz) stimulation and low-high-frequency (1–20 Hz) stimulation (Bystr¨om & Kilbom, 1991; Davies & White, 1982; Edwards et al., 1977). Others have measured muscle fatigue using a single stimu-lation frequency (Cooper, Edwards, Gibson, & Stokes, 1988; Johnson et al., 1995a). While a variety of tion protocols have been used, a greater loss in stimula-tion response can occur when evoked by low-frequency stimulation (Cooper et al., 1988; Fitch & McComas, 1985). Low-frequency stimulation can also be advan-tageous since it is less likely to cause muscle fatigue or discomfort (Johnson et al., 1995a). Low-frequency muscle stimulation has been shown to be an effective method to assess muscle fatigue (Johnson et al., 1995a) and has been successfully applied to the forearm mus-cles (Johnson, Lehman, & Rempel, 1995b, 1996; Mork & Westgaard, 2005). Yet it remains unclear whether this approach would be similarly successful for assess-ing fatigue in the trunk musculature.
The current work is part of broader effort to use muscle stimulation (low frequency, specifically) to de-tect lumbar extensors fatigue during prolonged sitting. In this context, the present study was conducted to develop a reliable muscle stimulation protocol to mea-sure stimulation responses in the lumbar extensors, specifically those muscles potentially fatigued during prolonged seated tasks. Several stimulation parame-ters and conditions can substantially affect stimulation response, thereby influencing the reliability of stimula-tion response measurements. During prolonged stim-ulation, stimulation responses undergo a gradual po-tentiation (Desmedt & Hainaut, 1968), which, if not accounted for, can mask or confound other effects. For example, an increase in stimulation response ampli-tude due to potentiation and a decrease due to fatigue can occur simultaneously (Rassier & MacIntosh, 2000) and has been observed during low-frequency fatigue caused by sustained low-level loading (Fowles & Green, 2003). Potentiated stimulation responses may also be a more sensitive index of contractile fatigue than un-potentiated stimulation responses (Kufel, Pineda, & Mador, 2002). The relationship between stimulation response generation and excitation also depends on stimulation frequency, which can also influence the pattern of potentiation (Rassier & MacIntosh, 2000). In the current study, we evaluated the effects of several stimulation frequencies in terms of potentiation and the reliability of evoked stimulation responses. Results from this exploratory work were intended to facilitate the selection of stimulation protocols in future studies.
2.
METHODS
2.1. Overview
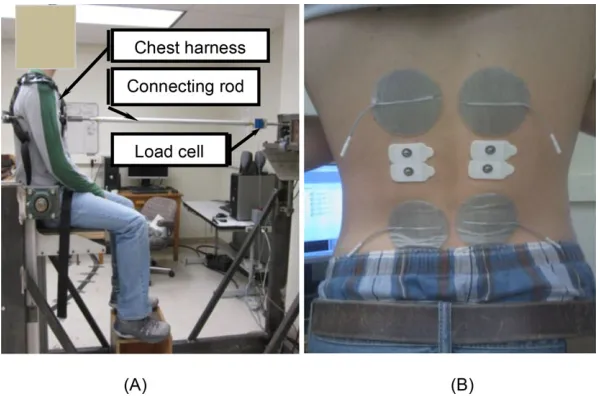
Figure 1 Illustration of (A) experimental fixture setup demonstrating a participant in an upright sitting posture, and (B) the locations of dual-channel muscle stimulation electrodes (grey) and bipolar EMG electrodes (white).
status and was done using each of three stimulation fre-quencies. Stimulation responses of the lumbar exten-sors, represented by the forces measured from resulting (evoked) trunk extension, were measured in response to each stimulation frequency using the same stimula-tion protocol and via a load cell and fixture. Responses to the three stimulation frequencies were compared to help identify an appropriate stimulation protocol.
2.2. Participants
Six participants (gender balanced) were recruited and completed an informed consent process approved by the Virginia Tech Institutional Review Board. Their mean (standard deviation [SD]) age, height, body mass, and body mass index (BMI) were 28.2 (4.8) years, 170.3 (8.7) cm, 67.6 (13.2) kg, and 23.2 (3.2), re-spectively. Individuals with body mass index>30 were excluded due to the potential difficulty in evoking re-liable muscle contractions. All participants were phys-ically active and had no self-reported musculoskeletal or neurological diseases within the past year that re-stricted their daily activities.
2.3. Instrumentation
The lumbar extensors were stimulated bilaterally us-ing a dual-channel, current-controlled muscle stim-ulator (Grass S88, AstroMed, West Warwick, RI) in series with a stimulus isolation unit (SIU5, AstroMed, West Warwick, RI) and a constant current unit (CCU1,
AstroMed, West Warwick, RI). Two pairs of 7-cm-diameter bipolar stimulating electrodes (PALS Plat-inum Model 879300, Axelgaard Manufacturing Co., Fallbrook, CA) were placed bilaterally over the lumbar extensors (see below regarding stimulation site). Dur-ing the experiment, participants sat in an experimen-tal fixture (Figure 1A), in which motion of the pelvis was restrained using straps. An adjustable footrest was used to position the lower limb with right angles at the knee and ankle. Participants were positioned in a comfortable and relaxed upright sitting posture us-ing a rigid rod connected to a chest harness at the T8 level and which contained an in-line load cell (In-terface SM2000, capacity=2,000 N, Scottsdale, AZ). Stimulation responses were sampled at 1000 Hz from the load cell. To minimize voluntary muscle activity during stimulation response measurements, the erec-tor spinae were monierec-tored using two pairs of surface EMG electrodes that were placed bilaterally at the L3 level (Figure 1B). EMG signals were monitored visu-ally throughout the experiments in real time. Muscle stimulation was started only after the observed level of muscle activation was (qualitatively) stabilized, specif-ically as reflected in no substantial increase/decrease in EMG levels.
2.4. Experimental Procedures
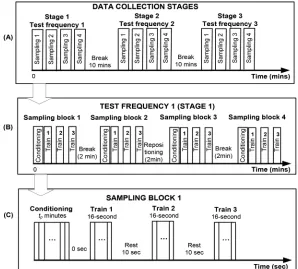
Figure 2 Schematic indication of stimulation procedures. (A) Three stimulation frequencies in separate test stages. (B) Muscle stimulation protocol during one data collection stage. Conditioning: continuous stimulation at a given stimulation frequency to reach a plateau in twitch force. Train: stimulation at each stimulation frequency with rest in between. (C) Stimulation during one sampling block. In addition, participants were repositioned between 2nd and 3rd sampling blocks.
electrodes would be placed was first shaved, and then skin was cleaned with alcohol and dried. On the basis of earlier recommendations on initial electrodes loca-tions and probing procedures (Baker, McNeal, Benton, Bowman, & Waters, 1993; Johnson et al., 1995a; Vanoncini, Holderbaum, & Andrews, 2006), subse-quent preparatory procedures were completed to iden-tify the most effective stimulation site for each individ-ual. Initially, negative electrodes were placed at the level of the iliac crest, and positive electrodes were placed at the level of the inferior margin of the rib cage (see Figure 1B). Stimulus intensity was then determined by increasing the stimulation current from 10 mA at each stimulation frequency (see below), until discom-fort was reported or up to a max of 40 mA, and it was subsequently reduced by 15%. Discomfort/pain is related to the stimulation level, which is controlled by the pulse amplitude (current) and pulse duration. Measured stimulation responses are often a nonlinear function of either pulse duration or stimulation am-plitude (Crago, Peckham, & Thrope, 1980). During stimulation, it is important to minimize charge
trans-fer to prevent damage to muscle tissue. At a given force level, a high stimulation amplitude requires less charge transfer per stimulation pulse, and charge transfer in-creases with increasing stimulation duration (Crago, Peckham, Mortimer, & Van Der Meulen, 1974; Crago et al., 1980). As a compromise, we used a pulse duration of 0.3 ms. Current-controlled stimulation (at 150 V) was also chosen, as it was easier to control and may induce less discomfort compared to voltage-controlled stimulation (Merletti, Knaflitz, & DeLuca, 1992). After identifying the stimulus intensity, the test muscles were “warmed up” using a 4-min stimulation block at the stimulation frequency. Finally, effective electrode sites were then determined by stimulating the muscle at each stimulation frequency and probing (i.e., adjusting the positive electrode locations) along superior–inferior direction until maximal evoked stimulation responses were measured using the load cell.
for each participant using a Latin square, and a 10-min break was given after each stage. The same stimulation frequency and parameters were applied in the con-ditioning trains and in the subsequent measurement trains. Within each stage, stimulation responses were measured in four sampling blocks (Figure 2B) with a 2-min rest in between. Within each sampling block, a conditioning train was applied (Figure 2C) to first potentiate the muscles into a steady state (Desmedt & Hainaut, 1968; Edwards et al., 1977; Kufel et al., 2002; Rassier & MacIntosh, 2000). Each condition-ing train was terminated when stimulation responses plateaued, determined in real-time by using a 1-s mov-ing window mean of peak responses measured. This time-to-potentiation (tpot) was recorded along with
the potentiated stimulation responses (Fpot).
Immedi-ately after the conditioning train, muscle stimulation responses were measured during three 16-s stimulation trains (Figure 2C). Short breaks were provided between each train. To minimize potential effects of reposition-ing, however, participants were not allowed to leave the experimental fixture. After the second sampling block, participants were removed and repositioned in the experimental fixture. This was done to determine whether there were significant differences in stimula-tion responses.
2.5. Data Processing and Analysis
Stimulation responses were band-pass filtered (1.5– 10 Hz) to remove environmental and breathing arti-facts (Beers, 2003). Peak responses from each stimu-lation pulse, within each train, were determined using MATLAB software (MathWorks, 2010a). Mean stim-ulation responses were the dependent measure in the repeated measures analyses of variance (RANOVAs). These were obtained as the means, across all peak stim-ulation responses recorded during the 16-s block of each train, excluding the three largest and three small-est values. Such a truncated (trimmed) mean was used as an estimate of central tendency, as it is less sensi-tive to outliers (Rothenberg, Fisher, & Tilanus, 1964; Wilcox & Keselman, 2003).
RANOVAs were used to identify any significant dif-ferences in mean stimulation responses with respect to stimulation frequency, sampling block, and stim-ulation train. Where relevant, significant effects were further investigated using Tukey’s honestly significant difference post hoc analyses. RANOVA was also used to identify any significant differences intpot related to
stimulation frequency and sampling block. In all anal-yses, a p value of <0.05 was considered statistically significant.
The reliability of stimulation responses was evalu-ated both within and between sampling blocks for each of the three stimulation frequencies. To allow for com-parisons of stimulation responses within and between participants, stimulation responses measured within each conditioning train and twitch train were normal-ized to stimulation responses collected after muscle conditioning within the first sampling block. This ap-proach was used, since Fpot was expected to be the
most stable response measured. Reliability was eval-uated using intraclass correlation coefficients (ICC) and was determined separately for each of the three stimulation frequencies. Within sampling blocks reli-ability was determined by calculating ICC using data obtained from the three stimulation trains. Reliability between sampling blocks was evaluated by calculating ICC from mean stimulation responses in each train and across all four sampling blocks. ICC was also cal-culated using mean stimulation responses across all three trains to evaluate reliability between sampling blocks. Finally, ICC was used to assess the reliability of stimulation responses before and after repositioning the participant in the experimental fixture. ICCs were qualitatively interpreted [Cicchetti and Sparrow, 1981, aspoor(0.00–0.39),fair(0.40–0.59),good(0.60–0.74), orexcellent(0.75–1.00)].
3.
RESULTS
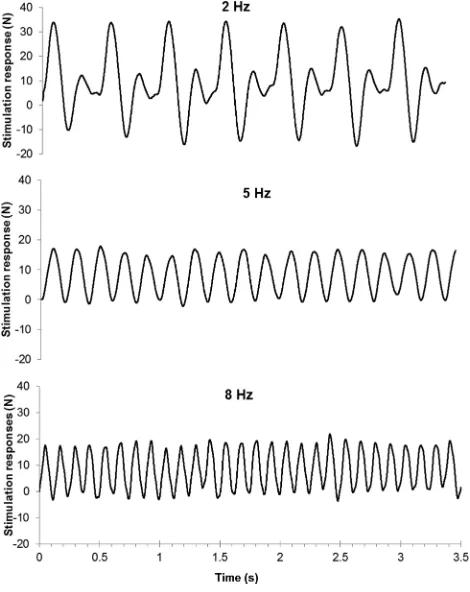
Stimulation responses were successfully evoked using all three stimulation frequencies (Figure 3). In gen-eral, trunk movements and stimulation responses in response to stimulation at 2 Hz were more notice-able visually, compared to the other two frequencies. Stimulation at 2 Hz resulted in the largest stimulation responses, mean (SD)=30.8 (8.8) N, whereas stimula-tion at 5 Hz, mean (SD)=19.6 (3.3) N, and 8 Hz, mean (SD)=19.7 (4.5) N, yielded comparable but smaller responses. There was a significant effect of stimulation frequency, F(2, 175) =134.9, p <0.01, on stimula-tion responses (Figure 4). No significant main effects of stimulation train,F(2, 175)=0.4,p=0.65, or sam-pling block,F(3, 175)=0.9,p=0.34, were evident, or any interaction effects of stimulation frequency, stim-ulation train, or sampling block,p>0.91.
Figure 3 Sample stimulation responses resulting from three different stimulation frequencies. Positive (+) values represent forces recorded from the load cell during trunk extension caused by muscle stimulation (i.e., positive values indicate load cell tension). Potential sources of the smaller, secondary negative and positive peaks, in response to 2 Hz stimulation, are discussed in the text.
2 Hz stimulation (mean=261 s), compared to 5 or 8 Hz (mean=85 s). Differences intpotbetween the four
[image:6.594.311.542.68.343.2]sampling blocks were not significant,F(3, 60)=1.2, p=0.32), and there was not a significant effect of the Frequency×Sampling Block interaction,F(6, 60)= 0.9, p = 0.45. Reliability of stimulation responses within each sampling block was in theexcellentrange (>0.85) for all combinations of stimulation frequency
Figure 4 Mean stimulation responses (error bars indicated
SDs) to the three stimulation frequencies during four sam-pling blocks (A) and three trains (B). Stimulation responses (forces) measured at 2 Hz were significantly (p<0.05) larger than the other two stimulation frequencies in all cases.
and sampling block (Table 1). Qualitatively, reliabil-ity within sampling blocks was highest for stimula-tion at 2 Hz and consistent across the four sampling blocks. Excellent reliability was also evident between sampling blocks, with the highest levels found for stim-ulation at 8 Hz and the lowest at 2 Hz. This same pattern was evident for the reliability of mean stimula-tion responses between sampling blocks. Reposistimula-tioning participants did not substantially influence reliability (Table 2). Specifically, ICCs in each of the three trains were excellent, with one exception (2 Hz, Train 3).
TABLE 1. Intraclass Correlation Coefficients (ICC) Values for Three Stimulation Frequencies
Within-SP ICC Between-SP ICC
SP 1 SP 2 SP 3 SP 4 Train 1 Train 2 Train 3 Between-SP Mean
2 Hz 0.96 0.93 0.91 0.96 0.84 0.83 0.81 0.84
5 Hz 0.89 0.94 0.85 0.89 0.88 0.91 0.93 0.91
8 Hz 0.91 0.89 0.94 0.84 0.96 0.95 0.89 0.96
[image:6.594.53.543.603.683.2]TABLE 2. ICC Values before and after Repositioning a Participant in the Experimental Fixture
Repositioning ICC
Train 1 Train 2 Train 3
2 Hz 0.87 0.84 0.76
5 Hz 0.94 0.82 0.94
8 Hz 0.97 0.88 0.97
These values were generally comparable with overall reliability between sampling blocks (Table 1), both in terms of magnitude and the influence of stimulation frequency.
4.
DISCUSSION
The objective of this study was to develop a method to measure stimulation responses of the lumbar trunk ex-tensors in the context of seated postures. Muscle stimu-lation responses were successfully generated across all participants in response to all three stimulation fre-quencies. Stimulation responses collected at 2 Hz in particular resulted in a mean response of 32 N, compa-rable to a value of 35 N in an earlier study (Vanoncini et al., 2006). Although the test condition was different than what was used here, the results from Vanoncini et al. (2006) are considered to at least provide relevant information regarding the magnitude of stimulation responses in a seated posture. All three frequencies of stimulation produced measurable responses to muscle contractions, and no substantial pain or skin irritation was either noticed or reported. Rather, participants indicated only minor discomfort caused by the stim-ulation, and some minor skin reddening was evident under the stimulation electrodes, which is considered a normal reaction to the long stimulation sessions in-volved (Baker et al., 1993).
As an important aspect of stimulation, muscle po-tentiation, was addressed. Potentiation is considered to be a result of phosphorylation of the myosin light chains and depends on the fiber type (Hanson, 1974; Houston, Green, & Stull, 1985). Specifically, Type II fibers are selectively and preferentially activated before Type I fibers by stimulation (Hanson, 1974; Sinacore et al., 1990). The lumbar extensors (e.g., the erector spinae and multifidus) have a high proportion of Type I fibers. However, the percentage of Type II fibers can reach 35–50% (Mannion et al., 1997; Thorstensson & Carlson, 1987), which emphasizes the importance of
potentiating the muscle first while using stimulation to measure stimulation responses from these muscles. In the current study, twitch potentiation was observed in all participants within the first 85–261 s of the con-ditioning trails. Compared to the 2 Hz stimulation frequency, less time was required to reach a steady state with 5 and 8 Hz frequencies. This inverse re-lationship between time-to-potentiation and stimula-tion frequency is consistent with existing studies of the knee extensors (Binder-Macleod, Dean, & Ding, 2002; Eom, Watanabe, Hoshimiya, & Khang, 2002) and ul-nar nerve (Griffin & Mettler, 2010). Eom et al. (2002) also indicated in their studies that the degree of force enhancement during potentiation decreased with the stimulation frequency, which was also observed in the current study. During muscle conditioning, substantial enhancements of stimulation responses were observed using all three test frequencies; approximate increases were 50, 30, and 30% in response to 2, 5, and 8 Hz stimulation, respectively. This again indicates the need for potentiation since measurements of stimulation responses without potentiation may introduce large variability to measured stimulation responses (Eom et al., 2002; Johnson et al., 1995a). As found here, muscle stimulation can lead to variable (increasing) magnitudes of stimulation responses (3050%) be-fore reaching a steady state. No consistent pattern of potentiation in stimulated responses was found in the second or third trains within a sampling block. In a few cases, though, a fast (within first two to three stimula-tion pulses) and slight increase (5%) in stimulation responses were observed at the start of these trains. Any effects of such increases were minimized, however, dur-ing calculation of mean stimulation responses usdur-ing truncated means. Since mean stimulation responses measured between several sampling blocks (Figure 4) were consistent, the conditioning train appeared suc-cessful at achieving a steady state in terms of stimu-lation responses, and it likely did not introduce any muscle fatigue.
the 2 Hz stimulation. Since the seated posture was not precisely controlled between different sampling blocks, the sitting position at each sampling block may have varied. Different sitting positions may result in differ-ent trunk movemdiffer-ent pattern and such differences may have contributed to the somewhat lower reliability be-tween different sampling blocks. Since 2 Hz stimulation provide more stable and larger stimulation responses, it is reasonable to expect more successful measurements in practical applications (e.g., to assess muscle fatigue). Stimulation at 5 and 8 Hz, in contrast, though it re-sulted in higher ICC values between sampling blocks, also yielded stimulation responses that were relatively lower in magnitude and less stable over the three stim-ulation trains.
Four potential difficulties need to be acknowledged. First, the most effective location of the stimulation electrode was achieved using protocols derived from earlier work (Baker et al., 1993; Vanoncini et al., 2006). However, isolation of different muscle groups may not be practically achievable. The lumbar extensors can be functionally divided into several different muscle groups, such as the erector spinae and multifidus, with the muscles structured in different layers making it difficult to identify that the exact target muscle group has been stimulated in vivo. However, stimulation re-sponse measurements here were done with participants sitting in the experimental fixture in a relatively con-trolled posture, which should ensure that the same muscles were stimulated at a similar electrode location within each sampling block. Therefore, the potential effects of changes in muscle “cross-talk” and in muscle geometry were assumed to be minimal. In addition, unlike voluntary muscle contraction, muscle contrac-tion induced by stimulacontrac-tion does not follow the size principle, and muscle fibers are instead recruited with-out obvious sequencing related to fiber types (Gregory & Bickel, 2005; Kubiak, Whitman, & Johnston, 1987). Instead, both slow and fast muscle fibers are nonselec-tively activated during muscle stimulation regardless of force levels (Gregory & Bickel, 2005). As such, the potential effect of differing recruitment patterns can be minimized through stimulation. Therefore, for fu-ture applications, it is reasonable to assume that any measured changes in stimulation responses using these procedures are (predominantly) the result of changes in muscle contractile status (e.g., muscle fatigue) ver-sus changes in muscle geometry and/or recruitment pattern. Further work will be completed to quantify the potential effects of trunk flexor and extensor
activ-ities on measured stimulation responses. In addition, it remains to determine whether stimulation responses remain reliable over longer blocks of measurement. For example, there may be important influences of diurnal, temperature, or electrode changes.
Second, the seated posture was not precisely con-trolled between sampling blocks, and the exact postures may have varied between different sampling blocks. Large postural changes could have introduced vari-ability in measured stimulation responses. One reason to select a sitting position for muscle stimulation is to match the conditions (e.g., posture) during the actual tasks we plan in future studies (of seated work tasks). By using similar conditions, physiological properties of muscles (e.g., muscle length) and levels of volun-tary contraction can be kept relatively consistent and thereby help in distinguishing fatigue from potential confounding influences. Therefore, the effect of sit-ting postures could perhaps be minimized by control-ling participant postures more precisely within and between different sampling blocks. In addition, moni-toring trunk angles (e.g., using a motion tracking sys-tem) may facilitate methods to account for changes in measured stimulation responses caused by postural differences.
Fourth, the potential contribution of voluntary mus-cle contraction to stimulation responses should not be neglected. Additional voluntary muscle contractions, above that needed to maintain posture, were not ob-served during pilot work. However, voluntary contrac-tions likely contributed to the negative and secondary positive peaks found in response to 2 Hz stimulation (see Figure 3) and may have also contributed to the initial positive peaks (that were the focus of the current analysis). More generally, these secondary peaks may also have resulted from contributions of reflexive be-haviors or from the contribution of trunk momentum (e.g., a “rebounding” effect following trunk displace-ment induced by stimulation). Future work is needed to better isolate the specific responses to stimulation, which would provide improved estimates of muscle status (e.g., fatigue).
Our long-term goal is to use muscle stimulation for detecting lumbar extensors fatigue during prolonged sitting. The developed method will be used to mea-sure muscle fatigue in a future study, specifically to as-sess situations involving prolonged sitting. At present, however, this approach may be limited to use in a lab-oratory environment, given the needs for a special seat and instrumentation. The current results suggest that stimulation at 2 Hz can provide suitable stimulation responses for this purpose. The higher responses cap-tured using 2 Hz are considered beneficial, to allow for better separation of the muscle responses to stim-ulation from any background noise. Further, stimula-tion at this frequency required reasonable time blocks for potentiation (4 min) and evoked stimulation re-sponses had excellent reliability. The current results indicated high levels of reliability within and between sampling blocks and trains for the protocol. While this suggests that only a single sampling train may be required, multiple sampling trains are recommended in future work to enhance the stability of obtained measures.
References
Baker, L., McNeal, D., Benton, L., Bowman, B., & Waters, R. (1993). Neuromuscular electrical stimula-tion: A practical guide (3rd ed.). Downey, CA: Rancho Rehabilitation Engineering Program, Rancho Los Ami-gos Medical Center.
Beers, M. H. (2003). The Merck manual of medical in-formation (2nd Home ed.). Whitehouse Station, NJ: Merck Research Laboratories.
Binder-Macleod, S. A., Dean, J. C., & Ding, J. (2002). Electrical stimulation factors in potentiation of human quadriceps femoris. Muscle and Nerve, 25(2), 271–279. Binder-Macleod, S. A., & Snyder-Mackler, L. (1993). Muscle fatigue: Clinical implications for fatigue assess-ment and neuromuscular electrical stimulation. Physi-cal Therapy, 73(12), 902–910.
Blangsted, A. K., Sjøaard, G., Madeleine, P., Olsen, H. B., & Søaard, K. (2005). Voluntary low-force contraction elicits prolonged low-frequency fatigue and changes in surface electromyography and mechanomyography. Journal of Electromyography and Kinesiology, 15(2), 138–148.
Bystr¨om, S., & Kilbom, ˚A. (1991). Electrical stimulation of human forearm extensor muscles as an indicator of handgrip fatigue and recovery. European Journal of Ap-plied Physiology and Occupational Physiology, 62(5), 363–368.
Cicchetti, D. V., & Sparrow, S. A. (1981). Developing criteria for establishing interrater reliability of specific items: Applications to assessment of adaptive behavior. American Journal of Mental Deficiency, 86(2), 127–137. Cooper, R. G., Edwards, R. H., Gibson, H., & Stokes, M. J. (1988). Human muscle fatigue: Frequency dependence of excitation and force generation. Journal of Physiol-ogy, 397, 585–599.
Crago, P., Peckham, P., Mortimer, J., & Van Der Meulen, J. (1974). The choice of pulse duration for chronic elec-trical stimulation via surface, nerve, and intramuscu-lar electrodes. Annals of Biomedical Engineering, 2(3), 252–264.
Crago, P. E., Peckham, P. H., & Thrope, G. B. (1980). Mod-ulation of muscle force by recruitment during intra-muscular stimulation. IEEE Transactions on Biomedi-cal Engineering, BME-27(12), 679–684.
Cram, J. R., & Rommen, D. (1989). Effects of skin prepa-ration on data collected using an EMG muscle-scanning procedure. Applied Psychophysiology and Biofeedback, 14(1), 75–82.
Dankaerts, W. P., O’Sullivan, P. P., Burnett, A. P., & Straker, L. P. (2006). Differences in sitting postures are associ-ated with nonspecific chronic low back pain disorders when patients are subclassified. Spine, 31(6), 698–704. Davies, C. T., & White, M. J. (1982). Muscle weakness fol-lowing dynamic exercise in humans. Journal of Applied Physiology, 53(1), 236–241.
Desmedt, J. E., & Hainaut, K. (1968). Kinetics of my-ofilament activation in potentiated contraction: Stair-case phenomenon in human skeletal muscle. Nature, 217(5128), 529–532.
Eom, G., Watanabe, T., Hoshimiya, N., & Khang, G. (2002). Gradual potentiation of isometric muscle force during constant electrical stimulation. Medical and Bi-ological Engineering and Computing, 40(1), 137–143. Fitch, S., & McComas, A. (1985). Influence of human
muscle length on fatigue. Journal of Physiology, 362, 205–213.
Ford, E. S., Kohl, H. W., Mokdad, A. H., & Ajani, U. A. (2005). Sedentary behavior, physical activity, and the metabolic syndrome among U.S. adults. Obesity, 13(3), 608–614.
Fowles, J. R., & Green, H. J. (2003). Coexistence of po-tentiation and low-frequency fatigue during voluntary exercise in human skeletal muscle. Canadian Journal of Physiology and Pharmacology, 81(12), 1092–1100. Gamet, D., Duchene, J., Garapon-Bar, C., & Goubel, F.
(1993). Surface electromyogram power spectrum in hu-man quadriceps muscle during incremental exercise. Journal of Applied Physiology, 74(6), 2704–2710. Gregory, C. M., & Bickel, C. S. (2005). Recruitment
pat-terns in human skeletal muscle during electrical stimu-lation. Physical Therapy, 85(4), 358–364.
Griffin, L., & Mettler, J. A. (2010). What are the stimu-lation parameters that affect the extent of twitch force potentiation in the adductor pollicis muscle? European Journal of Applied Physiology, 110(6), 1235–1242. Hakala, P. T., Rimpela, A. H., Saarni, L. A., &
Salmi-nen, J. J. (2006). Frequent computer-related activities increase the risk of neck-shoulder and low back pain in adolescents. European Journal of Public Health, 16(5), 536–541.
Hallal, P. C., Andersen, L. B., Bull, F. C., Guthold, R., Haskell, W., & Ekelund, U. (2012). Global physical activ-ity levels: Surveillance progress, pitfalls, and prospects. Lancet, 380(9838), 247–257.
Hanson, J. (1974). The effects of repetitive stimulation on the action potential and the twitch of rat muscle. Acta Physiologica Scandinavica, 90(2), 387–400.
Houston, M. E., Green, H. J., & Stull, J. T. (1985). Myosin light chain phosphorylation and isometric twitch po-tentiation in intact human muscle. Pfl¨ugers Archiv Eu-ropean Journal of Physiology, 403(4), 348–352. Johnson, P. W. (1998). The development, characterization
and implementation of a technique to measure muscle fatigue during computer use. University of California, Berkeley.
Johnson, P. W., Lehman, S. L., & Rempel, D. M. (1995a). Measuring low frequency fatigue with 2 Hertz stim-ulation. I. Stimulus-related potentiation effects. Paper presented at the Engineering in Medicine and Biology Society, IEEE 17th Annual Conference.
Johnson, P. W., Lehman, S. L., & Rempel, D. M. (1995b). Measuring low frequency fatigue with 2 Hertz stim-ulation. II. Muscle fatigue results. Paper presented at
the Engineering in Medicine and Biology Society, IEEE 17th Annual Conference.
Johnson, P. W., Lehman, S. L., & Rempel, D. M. (1996). Measuring muscle fatigue during computer mouse use. Paper presented at the Engineering in Medicine and Biology Society. Bridging Disciplines for Biomedicine. Proceedings of the 18th Annual International Confer-ence of the IEEE.
Kolich, M., Mohamed, A. I., & Taboun, S. M. (2001). Electromyographic comparison of two lumbar support mechanisms intended for automotive seating applica-tions. Proceedings of the Institution of Mechanical En-gineers. Part D, Journal of Automobile Engineering, 215(7).
Kubiak, R. J., Whitman, K. M., & Johnston, R. M. (1987). Changes in quadriceps femoris muscle strength using isometric exercise versus electrical stimulation. Jour-nal of Orthopaedic and Sports Physical Therapy, 8(11), 537–541.
Kufel, T. J., Pineda, L. A., & Mador, M. J. (2002). Com-parison of potentiated and unpotentiated twitches as an index of muscle fatigue. Muscle and Nerve, 25(3), 438–444.
Mannion, A. F., Dumas, G. A., Cooper, R. G., Espinosa, F. J., Faris, M. W., & Stevenson, J. M. (1997). Muscle fibre size and type distribution in thoracic and lumbar regions of erector spinae in healthy subjects without low back pain: Normal values and sex differences. Journal of Anatomy, 190(4), 505–513.
McLean, L., & Goudy, N. (2004). Neuromuscular response to sustained low-level muscle activation: Within- and between-synergist substitution in the tri-ceps surae muscles. European Journal of Applied Phys-iology, 91(2), 204–216.
Merletti, R., Knaflitz, M., & DeLuca, C. J. (1992). Elec-trically evoked myoelectric signals. Critical Reviews in Biomedical Engineering, 19(4), 293–340.
Mork, P. J., & Westgaard, R. H. (2005). Long-term elec-tromyographic activity in upper trapezius and low back muscles of women with moderate physical activity. Journal of Applied Physiology, 99(2), 570–578. Mork, P. J., & Westgaard, R. H. (2009). Back posture and
low back muscle activity in female computer workers: A field study. Clinical Biomechanics 24(2), 169–175. Nagata, S., Arsenault, A. B., Gagnon, D., Smyth, G., &
Mathieu, P. A. (1990). EMG power spectrum as a mea-sure of muscular fatigue at different levels of contrac-tion. Medical & Biological Engineering & Computing, 28(4), 374–378.
Oberg, T., Sandsjo, L., & Kadefors, R. (1994). Subjective and objective evaluation of shoulder muscle fatigue. Ergonomics, 37(8), 1323–1333.
Oberg, T., Sandsjo, L., Kadefors, R., & Larsson, S. E. (1992). Electromyographic changes in work-related myalgia of the trapezius muscle. European Journal of Applied Physiology and Occupational Physiology, 65(3), 251–257.
O’Sullivan, P. B., Mitchell, T., Bulich, P., Waller, R., & Holte, J. (2006). The relationship beween posture and back muscle endurance in industrial workers with flexion-related low back pain. Manual Therapy, 11(4), 264–271.
Pleis, J. R., Lucas, J. W., & Ward, B. W. (2009, Decem-ber). Summary health statistics for U.S. adults: National Health Interview Survey, 2008. Vital and Health Statis-tics. Series 10, Data from the National Health Survey (242), 1–157.
Rassier, D. E., & MacIntosh, B. R. (2000). Coexistence of potentiation and fatigue in skeletal muscle. Brazilian Journal of Medical and Biological Research, 33, 499– 508.
Rothenberg, T. J., Fisher, F. M., & Tilanus, C. B. (1964). A note on estimation from a Cauchy sample. Journal of the American Statistical Association, 59(306), 460–463. Sinacore, D. R., Delitto, A., King, D. S., & Rose, S. J. (1990). Type II fiber Activation with electrical stimulation: A preliminary report. Physical Therpy, 70(7), 416–422. Sjøgaard, G., Kiens, B., Jørgensen, K., & Saltin, B. (1986).
Intramuscular pressure, EMG and blood flow during low-level prolonged static contraction in man. Acta Physiologica Scandinavica, 128(3), 475–484.
Small, S. C., & Stokes, M. J. (1992). Stimulation frequency and force potentiation in the human adductor pollicis muscle. European Journal of Applied Physiology and Occuputational Physiology 65(3), 229–233.
Søgaard, K., Blangsted, A. K., Jørgensen, L. V., Madeleine, P., & Sjøgaard, G. (2003). Evidence of long term mus-cle fatigue following prolonged intermittent contrac-tions based on mechano- and electromyograms. Jour-nal of Electromyography and Kinesiology, 13(5), 441– 450.
Sood, D., Nussbaum, M. A., & Hager, K. (2007). Fatigue during prolonged intermittent overhead work: Relia-bility of measures and effects of working height. Er-gonomics, 50(4), 497–513.
Thorstensson, A., & Carlson, H. (1987). Fibre types in human lumbar back muscles. Acta Physiologica Scan-dinavica, 131(2), 195–202.
U.S. Department of Health and Human Services. (1996). Physical activity and health: A report of the Surgeon General. Atlanta, GA: U.S. Department of Health and Human Services, Public Health Service, CDC, National Center for Chronic Disease Prevention and Health Promotion.
van Die¨en, J. H., de Looze, M. P., & Hermans, V. (2001). Effects of dynamic office chairs on trunk kinematics, trunk extensor EMG and spinal shrinkage. Ergonomics, 44(7), 739–750.
van Die¨en, J. H., Westebring-van der Putten, E. P., Kingma, I., & de Looze, M. P. (2009). Low-level activity of the trunk extensor muscles causes electromyographic manifestations of fatigue in absence of decreased oxy-genation. Journal of Electromyography and Kinesiol-ogy, 19(3), 398.
Vanoncini, M., Holderbaum, W., & Andrews, B. J. (2006). Investigations on the biomechanics of the human trunk. Proceedings of the 24th IASTED International Confer-ence on Biomedical Engineering. Anaheim, CA: ACTA Press.
Varo, J. J., Martinez-Gonzalez, M. A., de Irala-Estevez, J., Kearney, J., Gibney, M., & Martinez, J. A. (2003). Distribution and determinants of sedentary lifestyles in the European Union. International Journal of Epidemi-ololgy, 32(1), 138–146.
Vollestad, N. K. (1997). Measurement of human muscle fatigue. Journal of Neuroscience Methods, 74(2), 219– 227.
Wilcox, R. R., & Keselman, H. J. (2003). Modern robust data analysis methods: Measures of central tendency. Psychological Methods 8(3), 254–274.