2018 International Conference on Computer, Communication and Network Technology (CCNT 2018) ISBN: 978-1-60595-561-2
How Does Corruption affect International Trade? Comparative Analysis
of Developing and Developed Countries
Mei-ling WANG, Cun-fang LI and Wei WANG
*School of Business, Jiangsu Normal University, China
*
Corresponding author
Keywords: Corruption perceptions index, Developing & developed countries, International trade.
Abstract. This paper analyzes the effect of corruption on international trade volume. It also compares the different effects between developing and developed countries with panel data over the period from 2005 to 2014 for 58 countries. The findings show that corruption perceptions index is positively related to the level of trade volume. It has more of a powerful influence on developing countries’ trade volumes than on developed countries’ trade volumes. To increase the trade volume of developing and developed countries, enhancing the transparency policy must be put into practice.
Introduction
Corruption hinders economic development and has become a common problem in many countries around the world. In order to combat and eliminate corruption, in 2003, the United Nations passed the United Nations Convention against Corruption. It is the first time in history that the United Nations has used a guide for the international legal documents in the struggle of anti-corruption. In 2010, the G20 Anti-Corruption Action plan reported that corruption is a severe impediment to economic growth, and a significant challenge for developed, emerging, and developing countries.[ Plan, A. C. A. (2010). G20 Agenda for Action on Combating Corruption, Promoting Market Integrity, and Supporting a Clean Business Environment, G20 Seoul summit.]
From 1995 up until 2016, Transparency International (TI) developed from 45 countries to 176 countries. It then evaluated the extent of corruption in these countries. The corruption perceptions index is arranged within the range from 0 to 100. The 0 stands for the most rampant corruption, while the 100 stands for the most honest and upright. According to Transparency International statistics, in 2016, Denmark and New Zealand scored 90 points and tied for the first place. Finland and Sweden came second and third, scoring 89 points and 88 points respectively. Thus, the countries with the best corruption perception index are, in general, the ones with political democracy and more developed economies.
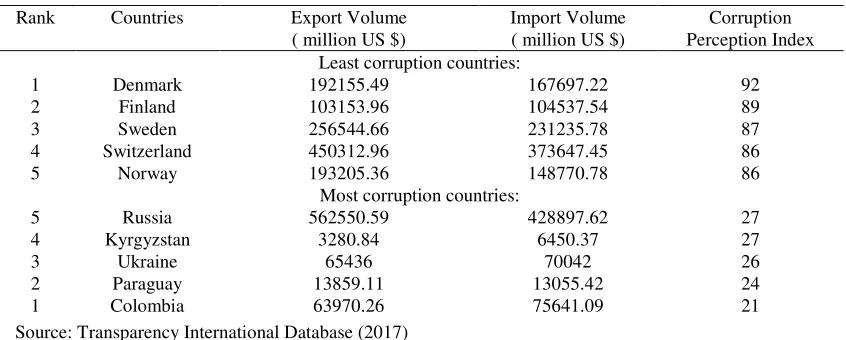
Table 1 shows the five higher CPI countries and the five lower CPI countries in the 58 countries which were used in this study. As you can see, the higher CPI countries have the highest export and import volume. The lower the CPI, the lower the import and export volumes are for those countries. For example, in 2014, Denmark was the highest country with a CPI of 92 points. The Denmark imports and exports were respectively 192155.49 million and 167697.22 million. Among the five lowest CPI countries, Colombia is the last country with a CPI of 21 points. It also has the highest corruption problems. The Colombian imports and exports are respectively 63970.26 million and 75641.09 million.
Therefore, the purpose of this paper is to analyze how the corruption effect trade volume in terms of exports and imports between developing and developed countries by using panel data from the period 2005 to 2014 for 58 countries. Using the empirical results, we suggest some constructive implications for developed and developing countries respectively.
Table 1. Least and Most Corrupt Countries in 58 countries of this study in 2014.
Rank Countries Export Volume
( million US $)
Import Volume ( million US $)
Corruption Perception Index Least corruption countries:
1 Denmark 192155.49 167697.22 92
2 Finland 103153.96 104537.54 89
3 Sweden 256544.66 231235.78 87
4 Switzerland 450312.96 373647.45 86
5 Norway 193205.36 148770.78 86
Most corruption countries:
5 Russia 562550.59 428897.62 27
4 Kyrgyzstan 3280.84 6450.37 27
3 Ukraine 65436 70042 26
2 Paraguay 13859.11 13055.42 24
1 Colombia 63970.26 75641.09 21
Source: Transparency International Database (2017)
Literature References
Recently, the subject of corruption has been reported by economists. They explained variation in corruption levels in terms of integration into international economy, and found that the levels of corruption were higher, the lower the degree of integration that was in the world economy [2]. Similarly, They assess the determinants of corruption in developing countries, and point out that economic determinants (economic freedom, globalization, level of education, and average level of income) were negatively related to the perceived level of corruption [3].
In general, bribe taking was more likely in countries with low per capita income and lower disparities in income distribution [4]. Because of this, developing trade with less corrupt trade partners led to lower corruption levels [5]. They show that the quality and level of openness effect corruption.
The corruption has been used frequently in recent studies to analyze corruption that hindered international trade. For instance, some studies confirm the effects of corruption on international trade, especially corruption in an exporting economy from that in an importing economy. They found that corruption hindered international trade, however, bribe paying to customs may enhance imports in importing countries with inefficient customs [6]. The corruption in the importing country to have a strong negative impact on service trade [7].
On the contrary, Trade liberalization, corruption, and software piracy was assessed. They empirically show corruption as a mediator that affects economic freedom and software piracy. They also found that nations with few trade barriers may cause lower levels of corruption [8]. In contrast, The relationship between corruption and trade intensity (or country size) had weakened or disappeared [9]. Trade restrictiveness and corruption have a weak relation as do trade openness and corruption when controlled by other variables impacted by corruption [10].
Meanwhile, studies demonstrates that political and trade liberalizations increase corruption. They found that trade liberalizations may lead to an increase in the corruption such as abuse of power [11]. However, bribes can reduce tariffs, making tariff liberalization schemes is unlikely to affect the extensive and intensive profit of firms’ import in pervasive corruption background [12].
Empirical Methodology
Model
Model (I) makes the independent variables GDP, unemployment, population, and corruption perceptions index; the dependent variable export volume.
(1) Where
EXit = the export volume of country in year t,
GDPit = the GDP of country in year t, POPit = the population of country in year t, UNEMit= the unemployment of country in year t,
CPIit= the corruption perceptions index of country in year t,
Model (II) makes the independent variables GDP, unemployment, population, and corruption perceptions index; the dependent variable import volume.
(2) Furthermore, the international trade data set uses import and export volume in a country and this data come from the World Bank Database. The independent variables such as GDP, population and unemployment also come from the World Bank Database. The corruption perceptions index (CPI) data is taken from the Transparency International Database. The developed countries includ Austria, Belgium, Canada, Cyprus, Czech Republic, Denmark, Estonia, Finland, France, Germany, Greece, Iceland, Ireland, Italy, Luxembourg, Malta, Netherland, Norway, Portugal, Slovenia, South Korea, Spain, Sweden, Switzerland, United Kingdom, United States. And the developing countries includ Armenia, Belarus, Bolivia, Brazil, Bulgaria, China, Colombia, Costa Rica, Dominican Republic, Ecuador, El Salvador, Georgia, Honduras, Hungary, Indonesia, Kazakhstan, Kyrgyz Republic, Latvia, Lithuania, Mexico, Moldova, Panama, Paraguay, Peru, Poland, Romania, Russian Federation, Slovak Republic, Thailand, Turkey, Ukraine, Uruguay.
Result
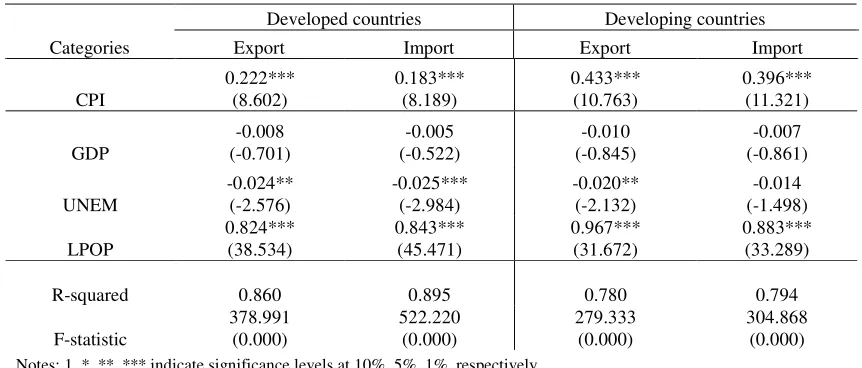
The corruption perceptions index variable has more of a significant effect on export and import volume in developing countries (export: b=0.433, t=10.763; import: b=0.396, t=11.321), than in developed countries (export: b=0.222, t=8.602; import: b=0.183, t=8.189). This result states that because the corruption perceptions index level is higher, it will have more of a positive effect on exports and imports in developing countries than in developed countries. It is worth highlighting the fact that a 1% improvement of Corruption perceptions index increase the export volume rate by 0.433% in developing countries and by 0.222% in developed countries. Meanwhile, a 1% improvement of corruption perceptions index increase the import volume rate by 0.396%, but decrease the import volume by 0.183% in developed countries. To see improvement in developing countries, the corruption perceptions index plays a very important role. The higher the corruption perceptions index (namely incorruptness), the more exports and imports in developing countries than in developed countries.
The GDP variable does not have an effect on trade in developing (export: b=-0.010, t=-0.845; import: b=-0.007, t=-0.861) and developed countries (export: b=-0.008, t=-0.701; import: b=-0.005, t=-0.522). The unemployment variable has more of a negative effect on exports in developed countries (b=-0.024, t=-2.576), than in developing countries (b=--0.020, t=-2.132). However, the unemployment rate has more of a negative effect on imports in developed countries (b=-0.025, t=-2.984), it does not have an effect on imports in developing countries (b=-0.014, t=-1.498). The population variable always presents a significant positive sign on exports and imports in developing countries (export: b=0.967, t=31.672; import: b=0.883, t=33.289) and developed countries (export: b=0.824, t=38.534; import: b=0.843, t=45.471).
transparency. Higher corruption levels for exports were mainly embodied in the inefficient customs operations, long time of customs clearance and complicated procedures.
Table 2. CPI Impact on Export and Import volume.
Categories
Developed countries Developing countries
Export Import Export Import
CPI 0.222*** (8.602) 0.183*** (8.189) 0.433*** (10.763) 0.396*** (11.321) GDP -0.008 (-0.701) -0.005 (-0.522) -0.010 (-0.845) -0.007 (-0.861) UNEM -0.024** (-2.576) -0.025*** (-2.984) -0.020** (-2.132) -0.014 (-1.498) LPOP 0.824*** (38.534) 0.843*** (45.471) 0.967*** (31.672) 0.883*** (33.289)
R-squared 0.860 0.895 0.780 0.794
F-statistic 378.991 (0.000) 522.220 (0.000) 279.333 (0.000) 304.868 (0.000)
Notes: 1. *, **, *** indicate significance levels at 10%, 5%, 1%, respectively. 2. Values in ( ) denotes the P-value.
Summary
The corruption perceptions index is positively related to the level of trade volume. It also has a more positive influence on developing countries’ trade volumes than on developed countries’ trade volumes. In more detail, we discovered that the CPI was approximately 2 times more beneficial in developing countries’ exports compared to developed countries. We also discovered that the improvement of CPI was approximately 2.2 times more beneficial in developing countries’ imports than in developed countries. It can be presumed that due to the inefficiency of developing countries work process, the cost is a huge burden for the corporations in developing countries trade. Enhancing the transparency in the public sector for the process of exports and imports will be put into practice.
Acknowledgement
This research was financially supported by the National Science Foundation (Program No.: 71573110).
References
[1]Plan, A. C. A., G20 Agenda for Action on Combating Corruption, Promoting Market Integrity, and Supporting a Clean Business Environment, G20 Seoul summit, (2010).
[2]W. Sandholtz, and W. Koetzle, Accounting for corruption: Economic structure, democracy, and trade. International studies quarterly, 44(1), (2000) 31-50.
[3]G. Shabbir, and M. Anwar. Determinants of corruption in developing countries. The Pakistan Development Review, (2007) 751-764.
[4]R. Sanyal, Determinants of bribery in international business: The cultural and economic factors. Journal of Business Ethics, 59(1), (2005) 139-145.
[5]O. Gokcekus, J. Knörich, Does quality of openness affect corruption?. Economics Letters, 91(2), (2006) 190-196.
[7]L. A. Grünfeld, A. Moxnes, The intangible globalization: Explaining the patterns of international trade in services. (2003).
[8]C. Robertson, K. M. Gilley, W. F. Crittenden, Trade liberalization, corruption, and software piracy. Journal of Business Ethics, 78(4), (2008) 623-634.
[9]S. Knack, and O. Azfar, Trade intensity, country size and corruption. Economics of Governance, 4(1), (2003) 1-18.
[10]A. Senderovic, Trade Restrictiveness or Trade Openness? The Effects on Corruption: A panel data study of the relation between trade restrictiveness and corruption in Europe. (2009).
[11]S. C. Tavares, Do rapid political and trade liberalizations increase corruption? European Journal of Political Economy, 23(4), (2007) 1053-1076.