2018 International Conference on Computational, Modeling, Simulation and Mathematical Statistics (CMSMS 2018) ISBN: 978-1-60595-562-9
Passenger Transfer Conflict Delay in Large Passenger Transport Hubs
Cheng-yuan MAO
1,*, Ying-hao QIU
1, Li-xia SHAO
2and Kan ZHOU
3 1College of Engineering, Zhejiang Normal University, Jinhua, China2Faculty of Architectural, Civil Engineering and Environment, Ningbo University, Ningbo, China
3Shenzhen Municipal Design & Research Institute Co. Ltd, Shenzhen, China
*Corresponding author
Keywords: Passenger transport hub, Layout optimization, NetLogo; Passengers’ transfer facilities, Conflict delay.
Abstract. In the passenger transfer process, passenger congestion conflict is a very important factor in transfer delays in large passenger transport hubs. By analyzing passenger walking speed, passenger arrival rate, the capacity of walking facilities and passengers’ expected travel time, a model for calculating conflict delay in the passenger transfer process is established in this paper. The relationship between the average delay due to passenger conflict, the arrival rate and the absolute value of the difference in passenger arrival rates from different directions is calculated, and a simulation platform of passenger travel behavior, which is based on NetLogo, is established to simulate the passenger transfer conflict process. The outcomes verify that the model is effective, feasible and accurate. Therefore, the research results make great contributions towards the evaluation of the layout plans of passenger transfer facilities in large hubs, and provide a theoretical foundation for perfecting hub transfer facilities.
Introduction
In recent years, with the rapid development of the Chinese society and economy, many urban, comprehensive passenger transfer hubs have been built in China’s cities. Rapid transportation has brought great convenience to people's travel, which has attracted large volumes of passengers, for example on high-speed rail. However, this has led to conflicts in the flow in hubs at peak hours, which inconveniences and causes discomfort to the passengers, while seriously affecting the transfer efficiency. Therefore, domestic and foreign scholars have conducted much research exploring the topic from different directions.
From the aspect of hub transfer delay, scholars have carried out a great deal of research on flight delays [Santos et al., 2010; Wesonga et al., 2012] and train delays [Briggs, et al., 2007; Yuan et al., 2007], looking for example at the causes of such delays, the relevant factors and improvement measures, etc, but focusing less on the analysis of passenger transfer time. Landeghem [Landeghem et al., 2002] surveyed passenger boarding times in different boarding modes, and proposed an improved boarding mode for reducing passenger boarding times, based on a simulation method. Also looking to reduce boarding times, Steffen [Steffen, 2008] researched the best boarding order of passengers using the Markov Monte Carlo optimization algorithm and computer simulation. Tang [Lee et al. 1991] constructed a boarding model considering the characteristics of passengers, again to investigate boarding times under different boarding modes. Comparing total boarding times and boarding delays under three kinds of boarding policy, the author found the most effective boarding strategy to be one that considered the number of passenger seats and the passengers’ own characteristics.
between departure times of coordinated bus lines. HSU [Hsu et al., 2010] established a passenger transfer time estimation model in a multi-mode [including buses, trains, taxis etc] transfer hub, which analyzed the transfer vehicle arrival interval and the vehicle capacity effect on the transfer time. Solak [Solak et al., 2009] studied the problem of airport planning with regards to the overall service capacity, creating a function to estimate the maximum passenger transfer time. By quantitatively analyzing the relationship between passengers’ transfer time, passengers’ costs and passenger complaint ratio, Bhadra [Bhadra et al., 2009] found that passengers pay more attention to the transfer time than the cost. Chowdhury [Chowdhury et al., 2002] pointed out that the transfer time is one of the most important indicators in the evaluation of multi-mode transfer services, and provided a vehicle departure time optimization method.
Domestic scholars have carried out a lot of research on vehicle travel times. However, the study of passenger transfer times in hubs is not sufficiently mature, and there is a lack of theory and a systematic analysis method. Shen Y.S.[ Shen et al., 2009 ]built a passenger time delay model for stairs and escalators using queuing theory, and discussed the influence on the time delay of the number of passengers and width of stairs. Xie Z.Y. [Xie et al, 2012] pointed out that the transfer time delay is an important parameter, which results from queuing, congestion and waiting, and explained the mechanism of transfer delays. Qi K. [Qi et al., 2012; Qi et al., 2011] studied the generalized cost of passenger transfers in passenger hubs, calculating the transfer conflict delay in passenger hubs based on the conflict delay for vehicles at unsignalized intersections. He also analyzed and calculated the passengers’ travel time in passenger hub channels, but ignored the huge difference between motor vehicle and pedestrian traffic.
Zhao L. [Zhao et al., 2011] analyzed the transfer delays in all kinds of transportation facilities in rail transportation hubs. She considered congestion delay to be the cause of transfer delays in channel class facilities, and obtained the function of this delay using pedestrian flow theory and the Taylor series. Next, she considered the queuing delay to cause delays in service class facilities, and obtained the function of this delay using the area method. Finally, she considered the waiting delay to be the cause of delays in riding class facilities, and obtained the function of this delay by using a Taylor series to approximate the arrival of passengers. Du P. [Du et al., 2009] studied the passenger travel time in a subway station transfer channel, finding it to approximately follow a lognormal distribution, finding crowding to interact with the travel time mean and variance, and finding a secondary relation between the travel time and the transfer channel length within a certain range. Xie L.H. [Xie et al., 2010] studied the waiting times of passengers transferring from rail to BRT [Bus Rapid Transit] and qualitatively described the factors affecting passenger transfer time. Ma H.[ Ma et al., 2010; Mao et al., 2015] quantitatively analyzed the influencing mechanism of mass transit hub transfer efficiency using a neural network model, and simulated the transfer behavior of passengers and rail network passengers using Petri net, before optimizing the transfer efficiency of passengers based on the simulation results.
In summary, domestic and foreign scholars have conducted much meaningful research on pedestrian transfer delays and pedestrian characteristics, with the results more heavily concentrated on the layout of functional areas, and the characteristics of pedestrian queuing and pedestrians, but less heavily concentrated on conflict delays to transfer times. Thus, this paper expands on the existing research.
Transfer Conflict Delay Model
Expected Walking Time
In large passenger hubs, passengers require multiple travel facilities (channel transfer hall, stairs, escalators, etc.) to complete the transfer process. If a passenger requires n travel facilities to complete the entire transfer, then the passenger’s distance traveled in the i th travel facility is Li. If
the expected traveling speed (FFS) is vdi, then the expected travel time over the whole transfer
1
n i des
i di
L t
v
(1)Where tdes——the average expected travel time, in s;
n——number of walking facilities;
i
L——the length of walking facility i, in m;
di
v ——the expected traveling speed on walking facility i, in m/s
If the walking facility is a staircase or escalator, then Li is the vertical height, and vdi is the
running speed in the vertical direction.
When it comes to travel facilities [escalator or stairs], the distance traveled refers to the vertical height of the escalator or stairs, and the expected traveling speed on the escalator refers to the speed of the escalator in the vertical direction, which is determined by the electrical equipment of the escalator.
Congestion Delay
According to the definition of congestion delay, it is equal to the travel time minus the expected time spent on the travel facilities, as in the following equation:
( )
d d
crowd walk des
d d
L v v L L
t t
v v vv
(2)
Where dcrowd——congestion delay, s;
walk
t ——walking time, s;
des
t ——expected walking time, s;
L——distance walked, m;
v——actual walking speed, m/s;
d
v ——expected walking speed, m/s.
Capacity of Walking Facilities
According to Equation2, the key to calculating the congestion delay is obtainingtwalk, and in order to
get twalk, we should analyze the capacity of the walking facilities firstly.
The capacity of a travel facility is the maximum number of passengers per unit of time and section. When the arriving passenger flow is constant, the travel capacity of the facilities directly determines the passengers’ travel delay. The relationship between the passenger flow rate and the passenger density in a one-way passage is as follows:
2
q 0.395k 1.362k (3)
Where q ——passenger flow rate, p/(s∙m); k ——passenger density, p/m2.
The passenger flow in the channel is as follows:
2
QT ( 0.395k 1.362 )k WT (4)
Where QT——passenger flow in the channel, p/s;
T
W ——passageway width, m.
The maximum number of passengers in the channel (the capacity of the channel) is as follows:
QTMAX 1.174WT (5)
0.418 S
us max W
Q (6)
0.472 S
ds max W
Q (7)
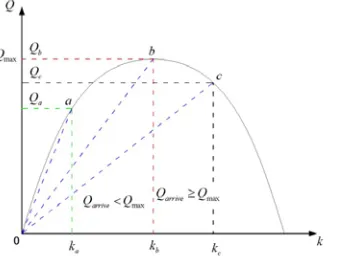
On the basis of the above analysis, when the arrival passenger flow Qarrive is less than the
capacity of the walking facilities, Qmax, the passenger traffic is smooth; when Qarrive Qmax, then the
[image:4.612.225.394.192.320.2]arriving passengers cannot evacuate in a timely fashion, the passageway becomes congested, and the queue length and walking delay will grow. The mechanism of congestion in a one-way passage is illustrated in Figure 1. This paper only considers the condition whereQarriveQmax.
Figure 1. Mechanism of congestion in a one-way passage.
Calculation of Congestion Delay under the Condition WhereQarriveQmax.
Taking a one-way passage as an example, if the passengers' arrival times follow a negative exponential distribution, and the passengers are uniformly distributed in the passage, withQarriveQmax, then the number of arriving passengers is equal to the number of leaving ones,
arrive max
Q Q Q , and the density of passengers in the passage equals:
1.362 1.855 1.58( / ) k
0.79
arrive T
Q W
(8) According to the relationship between the velocity and density, the passengers’ average walking speed equation is as follows:
v 0.395k 1.362 (9) Wherev——the passengers’ average walking speed, m/s;
k——density of passengers, p/m2;
Substituting Equation 8 into Equation 9, the passengers’ average walking speed equals:
v 0.681 0.464 0.395( Qarrive/WT) (10) Substituting Equation10 into Equation 2, the congestion delay equals:
( v)
v
d crowd
d
L v d
v
(11)
In order to verify the effectiveness of Equation 11, a passengers’ walking simulation platform was built using the simulation software NetLogo. Take a one-way passage of length 10m and width 6m to simulate the passengers’ travel behavior. The scatter diagram between the passenger arrival rate and the congestion delay is shown in Figure 2, and the comparison of the simulation and calculation of the congestion delay is shown in Figure 3.
From the figures, when Qarrive Qmax, the average relative error between the calculation and the
relative error between the calculation and the simulation is 27.14%, indicating that Equation 11 for the congestion delay calculation is reasonable.
Figure 2. Scatter diagram between passengers’ arrival rate and congestion delay.
Figure 3. Comparison of simulation and calculation of congestion delay.
Similarly, when QarriveQmax, the duscrowd and ddscrowd equations are as follows, where H is the
total height of the stairs:
( 0.145 0.021 0.05( / ))
(0.145 0.021 0.05( / ))
d arrive S
uscrowd
d arrive S
H v Q W
d
v Q W
(12)
( 0.196 0.038 0.081( / ))
(0.196 0.038 0.081( / ))
d arrive S
dscrowd
d arrive S
H v Q W
d
v Q W
(13)
Simulation Analysis
Data Acquisition Method
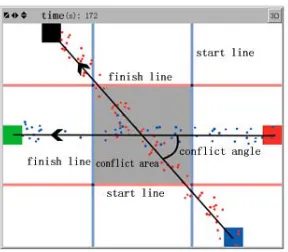
The passenger crossover clash delay is influenced by the number and angles of cross-conflicts per unit time. Thus, the different passenger arrival rates and passenger crossover clashes under different conflict angles are simulated using the passengers’ travel behavior simulation platform, and the results are shown in Figure 4.
[image:5.612.236.380.243.369.2]Figure 4. Simulation of passenger crossing conflict.
Figure 5. The crossing conflict region.
In the simulation, the moments when each passenger crosses the start and stop lines are recorded, and the crossing conflict delay is the difference between the expected travel time and the actual travel time. The calculation is as follows:
sin( )
c c c
d
L d T
v
(14)
Wheredc——crossing conflict delay, s;
c
T ——walking time to pass the conflict area, s;
c
L ——distance between start and finish lines, m;
d
v ——expected walking speed, m/s;
——conflict angle.
Effect of Conflict Angle on Conflict Delay
Figure 6. Relationship between conflict angle and conflict delay.
Effect of Passenger Arrival Rate on Conflict Delay
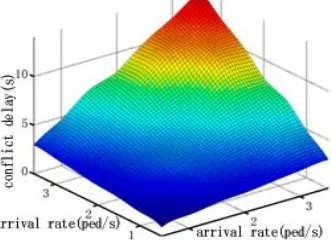
[image:7.612.194.417.328.441.2]Again, under different conflict angles, the passengers’ walking mode was simulated. By changing the passengers’ arrival rate, the simulation platform produced average delay data, with 1000 passengers’ average conflict delay as the final simulation result, and each scenario repeated 10 times. At a conflict angle of 130°, 49 groups of data of passenger arrival rates and conflict delays were obtained, as shown in Figure 7. The curved surface is shown in Figure 8.
Figure 7. Three-dimensional scatter diagram between arrival rate and crossing conflict delay.
Figure 8. Curved surface of arrival rate and conflict delay.
According to Figure 8, the passengers’ average delay will increase with the total passenger arrival rate.
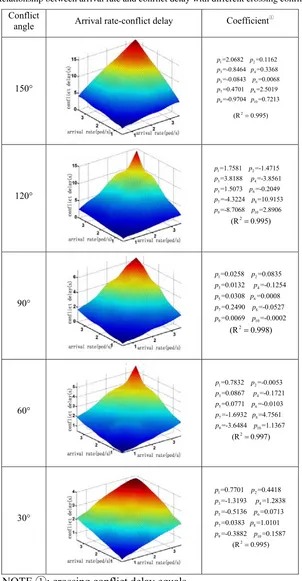
[image:7.612.225.391.468.591.2]Table 1. Relationship between arrival rate and conflict delay with different crossing conflict angles.
Conflict
angle Arrival rate-conflict delay Coefficient ① 150° 1 2 3 4 5 6 7 8 9 10
=2.0682 =0.1162 =-0.8464 =0.3368 =-0.0843 =0.0068 =0.4701 =2.5019 =-0.9704 =0.7213
p p p p p p p p p p 2
(R 0.995)
120° 1 2 3 4 5 6 7 8 9 10
=1.7581 =-1.4715 =3.8188 =-3.8561 =1.5073 =-0.2049 =-4.3224 =10.9153 =-8.7068 =2.8906
p p p p p p p p p p 2 (R 0.995)
90° 1 2 3 4 5 6 7 8 9 10
=0.0258 =0.0835 =0.0132 =-0.1254 =0.0308 =0.0008 =0.2490 =-0.0527 =0.0069 =-0.0002
p p p p p p p p p p 2
(R 0.998)
60° 1 2 3 4 5 6 7 8 9 10
=0.7832 =-0.0053 =0.0867 =-0.1721 =0.0771 =-0.0103 =-1.6932 =4.7561 =-3.6484 =1.1367
p p p p p p p p p p 2
(R 0.997)
30° 1 2 3 4 5 6 7 8 9 10
=0.7701 =0.4418 =-1.3193 =1.2838 =-0.5136 =0.0713 =0.0383 =1.0101 =-0.3882 =0.1587
p p p p p p p p p p 2
(R 0.995)
NOTE ①: crossing conflict delay equals
2 3 4 2 3 4 5
1 2 3 4 5 6 7 8 9 10
c
d p p xp x p x p x p y p y p y p y p y (15)
Where dc——average crossing conflict delay at conflict angle, s; x——absolute value of passenger arrival rate, p/s;
p——correction coefficient.
Calculation of Crossing Conflict Delay
On the basis of the above analysis, the average passenger conflict delay is affected by the total passenger arrival rate, the passenger arrival rates in different directions, and the conflict angle. The first two factors show a similar relationship to the average delay and conflict. Thus, the conflict impact angle formula is introduced to explain the relationship between the three factors and the average conflict delay, as shown in Equation 16(R2=0.981), and the optimized values are shown in
Table2.
1511 12y 13 y exp( 11 16)
p c c
[image:9.612.76.536.232.364.2]d d p xp p x p p (16)
Table 2. Optimized parameters of crossing conflict delay calculation model.
Coefficient Optimized value Coefficient Optimized value
P1 0.226 P9 -4.4306
P2 0.1969 P10 1.5354
P3 0.0022 P11 0.3085
P4 0.0005 P12 -4.4171
P5 -0.0171 P13 3.8387
P6 0.0034 P14 2.5002
P7 -1.1149 P15 0.2861
P8 4.6195 P16 -13.4055
After calculating conflict angles of 45° and 135°usingthe above equation, the crossing conflict delays for each passenger arrival rate were calculated and the comparative results are shown in Fig.10 and Fig.11. The maximum relative error compares the results with the simulation results, showing the equation for crossing conflict delay to be valid.
Conclusions
Passenger transfer delay is an important index for evaluating the service level of a passenger transport hub. Meanwhile, conflict between passengers is an important factor affecting passengers’ transfer delay and comfort. This paper analyzed the passengers’ walking characteristics, arrival rate and crossing conflict angle, which have a significant impact on the transfer delay.
The following conclusions can be drawn:
(1) This paper proposed a passenger conflict delay model, and gave the main influencing factors of the model, including the passenger walking speed, the passenger arrival rate, the walking facility capacity, and the passenger expected travel time.
(2) According to the Levenberg-Marquardt algorithm, a solution algorithm for the proposed model was studied.
(3) Using the simulation software NetLogo, a passengers’ walking simulation platform for a large transfer hub was built, and the effectiveness and accuracy of the proposed model was verified.
Acknowledgment
This research was financed by the Natural Science Foundation of Zhejiang (No. LY18G030021 & No. LY18E080021) and traffic and Transportation Committee of Ningbo (No. 811703660)
References
[2] Ronald Wesonga, Fabian Nabugoomub, Peter Jehopio. Parameterized framework for the analysis of probabilities of aircraft delay at an airport. Journal of Air Transport Management, 2012, 23(1): 1-4.
[3] Keith Briggs, Christian Beck. Modelling train delays with q-exponential functions. Physica A, 2007, 378(2): 498-504.
[4] Jianxin Yuan, Ingo A. Hansen. Optimizing capacity utilization of stations by estimating knock-on train delays. Transportatiknock-on Research Part B, 2007, 41(2): 202-217.
[5] H. Van Landeghem. A Beuselinck. Reducing passenger boarding time in airplanes: A simulation based approach. European Journal of Operational Research, 2002, 142(2): 294-308.
[6] Jason H. Steffen. Optimal boarding method for airline passengers. Journal of Air Transport Management, 2008, 14(3): 146-150.
[7] Kurt K.T. Lee, Paul Schonfeld. Optimal slack time for timed transfers at a transit terminal. Journal of Advanced Transportation, 1991, 25 (3): 281-308.
[8] Knoppers P., Muller T. Optimized transfer opportunities in public transport. Transportation Science, 1995, 29(1): 101-105.
[9] Chien S.I.-J. Optimization of headway, vehicle size and route choice for minimum cost feeder service. Transportation Planning and Technology, 2005, 28(5): 359-380.
[10] Spring C. Hsu. Determinants of passenger transfer waiting time at multi-modal connecting stations. Transportation Research Part E, 2010, 46(3): 404-413.
[11] SenaySolak, John-Paul B. Clarke, Ellis L. Johnson. Airport terminal capacity planning. Transportation Research Part B, 2009, 43(6): 659-676.
[12] Dipasis Bhadra. You (expect to) get what you pay for: A system approach to delay, fare, and complaints. Transportation Research Part A, 2009, 43(9-10): 829-843.
[13] Shoaib M. Chowdhury, Steven I-JyChien. Intermodal Transit System Coordination. Transportation Planning and Technology, 2002, 25(4): 257-287.
[14] Shen Y.S., Zhong Y.J., Zhang L. Analysis of Passengers Delays Based on Queue Theory of Subway Stations. Technology & Economy in Areas of Communications, 2009, 1: 101-103.
[15] Xie Z.Y. Research on Key Technologies of Passenger Flow Safety Forewarning of High-speed Railway Comprehensive Passenger Transport Hub. MS. Beijing Jiaotong University, China 2012. [16] Qi K. Research on Optimization for Flow Routing of Urban Passenger Hubs. MS. Beijing Jiaotong University, China 2012.
[17] Qi K., Zhang X.C. Calculation of Delayed Travel Time of Nexus Pedestrian Passages. Logistics Technology, 2011, 30(12): 129-131.
[18] Zhao L. Research on Traffic Design Theory and Methods of Urban Rail Transit Hubs. MS. Beijing Jiaotong University, China 2011.
[19] Du P., Liu C., Liu Z.L. Walking Time Modeling on Transfer Pedestrians in Subway Passages. Journal of Transportation Systems Engineering and Information Technology, 2009, 9(4): 103-109. [20] Xie L.H. Analysis of Transfer Time between Urban Rail Transit and Bus Rapid Transit. Urban Mass Transit, 2010, 6: 59-62.
[22] C.Y. Mao, Y.M. Bie, Y.L. Pei, and W.W. Qi. Research on Safety and Static-Dynamic Legibility of Distressed Pavement. Journal of Discrete Dynamics in Nature and Society. 2015, pp.1-7.
[23] Chien S.I.-J, Optimization of headway, vehicle size and route choice for minimum cost feeder service [J]. Transportation Planning and Technology, 2005, 28(5): 359-380.
[24] Spring C. Hsu. Determinants of passenger transfer waiting time at multi-modal connecting stations [J]. Transportation Research Part E, 2010, 46(3): 404-413.
[25] Senay Solak, John-Paul B. Clarke, Ellis L. Johnson. Airport terminal capacity planning [J]. Transportation Research Part B, 2009, 43(6): 659-676.