2019 International Conference on Artificial Intelligence, Control and Automation Engineering (AICAE 2019) ISBN: 978-1-60595-643-5
Experimental Study of Wind Pressure Correlation and Spectrum
Characteristics on the Surface of Rectangular Roof Structure
Yang-jin YUAN, Yi-min DAI
*and Shu JIANG
Key Laboratory of Wind-resistance and Vibration Control (Hunan Provincial), College of Civil Engineering, Hunan University of Science and Technology, Xiangtan, China
*Corresponding author
Keywords: Canopy structure, Wind tunnel test, Mean pressure, Correlation coefficient, Spectrum of fluctuating wind pressure.
Abstract. In order to study the wind pressure distribution characteristics of rectangular roof structure, the canopy gas station as the prototype manufacture of 1:20 scaled model, pressure test was carried out under the typical suburb wind field in wind tunnel.Rectangular roof was divided into different bands according to the flow characteristics. Firstly, qualitative analyse the distribution of the mean wind pressure on structure's surface.Secondly,choose different measuring points in bands,analyse power spectral density function in frequency domain and correlation coefficient in time domain of the wind pressure.The results show that the upper surface pressure distribution is mainly affected by the columnar vortex separation and lower surface wind pressure distribution is related to the interference of column,the surface net pressure distribution was affected by both columnar vortex separation and support column.Correlation of wind pressure is weakened in the windward front local region of the structure and the wake region of the support column. The wind pressure power spectrum of the structure surface is mainly related to the relative position of the flow,the support column increases the wind energy in the front and rear regions,which is harmful to the structure.
Introduction
The shed-type gas station is a structural form with a large span in low-rise buildings. Under the strong winds of high turbulence, the surface of the structure is subjected to repeated wind loads to generate wind-induced vibration, which easily leads to fatigue damage of the structure and its accessory components. For this special structural form, the relevant wind load values have not been directly given in China's load code, so it is necessary to carry out relevant research. For the study of the wind load characteristics of the low-rise buildings with sheds, Shuai L[1]conducted a series of wind tunnel tests on circular and rectangular shed-type low-rise buildings, and gave detailed analysis of wind pressure coefficient, zonal shape coefficient and gust coefficient. Yuxue L[2] conducted a wind tunnel test on a dry coal shed, and analyzed the correlation of surface wind pressure in the time domain and the frequency domain. Natalini M B et al.[3]conducted a wind tunnel test on arched shed roof structures with different body ratios, and gave the recommended values for wind loads. Augusto Poitevin et al. [4] adopted wind tunnel test and numerical simulation to study the influence of the height of the parapet wall and the length of the cantilever on the wind pressure on the surface of the open shed structure.
Wind Tunnel Test
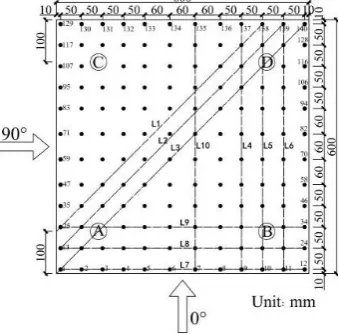
The wind tunnel test is completed in the atmospheric boundary layer DC wind tunnel of the Wind Engineering Experimental Research Center of Hunan University of Science and Technology. The wind tunnel experiment photo is shown in Figure 1. The wind pressure collecting device is the American PSI electronic pressure scanning valve (512 channels).The sampling point of the test measuring point is 312.5 Hz, and the sampling length is 10000 times. The gas station cover shed scale model is made of ABS plate to meet the strength and rigidity required by the test. The prototype of the gas station cover shed is an actual damage case. The plane size is 12.0m×12.0m, the height of the roof structure of the shed structure is 8.0m, the thickness of the shed structure is 1.0m, and the scale ratio of the test model is 1:20.The type of wind field used is the category B terrain wind field specified in China's "Code for Loads of Building Structures" (GB 50009-2012).The wind speed and turbulence profile are shown in Figure 2. The upper and lower surfaces of the scale-receiving model are symmetrically arranged with measuring points. The total number of measuring points is 140×2=280. According to the symmetrical form of the structure, the wind direction of the flow and the main target of this paper, the upper and lower measuring points of the shed roof are divided into L1~L10.The measuring point range, the structure surface measuring point arrangement and the partitioning diagram are shown in Figure 3.
[image:2.595.106.274.319.448.2] [image:2.595.355.487.321.446.2]
Figure 1. Wind tunnel test model of gas station cover. Figure 2. Category B terrain wind field profile.
Figure 3. Measurement point placement and partitioning. Wind Pressure Characteristics of the Surface of the Shed Structure
[image:2.595.214.384.476.643.2]suction pressure on the upper surface of the corresponding shed. The most obvious characteristic of the wind pressure on the lower surface of the shed is that there is a significant increase in the negative wind pressure on the surface of the four circular section cylinders I, II, III and IV, which is due to the inflow of the local area. The field is disturbed by the circular section cylinder, and under certain conditions, vortex shedding is likely to occur, resulting in an increase in negative pressure. As shown in Figure 4(c) that since the upper and lower surfaces of the cover shed are negative pressure, and the suction of the upper surface is larger than that of the lower surface, resulting in the offset between the two surfaces. The net wind pressure is not large, the absolute value of the maximum value does not exceed 0.4, and only the wind pressure in the local area is large.
[image:3.595.68.529.204.342.2](a) (b) (c)
Figure 4. Contour of Mean wind pressure coefficient at 0 degree wind angle (a) mean pressure coefficient on upper surface (b) mean pressure coefficient on lower surface (c) mean net wind pressure coefficient.
Correlation of Fluctuating Wind Pressure on Surface of Canopy Structure
Analysis of Correlation Coefficient of Wind Pressure in Vertical Space Measurement Point
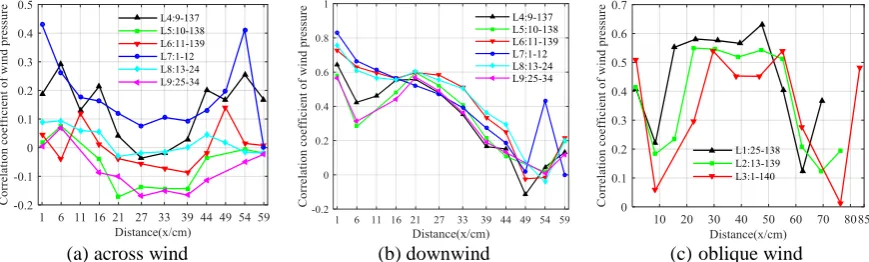
The roof structure of the shed is a space system, and the wind load on the roof is determined by the pressure difference between the upper and lower surfaces. It is helpful to predict the distribution characteristics of the wind load by analyzing the correlation of the wind pressure between the two surfaces of the roof. In general, the correlation coefficients of wind pressure on the upper and lower surfaces of the gas separation zone and the reattachment zone are different (see in Figure 5(a) and (b)). The correlation coefficient of the separation zone varies from -0.169 to 0.430, and the re-attachment zone is -0.172 to 0.292.The correlation coefficient varies greatly with the direction of the flow direction, especially the separation zone. In addition, it is found that the correlation coefficient between the upper and lower surfaces of the two columns is the smallest, which indicates that the area farther from the column is the most unfavorable load area when considering the overall force of the roof. Figure 5(c) shows the correlation coefficient of the canopy roof along L1, L2 and L3 under the 45° wind direction angle. The effect of the wind pressure correlation coefficient on the lower surface of the roof is more obvious, and the correlation coefficient in the middle area of the diagonal column does not change with the distance.
(a) across wind (b) downwind (c) oblique wind
[image:3.595.80.515.628.759.2]Analysis of Correlation Coefficient of Wind Pressure in Horizontal Space
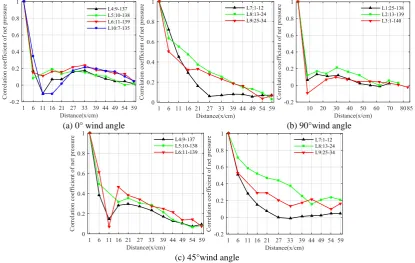
According to the analysis of the mean wind pressure distribution characteristics, the windward frontal area is the most likely part of negative pressure. Therefore, the windward front measuring point is used as the reference point to calculate the correlation coefficient between the reference point and the wind pressure time history of the remaining measuring points on the same strip. It can be seen from Figure 6(a) that the 0° wind direction is downward, and the correlation between the downwind direction and the windward front increases first, and the maximum negative correlation coefficient is close to -0.1, which gradually increases after the transition in the 6cm~16cm area and finally stabilized in the area after 33cm, the correlation coefficient remains in the range of 0~0.2.Comparing the 0° wind direction cross wind direction correlation coefficient graph and Figure 6(b), it can be found that the correlation coefficient value of the cross wind direction measuring point sequence for the vertical inflow direction is independent of whether the measuring point is in the airflow separation zone or the reattachment zone. It can be seen from Figure 6(c) that the wind pressure correlation coefficient of the diagonal line along the line relative to the first measuring point of the windward is basically stable between 0 and 0.2; the wind pressure at the edge of the structure along the wind direction of the three strips. The correlation coefficients vary widely, and the trend of the curve is similar to the 0° and 90° crosswind directions.
(a) 0° wind angle (b) 90°wind angle
[image:4.595.90.506.315.578.2](c) 45°wind angle
Figure 6. The variation of horizontal space net pressure correlation coefficient on awning structure surface with windward distance under 0° wind direction.
Fluctuating Wind Pressure Spectrum Characteristics of the Shed Structure
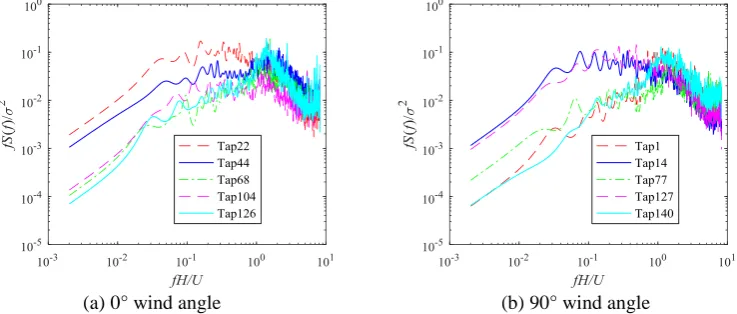
This section mainly studies the net pulsating wind power spectrum characteristics of some measuring points on the L3 and L5 strips at 0° and 45° winds (see in Figure7). The net fluctuating wind pressure spectrum adopts the infinite reduction frequency fH/U as and the dimensionless power spectrum f ·S( f )/2
as the ordinate, where f is the frequency (Hz), H is the characteristic size (the roof height), U is the mean wind speed at the height of the roof,and2
is the variance of the net fluctuating wind pressure coefficient of the corresponding measuring point, S( f ) is the net fluctuating wind pressure power spectral density of the corresponding measuring point, and the power spectrum estimation adopts the covariance method of the auto-regressive power spectrum.
point behind the two columns is higher than other measuring points, indicating that the airflow disturbance of the column will lead to adverse effect on roof wind resistance.
[image:5.595.114.483.100.257.2]
(a) 0° wind angle (b) 90° wind angle
Figure 7. Fluctuating wind pressure spectrum curve of L3 and L5 measured at 0 degree wind angle.
Summary
(1) When the shed structure is in the vertical windward edge, the distribution law of the upper surface wind pressure is similar to that of the large-span flat roof. The wind pressure on the lower surface is mainly interfered by the support column of the shed structure, which shows that the negative pressure in the front of the cylinder is weakened and the negative pressure behind the cylinder is strengthened.
(2) The vertical spatial correlation between the upper and lower surface wind pressure of the shed structure is as follows: the correlation between the windward front area and the rear area of the column decreases, and the correlation increases with the increase of the distance from the windward front in other areas. The analysis shows that the windward front is mainly affected by the separation bubble, and the rear of the column is mainly affected by the wake of the column, which causes the original internal vortex structure of the airflow to be destroyed, and the correlation decreases.
(3) The wind pressure pulsation frequency at the forefront measurement point of the wind is concentrated at about 10 Hz. With the increase of the distance from the windward front, the cylindrical vortex is divided into a secondary vortex and a small vortex by the large vortex, and the peak of the wind pressure spectrum is gradually dispersed to the high frequency and the low frequency. The support column has a blocking effect on the airflow in front of it, and has an occlusion effect on the rear airflow, so that the airflow spectrum energy reaches a peak in the low frequency region.
Acknowledgement
Financial support was from National Nature Science Foundation of China (Project No: 51578237).
References
[1] Shuai L, Zhuangning X, Study on Wind Load Characteristics and Aerodynamic Wind Resistance Measures of Low-rise House Roofs,[J]Chinese science(Series E), 2005, 35(8):830-839.
[2] Yuxue L, Shuo B, Wind tunnel test study on wind load characteristics of long-span cylindrical reticulated shell structures,[J]Journal of building structures, 2015, 04:105-111.(in Chinese)
[3] Natalini M B, Morel C, Natalini B. Mean loads on vaulted canopy roofs[J].Journal of Wind Engineering and Industrial Aerodynamics, 2013, 119(1):102-113.