International Journal of Emerging Technology and Advanced Engineering
Website: www.ijetae.com (ISSN 2250-2459, ISO 9001:2008 Certified Journal, Volume 7, Issue 7, July 2017)
195
Improving Efficiency of Graph Based Health Data Mining
Using Language Processing
Rashmi Tembhurne1, Prof. Amit Saxena2
1M.E (CSE) Scholar, Department of CSE, Truba Institute of Engineering & Information Technology, Bhopal, India 2
Department of CSE, Truba Institute of Engineering & Information Technology, Bhopal, India
Abstract: The usage of technology in the medical domain has proved its efficiency, in detecting diseases, Storing data or by providing advanced tools. Medical databases, which are filled with data of the patients or any other medical data. They have accumulated a huge amount of information about the patient and their medical conditions. This data can help in finding patterns and relationships between the data, it helps in understanding the patient medical history as well as to check if the patient is developing any other disease. To find the patterns and relationships amongst the system multiple techniques have been developed which are reviewed in this paper. The paper focuses on various techniques with their advantages and disadvantages to understand the best mining technique for healthcare databases.
Keywords: Mining, Healthcare Databases, Pattern Recognition.
I. INTRODUCTION
The use of technology has made easier for the medical personals to store the data of the patient very easily which can also be managed easily. Therefore, the data accumulated in the databases of doctors are growing up quickly which opens up roads for extracting hidden knowledge, but the process has become complex and time-consuming over time due to huge datasets. The analysis is difficult for the decision makers and managers to get the correct knowledge from such a huge set. This data helps in enhancing the performance of patient management systems. The knowledge will help in two broad ways firstly it will support specific knowledge-based problem-solving activities through the data available with the medical expert while monitoring the patient also the knowledge will help in discovering some new knowledge from the group of case studies for example by looking at data of cancer patients the doctor can analyses that the new patient may or may not suffer from the same problem.
These reasons push the usual manual data analysis is not enough when there are huge databases available. Knowledge Discovery Databases or KDD provides the best solution to huge database problems and it has been highly active in the last few years. KDD is a process to extract knowledge from large datasets. The important step of KDD is the mining process, which deals with the extracting interesting, implicit, and useful relations and patterns in data available in the set.
One of the popular data mining technique is the associate rule mining technique. But to extract data from the medical dataset, the best technique is the association rules. The rules are best used for pattern discovery in the area of data mining.
The purpose of the paper is to study different technique helpful in finding the knowledge from the dataset used. The rest of the paper is organized as follows, the following section briefly reviews different techniques for mining the data following with their analysis and conclusion.
II. TECHNIQUES
In this section, we will review different techniques which help in mining the medical data. The mining of the medical data is divided into two broad classes, first is the explanatory and second is the exploratory mining. The technique used for the validation of the decision made for the patient is Explanatory whereas the technique to just extract data to predict the future is exploratory. The techniques used for KDD are reviewed as follows:
A.Genetic Algorithm:
The GA-based miner is regarded as a general pattern search tool supporting several pattern forms and also it has the capability of performing with varying levels of user supervision. The system can be used for traditional classification tasks and pattern discovery. The GAMINER is applicable on all the levels of data mining namely undirected mining, Directed Mining, and Hypothesis testing. The miner is also based roughly on ideas from a number of non-genetic techniques such as EXPLORA.
The development of fast and flexible miner is made possible due to the implementation of the technique using Reproductive Plan Language (RPL2). It is an extensible language which is having an interpreted structure and also comprises a runtime structure for easily implementing stochastic search algorithms and evolutionary algorithms that GA support. A wide variety of pattern forms is also included in the miner. These supported forms are the basis of subset description. It is a collection of subsets of clauses of the database and forms the main heritance table which is explained as follows:
Sub-set Description := Clause [ or Clause] Clause := Term [ and Term] Term := attribute in Value Set
International Journal of Emerging Technology and Advanced Engineering
Website: www.ijetae.com (ISSN 2250-2459, ISO 9001:2008 Certified Journal, Volume 7, Issue 7, July 2017)
196 A structural population model in which each gnome reproductive partner is selected from the within its local neighbors. This population prolongs the diversity within itself and local niching is encouraged resulting in an exploration of several areas of the searched spaces and matches well with the goal of finding several patterns. The crossover operator is characterized at an assortment of levels, mirroring the structure of the representation. Disjunct conditions, provisos, terms and characteristic values each include a solitary quality at the suitable level. Inside subset portrayals, crossover at the disjunct condition level depends on the uniform crossover and upholds positional arrangement of part provisions. Both uniform and single-point crossover are utilized at the statement level, while crossover at the term level is again in light of uni-shape crossover. Change is likewise characterized at an assortment of levels, with independent probabilities determined for mutating each of the segment parts. Statements, terms, and values are included or erased with determined probabilities and can be viewed as unmistakable specialization and speculation administrators.
B.AdaBoost Algorithm:
It is one of the methods used for cancer detection amongst the patient using medical data processing. The main advantage of the algorithm is that it can be built using fewer features. In this paper we are going to explain a classifier with enhanced classification accuracy but also the processing time is reduced leading to a better and reliable defect classification system. The traditional technique gives minor errors then the diverse method created.
Adaboost is a technique utilized for constructing a strong classifiers using multiple weak classifiers. This quality makes the technique more adaptive as the weak classifiers can be in favors or mixed to create a final classifier. But the technique is prone to noisy and outliners data.
( ) ∑ ( )
Where ht can be greater than {1,-1}.
To create a strong classifier we tend to need a weak classifier which is a very simple model that has just a slightly better accuracy than any randomly generated classifier which has roughly 50% accuracy with the data. Iterative methods are used using the training data to fetch the set of weak classifiers. The iterations take the example dataset and reweight itself according to the specified condition. The classification accuracy decides the computed weights of weak classifiers.
The assigned weight is the filter in the classifiers if the rate of error is less that means the weight of the filter is more.
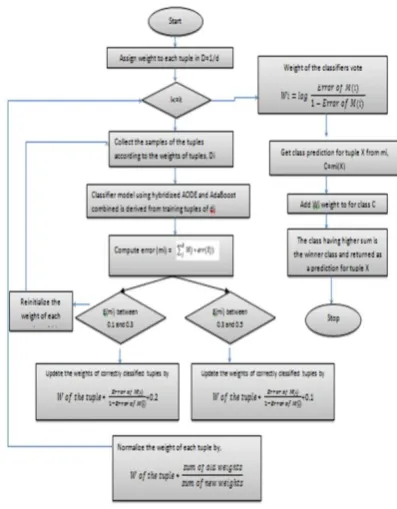
[image:2.595.332.531.217.472.2]The training process is repeated till the weight of the classifier is adjusted. The class of the data which gain the highest total weight will be termed as the predictive class for that object. In the technique, the user has to choose the weak classifier which is best suited for the system and the number of boosting rounds that should be used while training the dataset.
Figure 1: Flow Chart of AdaBoost Algorithm
C.Association Rule Mining:
ARM is a data mining technique that is very useful for behavioral and analysis type of work. It is very user centric as its primary objective is to mine the data that can be used to gather new knowledge. ARM is to facilitate the discovery, heuristically filter, and enable the presentation of these inferences or rules for subsequent interpretation by the user to determine their usefulness. It is performed in two parts namely:
PART 1:
In this part, the data items and item sets with the frequent usage pattern are identified using user specific support threshold. This phase is called FREQUENT ITEMSET CONSTRUCTION OR MINING.
PART 2:
In this, part inference rules are generated using the patterns obtained from phase 1. This phase is called ASSOCIATION RULE GENERATION.
International Journal of Emerging Technology and Advanced Engineering
Website: www.ijetae.com (ISSN 2250-2459, ISO 9001:2008 Certified Journal, Volume 7, Issue 7, July 2017)
197 ARM is broadly classified into three categories:
1. Positive ARM
These are the rules that we can actually use for computational purposes and are used for decision making.
The positive rules are classified as follows: 1. Boolean association rules
a. Quantitative b. Constrained rules c. Sequential rules 2. Qualitative association rule 3. Spatial association rule 4. Temporal association rule
2. Negative ARM
These are rules that have are both frequent and infrequent for data usage. These rules play an important role in decision making too (for example conflicts and comparisons)
3. Constraint-based ARM
This rule mining technique is used when the user has some specific data requirement for the data sets. By doing this lots of cost of mining those rules that turned out to be not interesting can be saved. The constraints are classified as follows:
1. Knowledge-based constraints 2. Data constraints
Example of ARM:
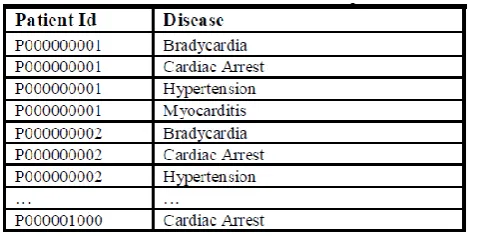
[image:3.595.315.569.197.530.2] [image:3.595.317.565.199.395.2]The following table represents sample dataset of a Medicare database that contains the patient-wise diseases.
Table 1: Transactional Data Sample
Producing Itemsets
[image:3.595.318.561.436.530.2]A set of diseases obtained by each patient presented here along with the number of diseases counted by the phase 1 in Figure 3 and put the result into the column headed CNT in figure 3
Figure 2: Pseudo code to count diseases using ARM
Table 2:
Patient records with diseases.
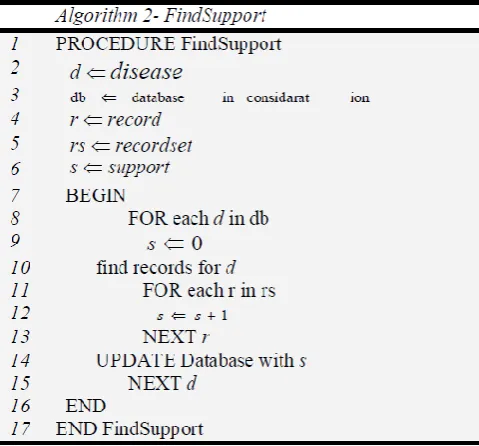
Counting Support of an Item (Disease) in the sample dataset
[image:3.595.54.294.551.669.2]International Journal of Emerging Technology and Advanced Engineering
Website: www.ijetae.com (ISSN 2250-2459, ISO 9001:2008 Certified Journal, Volume 7, Issue 7, July 2017)
[image:4.595.56.296.135.358.2]198
Figure 3: Pseudo code to calculate support
Table 3: Distinct diseases
Generating Candidate Itemsets
[image:4.595.320.561.377.473.2]The following procedure generates candidate itemsets taking the transactional records as input and maximum pass and minimum support as parameters.
Figure 4: Generating itemsets from sample dataset.
Table 4:
Candidate steps for stop-level 2
Association Rule Generation
Using the sample transactions of Table 1, after second pass (maxpass=2), the CSCP system has generated the rule data as listed in Table 5 below:
Table 5:
Candidate steps for stop-level 2
D.Fuzzy Mining:
Fuzzy logic is generally applied for classifying the text, finding fuzzy relations and structures in data sets. The fuzzy optimal relation has a simple architecture distributed into five stages of pre-processing, crawling, classification, selection, extraction and graph creation. These stages are as follows:
a.Pre-processing
This is where the user takes out functional queries guided by user query interface.
b.Web Crawling
It is responsible for collecting relevant information that is used for mapping between data items and item sets. it has few components like:
Indexer- it used to retrieve contents of the list that are used by the user during query processing. It works basically as a parser. Term Parser-it tests each term on the stored list
to assign a functional term. Any relevant information regarding these is stored in form of fixed records.
[image:4.595.53.293.571.759.2]International Journal of Emerging Technology and Advanced Engineering
Website: www.ijetae.com (ISSN 2250-2459, ISO 9001:2008 Certified Journal, Volume 7, Issue 7, July 2017)
199 c. Keyword classification and selection
Classifiers that use the term-frequency to represent textual information in the vector space. For query topic identification, we can define a feature for each word, indicating whether the query contains that word. We can then define a feature extractor that simply checks whether each
d. Optimal Fuzzy relation extraction model
Fuzzy relations map elements of one universe, say X, to those of another universe, say Y, through the Cartesian product of the two universes. However, the strength of the relation between ordered pairs of the two universes is not measured with the characteristic function, but rather with a membership function expressing a various degree of strength.
e. Graph generation
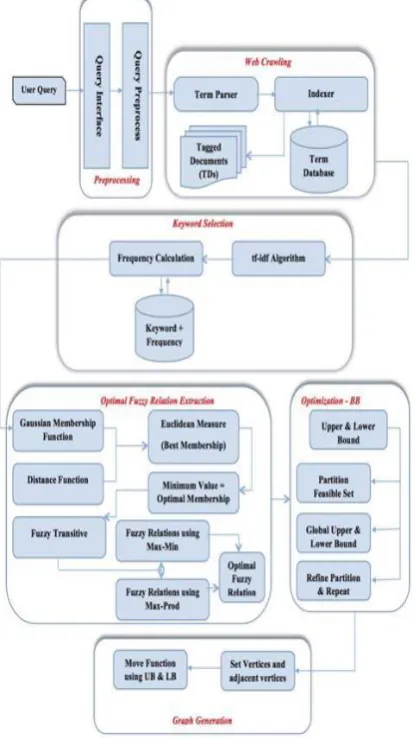
[image:5.595.60.268.381.750.2]The arbitrary graphs are used to formulate and represent the basic structure such as concepts and relations between fuzzy terms and the user query
Figure 5: The Basic Architecture of Optimal Fuzzy Relation Extraction
E.Graph-Based Approach:
Graphs turn out to be progressively valuable in demonstrating confused structures like circuits, pictures, protein structures, biomedical systems, substance mixes. Graph mining has picked up significance in information mining. Numerous analysts have created different calculations and techniques on graph mining. The approach contains three main terms namely Graphs, Discrete Graphs and Adjacent Matrix. The discrete mathematics prove one of the best-studied data structure namely the Graphs. The time complexity is the main reason to use the graph structure which is also applied in the mining case at the time of the processing the data is saved leading to an efficient system in time domain.
The approach scans the dataset at once and sought the paradigm in the domain of identifying frequent sets that result in generating a large number of candidate sets. The discrete graph is constructed, where the weights are stored in main memory in the form of adjacent matrices.
The result can contain the same set of items even when there were two different operations were performed but the case may be that the dataset could be identical with common subsets. This two semantics are considered while evaluating mined itemsets. First is the fully qualified adjacency matrix and last reduced matrix of the frequent itemsets. To create the adjacency matrix the database values are modeled into a discrete graph G and an adjacency matrix is created. To reduce the matrix verification of the value count of each element of the matrix is done if the value is less then min_sup the row and columns associated to the value are deleted. Y this method the reduced matrix is fetched. The algorithm is as follows:
Algorithm:
Initialize: Set of traction D, Total number of itemsets with the occurrence.
Step 1: Scan: Scan the database and create discrete graphs from the values,
Step 2: Identify: Update and fetch the values of each element in the matrix
Step 3: Construct: The reduced adjacency matrix processes,
Step 4: Mine: number of levels are to be mined using operators.
International Journal of Emerging Technology and Advanced Engineering
Website: www.ijetae.com (ISSN 2250-2459, ISO 9001:2008 Certified Journal, Volume 7, Issue 7, July 2017)
[image:6.595.46.284.149.409.2]200 III. ANALYSIS
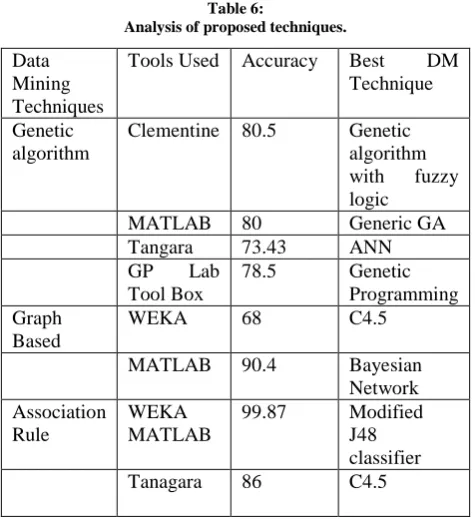
Table 6:
Analysis of proposed techniques.
Data Mining Techniques
Tools Used Accuracy Best DM Technique
Genetic algorithm
Clementine 80.5 Genetic algorithm with fuzzy logic
MATLAB 80 Generic GA
Tangara 73.43 ANN
GP Lab Tool Box
78.5 Genetic Programming Graph
Based
WEKA 68 C4.5
MATLAB 90.4 Bayesian Network Association
Rule
WEKA MATLAB
99.87 Modified J48 classifier
Tanagara 86 C4.5
As shown in the above table all the reviewed techniques with their accuracy and used tool and algorithm is provided for analysis. As we can see the Association Rules used using Modifier technique using matlab tool can give the best efficiency.
IV. CONCLUSION
We concluded that the Association Rule used using modifier technique using MATLAB tool can give the best efficiency.
REFERENCES
[1] Xindong Wu · Vipin Kumar · J. Ross Quinlan · Joydeep Ghosh · Qiang Yang · Hiroshi Motoda · Geoffrey J. McLachlan · Angus Ng · Bing Liu · Philip S. Yu · Zhi-Hua Zhou · Michael Steinbach · David J. Hand · Dan Steinberg, “Top 10 algorithms in data mining”, Published online: 4 December 2007 © Springer-Verlag London Limited 2007.
[2] Ruijuan Hu, “Medical Data Mining Based on Association Rules”, Computer and Information Science Vol. 3, No. 4; November 2010.
[3] Wael Ahmad AlZoubi, “Mining Medical Databases Using Graph-based Association Rules”, International Journal of Machine Learning and Computing, Vol. 3, No. 3, June 2013.
[4] Mariam Adedoyin-Olowe, Mohamed Medhat Gaber and Frederic Stahl, “A Survey of Data Mining Techniques for Social Network Analysis”
[5] Dr. K. Nachimuthu, “Extracting Medical Health Records in a Graph-Based Approach”, international Journal of Science and Research (IJSR) ISSN (Online): 2319-7064 Index Copernicus Value (2013): 6.14 | Impact Factor (2015): 6.391 Volume [6] Dan A. Simovici, “Data Mining of Medical Data: Opportunities
and Challenges in Mining Association Rules”,
[7] Dr. M. Renuka Devi, “Analysis of Various Data Mining Techniques to Predict Diabetes Mellitus”, International Journal of Applied Engineering Research ISSN 0973-4562 Volume 11, Number 1 (2016) pp 727-730.
[8] Er.Ramanpreet Kaur, Dr. Vinay Chopra, “Implementing Adaboost and Enhanced Adaboost Algorithm in Web Mining”, International Journal of Advanced Research in Computer and Communication Engineering Vol. 4, Issue 7, July 2015.
[9] K. Pazhani Kumar, “Association Rule Mining and Medical Application: A Detailed Survey”, International Journal of Computer Applications (0975 – 8887) Volume 80 – No 17, October 2013
[10] Kamna Solanki, “Analysis of Application of Data Mining Techniques in Healthcare”, International Journal of Computer Applications (0975 – 8887) Volume 148 – No.2, August 2016.
[11] Abhilasha Singh Rathor Dr. Pankaj Garg, “Analysis of Text Mining Techniques”,