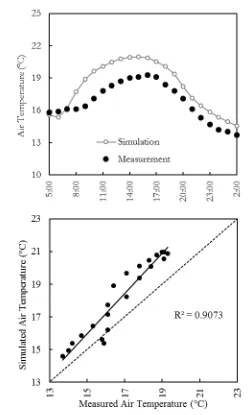
The impact of increasing urban surface albedo on outdoor summer thermal comfort within a university campus
Full text
Figure


Related documents
Table 4.1: The length of time or the number of bright single pulses that went into the composite profile, the width, S/N and the RMS timing residuals from the composite profiles.
This unit is devoted to learning advanced jQuery techniques such as event delegation, different types of ajax requests (including jsonp), interacting with a firebase back-end and
The rights of shareholders, Annual General Assembly Meetings, dividend distribution policy, disclosure policy, human resources and ethical principles, relations with
impact because paper waste is reduced, on the other hand, the rampant copying of digital data raises the amount of plagiarism that is increasing. At present, there are many
Besides the TA gene cluster, the Lichenicidin/ Mersacidin biosynthetic gene cluster, belonging to lanti- peptide-t2pks, contained 34 genes from MXAN_6380 to MXAN_6413, where 7
1D, 2D, 3D: one, two, three dimensional; ASD-POCS: adaptive-steepest-descent-projection-onto-convex-sets; CBCT: cone beam computed tomography; CG: conjugate gradient; CT:
The European Data Directive says that you have to provide access to individuals with respect to all of the data that you have collected
Figure 3: Comparison of the average binary error, the multiclass error using Hamming decoding, and the multiclass error using loss-based decoding with AdaBoost on synthetic data,

