International Journal of Emerging Technology and Advanced Engineering
Website: www.ijetae.com (ISSN 2250-2459, ISO 9001:2008 Certified Journal, Volume 6, Issue 1, January 2016)
272
Proposing A New Feature for Vibration Based on The
Appearance of Harmonic Frequency
QuangThanh-Nguyen
1, KieuNhi-Ngo
2, BaoToan-Pham
3 1,2,3The Laboratory of Applied Mechanics, National University, University of Technology
Abstract— The vibration-based methods of structural health monitoring can be divided into modal and signal methods. Although modal methods have been widely used for damage detection and health monitoring, signal methods, due to higher efficiency, have been more highly regarded. In this study, we will propose a new feature based on the appearance of harmonic frequency of the representative power density spectrum. While the bridges surveyed have structures of prestressed concrete, reinforced concrete and composite steel, the actual vibrations of span were caused by movement of live loads which were a combination of three types mode shape’s vibration such as bending, torsion and torsion bending. This research shows that the appearance frequency is a potential parameter in algorithms degradation prognosis of the span bridge because the fundamental value frequency will depend heavily on the degradation prognosis of the.
Keywords— Vibration Based Damage Detection; Appearance Frequency; Representative Power Density Spectrum; Power Density Spectrum; Vibration; Structural Health Monitoring.
I. INTRODUCTION
The health monitoring of a bridge is always a particularly important problem in each country. Ensuring the safe operation of bridges is an important task for the infrastructure management communities. Monitoring is made by non-destructive techniques. The traditional methods that offer limited capabilities to conduct structural damage condition investigation consist of visual or local inspection such as acoustic emissions or ultrasonic methods, magnetic field methods, radiography, eddy current techniques, thermal field methods, dye penetrant, and fibre optic sensors of various kinds [1]. These methods require that an approximate location of the damage already be known and may only be applied to portions of the structure which are accessible. In addition, these methods are generally costly, time consuming and ineffective for large and complex structural systems.
In the recent 30 years, the tendency in the assessment of the condition of structures, using vibration parameters, has been interesting in aerospace, automotive, civil and mechanical engineering in their aim to overcome some disadvantages of these traditional methods.
All the methods have proposed to be based on use of the parameters extracted over time—vibration response, commonly called Vibration Based Damage Detection (VBDD) [2-5]. Because the vibration parameters will depend on value and the distribution of the physical properties of structure as mass, stiffness, energy dispersion parameter and boundary conditions, the VBM methods will fall in the category of global inspection methods. The structural condition assessment using VBDD extracts damage sensitive features from vibration signals of structures. Damage feature extraction is a process of identifying damage sensitive characteristics of the structural response. This process happens by condensing the measured structural responses to features which are sensitive to a specific type of damage. For example, the features were extracted from vibration signals to include spectral function, power spectral density or modal parameters [6-9]: frequencies, mode shapes, modal damping and mode shape parameters: curvature mode, strain mode, and modal strain energy.
The measured physical properties have two categories: vibration response and strain. The commonly used measuring devices are accelerometer sensors and strain sensors. The vibration signal of the bridge is collected from measured responses to various forms of excitation. However, there are two commonly used types as forced vibration excitation and ambient vibration excitation.
International Journal of Emerging Technology and Advanced Engineering
Website: www.ijetae.com (ISSN 2250-2459, ISO 9001:2008 Certified Journal, Volume 6, Issue 1, January 2016)
273
However, the input or excitation level of the real large structure in its operational condition is not easy to quantify, which makes controlled force excitation largely impractical to use.- Structural health monitoring (SHM) is often carried out utilizing ambient vibrations for the excitation of the structure. A variety of ambient excitation sources include wind, seismic activity, traffic, waves or tidal fluctuations, etc. Dynamic response is a random vibration that contains much harmonics. The advantage of using ambient excitation includes low cost, little to no disruption to traffic, long term excitation, and the fact that in some cases the frequency content is appropriate for the structure [11]. However, the disadvantage of using ambient excitation includes the variability in amplitude, duration, direction, frequency content, and difficulty in accurately measuring excitation. Vietnam is a developing country, so choosing low-cost devices and vibration excitation was the first prerequisite in our research direction.
Condition monitoring of bridges consists of two tasks: continuous evaluation of structural integrity and damage detection. All the methods used in the two tasks are commonly based on the variation of the features which are extracted from measured responses. The effectiveness of these methods in practice depends on the features that have certain degree of sensitivity to structural changes. The word ―sensitivity to structural changes‖ means that the lowest variation of the feature was larger than any error due to measurement noise in real working conditions at construction. With the physical parameters, the method using frequency has attracted increasing interest in many research communities. The two types of simulated damage are considered: reduced stiffness and crack, where reduced stiffness is simulated by reducing the elastic modulus or adding some mass at a particular element location and crack is simulated by certain rotational springs or removing the selected elements.
II. THEORETICAL BACKGROUND
1. The theory of vibration’s elastic beam
Any vibration of mechanical systems has always been regarded as a linear combination of base vibrations. In some cases, when the systems are surveying bars, the base deformation can lead to compression pull up, bending, torsion or torsion bending, which are caused by the relative motion between the cross section of the bar and are considered as absolute solid. The base vibrations are represented by the harmonics as follows:
cos
i i Ni
w W t (2.1)
In which:
Ni
– The ith fundamental frequency
Vector will set up from Wi which are called the ith eigenvector. Sequence number of the fundamental frequency and eigenvector show that:
1 2 3 ...
N N N Ni
(2.2)
The Niare called base frequencies which have specially important significance in the technical. It can be seen that if the frequency of coercive force is similar with the value of the fundamental frequency, the amplitude of the harmonics will increase many times. The formula for determining fundamental frequencies of elastic bar is as follows:
- The bending of bar:
2 4 . . x B i EJ i A l (2.3)
In which: EIx = section bending stiffness
- The torsion of bar:
0 z T i GJ i J (2.4)
In which: GJz = section torsion stiffness modulus
- The torsion – bending of bar:
2
2 2 2 2 2 2
2 4
2 1
Ti Bi Ti Bi Ti Bi
B T i
(2.5) In which: 4 4 2 4 z Bi EI i l F ;
2 2 2 4 4
2
4 2
z z
Ti
GJ i l EJ i
l I Fc
; 2 2 Fc I Fc
WhencB T , then = 0, the frequency of bending –
torsion is:
2 2
2 2
2
2
Ti Bi Ti Bi
B T i
(2.6)
International Journal of Emerging Technology and Advanced Engineering
Website: www.ijetae.com (ISSN 2250-2459, ISO 9001:2008 Certified Journal, Volume 6, Issue 1, January 2016)
274
2. Power spectral density
- Power spectral density
We now turn to the frequency composition of a naturally occurring random process. Because the time history x(t) of the sample function is not periodic, it cannot be represented by a discrete Fourier series. Also, for a stationary process,
x(t) goes on forever and the condition:
( )
x t dt
(2.8)is not satisfied, so that the classical theory of Fourier analysis cannot be applied to the sample function. This difficulty can be overcome by analyzing, not sample functions of the process itself, but its autocorrelation function.
In which: Rx
0 (2.9)In addition, the condition: Rx( ) d
(2.10)The Fourier transform ofRx( ) and its inverse are given by:
1( ). . 2
i
x x
S R e d
(2.11)Moreover: Rx( ) Sx
.e i.d
(2.12)
x
S is called the spectral density of the x process and is a function of angular frequency. The most important property of Sx
becomes apparent when we put 0in equation. In this case:
( 0) .
x x
R S d
(2.13)- Response power spectral density
Now consider the problem of a vertical ground acceleration input modeled by a stationary while noise process with zero mean. Such as idealized random motion is defined by a uniform power spectral density S0 with the associated autocorrelation function Rx( ) 2 S0
(2.14) , where
is the Dirac delta function of the time lag τ.For such a random input, the stationary response power spectral density Sp(y, ω), SF(y, ω) and SM(y, ω) for pressure, shear, and moment, respectively, can be readily determined by the following well-known relation:
*
0
, , . , .
S y H y H y S (2.15)
Thus,
2 2
2
0 2
, . . , .sin
p
H y
w H
S y S G
c g
(2.16)
2 2 3 2
0 2 2
, . . , 1 cos
F
H y
w c H
S y S G
c g
(2.17)
2 2 3 2
0 2 2
, . . , sin
M
H y H y
w c H
S y S G
c c g (2.18) Where 2 2
2 2 2 2
1 ( , )
1 cos 1 sin
c G c c H H H (2.19)
- Probability Density of the Peaks
Since typical structures are designed to withstand maximum loads or peak loads. It is, therefore, useful to examine all the peak values of a random process x(t) and derive the probability density function among the peaks. Let us consider the entire time history of a sample x(t), such as the one shown under the restriction of a stationary narrow-band process. Such a sample with zero mean denotes the number of peaks per unit time with magnitude lying between z and z + dz by npz; it also denotes the total number of peaks per unit time by np. Then the probability that a peak with magnitude lying between z and z + dz among a total population of peaks can be estimated by
pzp
E n p z dz
E n
(2.20)
Again, under the assumption of a narrow-band process, npz in equation is approximately equal to the difference between the number of up-crossing of the level z per unit time ncz and that of the level z + dz per unit time nc,z+dz.
Thus:
,
pz cz c z dz
International Journal of Emerging Technology and Advanced Engineering
Website: www.ijetae.com (ISSN 2250-2459, ISO 9001:2008 Certified Journal, Volume 6, Issue 1, January 2016)
275
Similarly, E[np] is approximately equal to the average time rate of zero up-crossings v0+. Therefore,
0 0
z z dz z
v v dv
p z dz
v v
(2.22)
Recall that for x(t) and
x
t with uncorrelated Gaussian
distribution and zero means, the average time rate of zero up-crossings v0+ and z level up-crossings are, respectively,
0
2 x
x v
; 2
2
exp
2 2
x z
x x
z v
;
2exp 222x x
z z
p z
(2.23)
Which is the well-known Rayleigh distribution in ocean wave height as illustrated. Note that pz(z) = 0 for z <0
III. RESULTS AND DISCUSSION
3.1. Measurement organizations
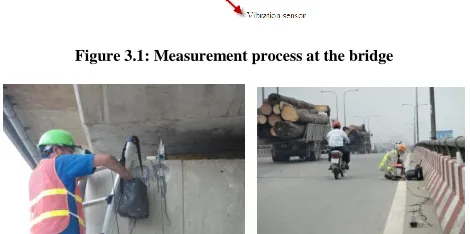
[image:4.612.88.270.254.315.2]This research will be based on the organization of the results to measure the actual vibration of 37 bridges. They are concentrated mainly in Thu Duc, 2, 9 District, a total of measurements including four batches, and a batch separated by nearly three months (from 10/2011 to 08/2012). The measurement process is performed at different times of the day with different live traffic loads. LAM laboratory used accelerometer sensor to collect and receive signals. The place of measurement point sensor is shown in figure 3.1
Figure 3.1: Measurement process at the bridge
Figure 3.2: The actual measurements at the bridge
- Characteristics of the bridges
- Total number of surveyed bridges: 37 bridges
- Characteristics of the bridges: Most of the bridges have a span of less than 30m in length and are divided into three groups according to the characteristics of bridge structures: prestressed concrete, reinforced concrete and composite steel
- Total of spans: 206 spans - Total of pillars: 170 pillars - Total of bearings: 60 bearings - Total of abutments: 76 abutments
- Total of vibration measurement points: 1.385 points - Total of axis at a point: 3 axis /point (as shown in
figure 3.1)
- Total of data files: 16.620 files
- Sampling frequency of a data file: 400 sampling /sec
- Measurement sensor
- Sensor: Vibration accelerometer sensor (SENSR)
-
Instrument: SENSR GP 1P-
Serial#: 1999-
Manufacturer: Reference LLC/sensr-
Process#: 224- General accuracy: ± (50mg ± 5% of reading)
- Measurement process
- For the spans: measured at mid-span position and at a measurement point which will measure to follow 2 axis (x, z)
- For the pillars, bearings, abutments: measured at the highest point of pillars, bearings, abutments and at a measurement point which will measure to follow 3 axis (x, y, z)
- Data processing process
[image:4.612.51.286.580.697.2]International Journal of Emerging Technology and Advanced Engineering
Website: www.ijetae.com (ISSN 2250-2459, ISO 9001:2008 Certified Journal, Volume 6, Issue 1, January 2016)
276
Figure 3.3: Data processing process of the representative powerdensity spectrum (RPDS) and the appearance frequency of the harmonic fundamental frequencies (AFH*)
3.2. Assessment about power density spectrum - Characteristics of the actual power density spectrum
With the actual measurement at 38 bridges, we can see that the actual density spectrum has some characteristics as follows:
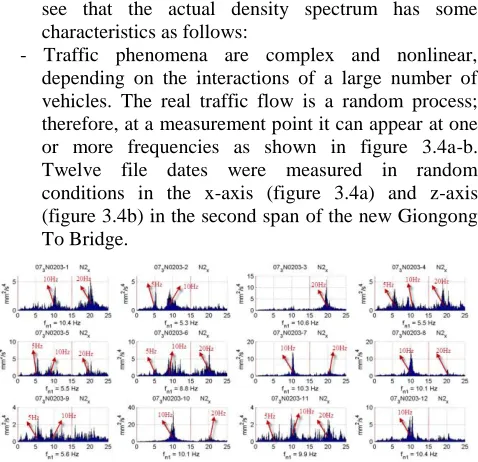
[image:5.612.65.280.140.330.2]- Traffic phenomena are complex and nonlinear, depending on the interactions of a large number of vehicles. The real traffic flow is a random process; therefore, at a measurement point it can appear at one or more frequencies as shown in figure 3.4a-b. Twelve file dates were measured in random conditions in the x-axis (figure 3.4a) and z-axis (figure 3.4b) in the second span of the new Giongong To Bridge.
Figure 3.4a: The real power density spectrum in the second span of the Giongong To Bridge
- With the real power density spectrum, it can be seen that depending on the traffic condition of the bridge at the time of measurement, the mechanical behavior of span will appear at the different harmonic frequencies.
However, under these conditions, some harmonic frequencies were repeated several times as 10 Hz (figure 3.4a), 4.7 Hz (figure 3.4b) and some harmonic frequencies appear less as 5 Hz, 20 Hz (figure 3.4a), 5.6 Hz, or 9.8 Hz (figure 3.4b). To evaluate overall the entire real power density spectrum in different times, we will introduce the concept of the representative power spectrum density (RPDS) in which RPDSs show, not only all the amplitude of harmonic frequencies, but also the appearance of harmonic frequencies as shown in figure 3.5a or 3.5b
[image:5.612.325.563.165.427.2]Figure 3.5a: RPDS in the second span of the Giongongto Bridge
Figure 3.5b: RPDS in the second span of the New Giongongto Bridge
In which: ―•‖ the amplitude of harmonic frequency ―*‖the appearance of harmonic frequency
- With the RPDS, we can determine value not only of the lowest fundamental frequency but also of the others. They appear simultaneously in which case these value will remain almost unchanged for a long time (over a year). The surveying in the real different measurements at New Giongongto as shown in figure 4, in a measurement about three months, gave us the following results:
[image:5.612.49.288.411.642.2]International Journal of Emerging Technology and Advanced Engineering
Website: www.ijetae.com (ISSN 2250-2459, ISO 9001:2008 Certified Journal, Volume 6, Issue 1, January 2016)
277
(b)(c)
[image:6.612.50.293.129.428.2](d)
Figure 3.6a-d: RPDS in the second span of the New Giongongto Bridge of the different to measure 4 times
From RPSD, it allows us to identify the exact value of fundamental frequency in the same measurement. The value of the lowest fundamental frequency does not change during the time of monitoring, with the random condition of the real traffic flow and different weather, this value is always fixed. In figures 4a-d, we can see that first frequency f1 = 4.7 is not changed and other frequencies are too; however, the frequencies f3=10.2 Hz or 9.8 Hz (the highest frequency) does not entirely appear in the fourth measurement time
- Characteristics of the representative power density spectrum
After 4 measurement times, the distance between first measurement and fourth measurement (last measurement) was over a year and the value of the fundamental frequency of the same object was changed no more than 0.2 Hz. With table 1, this is examples of the fundamental frequency value according to the vertical direction (z-axis).
[image:6.612.317.573.225.575.2]It can be called
f
z of 4 different measuring times at the first, second and sixteenth spans in Saigon Bridge, including the first and second spans which are the type of prestressed concrete and the sixteenth span which is reinforced concrete and composite steel.TABLE 1:
THE VALUE fz SOME SPANS IN SAIGON BRIDGE
Span Time The note of traffic status
Value frequency
(Hz)
1
1 In the morning mainly pickup
trucks and buses, 2/10/2011 3,8
2 In the afternoon mainly pickup
trucks and buses, 10/1/2012 3,9
3 In the night mainly large
container, 15/5/2012 3,8
4 In the night mainly large
container, 10/7/2012 3,8
2
1 In the morning mainly pickup
trucks and buses, 2/10/2011 3,5
2 In the afternoon mainly pickup
trucks and buses, 10/1/2012 3,4
3 In the night mainly large
container, 15/5/2012 3,5
4 In the night mainly large
container, 10/7/2012 3,4
16
1 In the morning mainly pickup
trucks and buses, 2/10/2011 2,3
2 In the afternoon mainly pickup
trucks and buses, 10/1/2012 2,1
3 In the night mainly large
container, 15/5/2012 2,3
4 In the night mainly large
container, 10/7/2012 2,2
International Journal of Emerging Technology and Advanced Engineering
Website: www.ijetae.com (ISSN 2250-2459, ISO 9001:2008 Certified Journal, Volume 6, Issue 1, January 2016)
278
TABLE 2:THE VALUE OF THE FUNDAMENTAL FREQUENCY
f
z OF BENNOC BRIDGEBennoc Bridge The value of the fundament frequency (Hz) Span Time axis
1
1
X 5 Small trucks, car, tank trucks,…, from 9:30 to 11:
20 am, 16/5/2011. Z 5
2
X 5 Large truck, buses, pickup trucks,…, from 8:15 to 10: 30
am, 20/8/2011. Z 5
3
X 4,9 Large container, car, buses ,…, from 3 to 4:20 pm,
3/12/2011 Z 5,1
4
X 5 Buses, car, …, from 2:15 to 5: 20 pm, 5/5/2012 Z 4,9
[image:7.612.337.536.355.466.2] [image:7.612.40.298.484.649.2]The length of the span in 37 bridges was surveyed to be less than 30m and their behavior was frequently showed by single beam and the plane of bending. If this model is correct, the ratio of the fundamental frequency will be f1:f2:f3 = 1:4:1.5 []. However, the surveying of all data in condition that the fundamental frequency was determined more than one was not complied this ratio. In table 3 is the ratio of frequency fz of some spans, so the random condition of real traffic flow will appear in many different shapes of vibration in the span
TABLE 3:
THE FUNDAMENTAL FREQUENCY OF SOME BRIDGES
Bridge Span f1(Hz) f2(Hz) f3(Hz) f4(Hz)
New Giongong To
Bridge
1 4.8 5.5 6.7 12 5 3.3 3.9 5.4 10.6 8 1.9 3 3.9 8.8 Thuduc 1
overpass bridge
1 4.7 5.9 9.3 12.5 2 4.8 6.5 8.3 9.3 3 4.5 5.8 8.5 9.3 Thuduc 2
overpass bridge
1 4.8 6 8.9 12.8 2 4.6 6.2 8.8 13 3 4.8 6 8.7 13.5
Saigon Bridge
22 3.5 5.5
26 3.3 4.1 5.8
31 3.4 4.7 5.7 10.5
3.3. The appearance frequency of the harmonic fundamental frequencies (AFH)
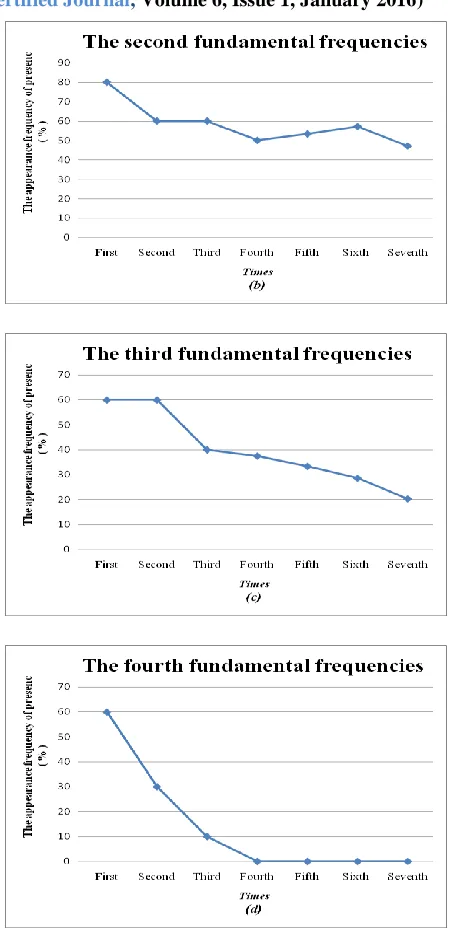
To assess the possibility of appearance of the frequencies, we will figure out the percentage frequency of occurrences of the harmonic, in which, the number of the lowest harmonic frequency will always be the highest ratio and this ratio will descend to the next frequency. Over time, the highest frequency will decline but not occurrences, and all the energy of itself will be transferred to the next frequency (priority for the high next frequency). The whole process of decline in the frequency of occurrence of the fundamental frequencies is captured by figure 3.7
In which:
fi – the appearance frequency of the resonance Ni around the value ωi at Ti
Ti – time
Ni – the number of appearing frequency ωi – the fundamental frequency
Figure 3.7: The appearance frequency of the resonance
International Journal of Emerging Technology and Advanced Engineering
Website: www.ijetae.com (ISSN 2250-2459, ISO 9001:2008 Certified Journal, Volume 6, Issue 1, January 2016)
[image:8.612.331.557.125.596.2]279
TABLE 4:THE VALUE AND PROBABILITY OF PRESENCE OF THE NATURAL FREQUENCIES IN THE EIGHTHSPAN, SAIGON
BRIDGE
Batch
Value of fundamental frequency Value The appearance frequency of
presence
First
f1 = 3.5Hz 40%
f2 = 5.8Hz 80%
f3 = 11.7Hz 60%
f4 = 17.5Hz 60%
Second
f1 = 3.5Hz 60%
f2 = 5.8Hz 60%
f3 = 11.7Hz 60%
f4 = 17.5Hz 30%
Third
f1 = 3.5Hz 60%
f2 = 5.8Hz 60%
f3 = 11.7Hz 40%
f4 = 17.5Hz 10%
Fourth
f1 = 3.5Hz 62.5%
f2 = 5.8Hz 50%
f3 = 11.7Hz 37.5%
f4 = 17.5Hz 0%
Fifth
f1 = 3.5Hz 70.56%
f2 = 5.8Hz 53.33%
f3 = 11.7Hz 33.33%
f4 = 17.5Hz 0%
Sixth
f1 = 3.5Hz 75.14%
f2 = 5.8Hz 57.14%
f3 = 11.7Hz 28.57%
f4 = 17.5Hz 0%
Seventh
f1 = 3.5Hz 81.17%
f2 = 5.8Hz 47.05%
f3 = 11.7Hz 20.28%
[image:8.612.51.306.135.714.2]f4 = 17.5Hz 0%
Figure 3.9: The value of fundamental frequencies at eighth span in Saigon Bridge
International Journal of Emerging Technology and Advanced Engineering
Website: www.ijetae.com (ISSN 2250-2459, ISO 9001:2008 Certified Journal, Volume 6, Issue 1, January 2016)
280
TABLE 5:THE VALUE AND APPEARANCE FREQUENCY OF PRESENCE IN THE FUNDAMENTAL FREQUENCIES BETWEEN THE TIME BEFORE REPAIRS ON JULY 13, 2012, AND AFTER REPAIRS ON
DECEMBER 9, 2012, AT THE EIGHTHSPAM IN SAIGON BRIDGE
Batch
Value of frequency
Value The appearance frequency of presence
Before repairs on July 13, 2012
f1 = 3.5Hz 60%
f2 = 5.8Hz 60%
f3 = 11.7Hz 0%
f4 = 17.5Hz 0%
After repairs on December
9, 2012
f1 = 3.5Hz 66%
f2 = 5.8Hz 80%
f3 = 11.7Hz 65.5%
f4 = 17.5Hz 60%
(3.10a)
(3.10b)
Figure 3.10a: The change of the appearance frequency of presence at the eighth span in Saigon Bridge between the time before repairs on
July 13, 2012, and after repairs on December 9, 2012
3.10b: The value of the fundamental frequencies at the eighth span in Saigon Bridge between the time before repairs on July 13, 2012, and
[image:9.612.49.290.184.657.2]after repairs on December 9, 2012
[image:9.612.322.566.248.584.2]Table 6 is a result of comparing between the groups of new bridges and old bridges, from which we can see that the percentage of appearing frequencies of the fundamental frequencies will be changed so that this value’s percentage increases with the increasing value of the structural stiffness
TABLE 6:
THE VALUE AND APPEARANCE FREQUENCY OF PRESENCE IN THE FUNDAMENTAL FREQUENCIES BETWEEN THE
GROUP OF NEW BRIDGES AND OLD BRIDGES
Batch Date Building
Value of natural frequencies Value
The appearance frequency of
presence
Overpass Linh Xuân Bridge
On 13 July 2012
May 2005
f1 = 4.8Hz 55.5%
f2 = 6.2Hz 50%
f3 = 8.7Hz 38.8%
Overpass Thủ Đức 2 Bridge On 13 July
2012
July 2008
f1 = 4.7Hz 45.45%
f2 = 6.1Hz 36.36%
f3 = 8.7Hz 63.63%
International Journal of Emerging Technology and Advanced Engineering
Website: www.ijetae.com (ISSN 2250-2459, ISO 9001:2008 Certified Journal, Volume 6, Issue 1, January 2016)
[image:10.612.55.285.133.298.2]281
(8b)Figure 8a: The change of the appearance frequency of presence between the groups of new bridges (Linhxuan Bridge) and old bridges
(Thuduc 2 Bridge)
Figure 8b: The value of the fundamental frequencies between the groups of new bridges (Linhxuan Bridge) and old bridges (Thuduc 2
Bridge)
IV. CONCLUSIONS
- The actual vibrations of span were caused by moving live loads which were a combination of three types of mode shape’s vibration such as: bending, torsion and torsion bending. Mathematically, this is considered a combination of private vibrations in these mode shape’s vibrations. The number of mode shape of vibrations which participated in the actual vibration which is finite and includes different vibration shapes which have value of the lowest frequencies. With the bridges survey, we have structures of prestressed concrete, reinforced concrete and composite steel and the number of the highest in actual vibration shapes were five for the new construction bridges and one for the old construction bridges. They have the length of spans less than 30m, so the private vibration shapes will be the lowest frequencies, such as first mode bending, first mode torsion, first mode torsion bending and second mode bending.
- Under the effect of the live traffic load, appearance frequency of the harmonic in vibration shapes is always different. The large difference belongs to the old bridges or more precisely on the weaker spans in which there is stiffness deterioration. However, the least appearance frequency belongs to the private vibration shapes that have the highest of value ωr. This suggests that there exists a relationship between degradation prognosis and appearance frequency of the private vibration shapes.
- The appearance frequency of the private vibration shapes corresponding to the value of the highest frequency will be smallest and they have the biggest change when compared with the other appearance frequencies of the private vibration shapes. It can be seen that appearance frequency between the new construction and the old construction bridges will have very significant changes. The appearance frequency of the new construction bridges have not changed much over time; however, the value of the old construction bridges and particularly the weaker spans will decrease over time.
- The value of all of the fundamental frequencies in which all of the spans in the bridges were surveyed remained almost unchanged during the time of researching (over one year). They are nearly the same for the spans in the same structure of the bridge. Among the surveyed bridges are some that have been identified for the lowest of the value frequency since many years ago. This value frequency coincided with the lowest fundamental frequency that is identified in this research. Thus, from the actual measurement data, it can be seen that the value of the fundamental frequency is a parameter which is not sensitive for small changes in the degradation prognosis of the span bridge.
- This research shows that the appearance frequency is a potential parameter in the algorithms of degradation prognosis of the span bridge because the data of the actual vibration can perform very easily and less expensively. Therefore, the idea of using appearance frequency will open up the possibility of regular monitoring for the bridges.
- There are differences in perceptions of the role of the fundamental frequency. According to traditional evaluation methods, the value of the fundamental frequency will be heavily dependent on the degradation prognosis of the bridge. However, many scientific works have shown that they were less dependent on the stiffness. With results of experimental measurements, not only will the lowest of the value of the fundamental frequency appear but also many others frequencies that have value higher than the fundamental frequency will appear.
V. FUTURE TRENDS
International Journal of Emerging Technology and Advanced Engineering
Website: www.ijetae.com (ISSN 2250-2459, ISO 9001:2008 Certified Journal, Volume 6, Issue 1, January 2016)
282
Although all of the data were measured at the bridge, the quantifying of degradation prognosis has not been done. The next research will need to address these problems:1.Find rules of degradation prognosis and changing of the appearance frequency
2.Provide an explanation on the basis of the mechanics on this phenomenon
Acknowledgements
The research group was supported by the Department of Transportation of Ho Chi Minh City
REFERENCES
[1] Doebling, S. W., Farrar, C. L., Prime, M. B., and Shevitz, D. W. (1996), "Damage identification and health monitoring of structural and mechanical systems from changes in their vibration characteristics: A literature review" Los Alamos National Laboratory Report, LA-13070-MS.
[2] Doebling, S. W., Farrar, C. R. and Prime, M. B. ―A Summary Review of Vibration Based Damage Identification Methods‖, The Shock and Vibration Digest, 30, 1998, paper 91-105.
[3] F. Wan and L. X. Wang, ―On the persistent excitation conditions of adaptive fuzzy systems in nonlinear identification‖, Proc. IEE Conf. Decision Control, 2000, paper 858-863
[4] Wauer, J, ―On the dynamic of crack rotors: A Literature Survey‖, Applied Mechanics Review, 43, 2000, paper 13-17.
[5] Steven B. Chase, ―Dynamics Bridge Substructure Evaluation and Monitoring‖, Ph.D. Acting Director, Office of Infrastructures Research and Development .
[6] Aiko Furukawa, Hisanori Otsuka, ―Structural Damage Detection Method Using Uncertain Frequency Response Function‖, Computer-Aided Civil and Infrastructure Engineering, 21, 2006, paper 292-305.
[7] C., P. & Adams, R. D, ―The Location of Defects in structure from Measurement of Natural Frequencies‖, Journal of Vibration and Acoustics, 142(2), 1979, paper 49-57.
[8] Fox, C. H. J., ―The Location defects in Structure: The Compare of The Use of Natural Frequency and Mode Shape Data‖, in Proc. of The 10th International Model Analysis Conference, 1992, paper 522-528.
[9] Hearn G., Testa R.B., ―Modal Analysis for Damage Detection in Structure‖, Journal of Structural Engineering (ASCE), 117 (10), 2001, paper 3042-3063
[10] Iskhakov, I., and Ribakov, Y. (2005). ―Experimental and numerical investigation of a full-scale multistory RC building under dynamic loading‖ The Structural Design of Tall and Special Buildings, 14(4), 299-313.)