International Journal of Emerging Technology and Advanced Engineering
Website: www.ijetae.com (ISSN 2250-2459,ISO 9001:2008 Certified Journal, Volume 4, Issue 7, July 2014)
100
Estimation of Damage Length of Maritime Structures Caused
by Typhoon 9918 Based on iEWE Method
Ryusuke Hashimura1
1Associate Professor, Sojo University, 4-22-1 Ikeda, Kumamoto 860-0082, Japan
Abstract—In 1999, Typhoon 9918 struck Kyushu Island, which is located in Western Japan. During the strongest stage of the typhoon, the central pressure was 930 hPa and the maximum wind speed was 45 m/s near the center of the typhoon. The maximum storm tide was over 2 m along the coast of Kumamoto Prefecture on Kyushu Island. Due to the storm surges and wind waves, the typhoon caused enormous damage to maritime structures, including breakwaters, sea walls, sea dikes, jetties, wharves etc. In this paper, the EWE (Equivalent Wave Energy) Method is used to estimate the damage length of maritime structures along the coast caused by Typhoon 9918. Based on 75 previous typhoons, the iEWE Method creates an index that determines the vulnerability of the coast to a typhoon with a specified path. This index is estimated using the path of Typhoon 9918 as determined from the location and the direction of the typhoon at a latitude of 30° N. The vulnerability index of maritime structures is calculated based on the path of the typhoon and coastline. The damage length is estimated using the vulnerability index and the EWE of the typhoon at a latitude of 30° N. Based on the results, the iEWE Method can estimate the damage level of maritime structures that will occur along the coast before a typhoon strikes.
Keywords— Damage Length, Equivalent wave energy, Sensitivity, Smoothed damage length, Storm surge, Typhoon, Vulnerability.
I. INTRODUCTION
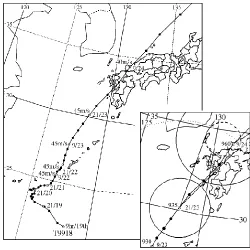
As shown in Figure 1, Typhoon 9918 struck Kyushu Island, which is located in Western Japan. The inset in Figure 1 shows the storm area where the wind speed exceeded 25 m/s as forecasted by the JMA. The dotted circle in the inset shows the area where the wind speed exceeded 15 m/s. The long-dash circle is the 70% probability circle for the location of the center of Typhoon 9918 at 09:00 on September 24th, 1999.
An anomalous storm surge was induced in the closed sea of the western region of Kyushu Island (Figure 2) by Typhoon 9918. The maximum anomaly was estimated to be about 3 m at the northern part of the west coast of Yatsushiro Sea (Takigawa, K. and Y. Tabuchi, 2000). The maximum sea level was equivalent to about 2.2 m above Highest High Water Level (H.H.W.L).
The damage due to the storm surges and wind waves caused by Typhoon 9918 was reported by the government of the Kumamoto Prefecture. A total of 16 people were killed, 62,772 houses damage or destroyed, and 1,883 houses were flooded. The total cost of the damage was about US$1 billion. The significant storm surge due to Typhoon 9918 caused extensive flooding. In the northern part of the western coast of Yatsushiro Sea, 12 people were killed by the storm surge. The total alongshore damage length of maritime structure cases facing the west coast of Yatsushiro Sea, denoted by L, is 8,047m.
Figure 1 Track of Typhoon 9918 along with its probability circles as given by the Japan Meteorological Agency (JMA). The wind speed is in m/s, and the date is given as hours/day. In the inset, the pressure in
hPa is given instead of the wind speed[5].
[image:1.612.332.582.351.601.2]International Journal of Emerging Technology and Advanced Engineering
Website: www.ijetae.com (ISSN 2250-2459,ISO 9001:2008 Certified Journal, Volume 4, Issue 7, July 2014)
101 In a previous paper, the damage length of maritime structures attributed to Typhoon 9918 was estimated using the EWE Method (Hashimura, R., 2006, Hashimura, R., 2007b). The EWE Method uses a vulnerability index for the given coast and typhoon passage. This index is based on the damage caused by 43 typhoons in the 15 years.
In this paper, the damage length of maritime structures attributed to Typhoon 9918 was estimated using the iEWE Method (Hashimura, R., 2013). The iEWE Method uses a vulnerability index for the given coast and typhoon passage. This index is based on the damage caused by 75 typhoons in the 25 years.
[image:2.612.62.283.312.592.2]The damage length is estimated based on the path of Typhoon 9918 as determined from the typhoon’s location and direction of movement at a latitude of 30° N.
Figure 2 The 8 coastal regions located in the Kumamoto and Nagasaki Prefectures[5]
The vulnerability index of maritime structures at the coast is given from the course and the coast.The damage level, which is shown by the damage length, is estimated using the vulnerability index and the EWE of the typhoon at a latitude of 30° N. Similar estimations were done for each of the other courses.
II. OUTLINE OF TYPHOON 9918
Typhoon 9918 moved northward and grew to its strongest stage in the East China Sea at 21:00 on September 22nd, 1999 (Figure 1). After that, Typhoon 9918 passed through the Ariake Sea off the southwestern coast of the Kumamoto Prefecture, which is located in the western part of Kyushu Island (Figure 2). At 03:00 on September 24th, the central pressure was 935 hPa, and the maximum wind speed was 45 m/s. The typhoon struck the northern part of Kumamoto Prefecture at around 06:00 on September 24th. The central pressure was 950 hPa, and the maximum wind speed was 40 m/s.
A significant storm surge, high seas, and strong winds were experienced along the coasts in the Prefectures of Kumamoto, Nagasaki and others. Strong southerly winds greater than 30 m/s were observed in Kumamoto Prefecture.
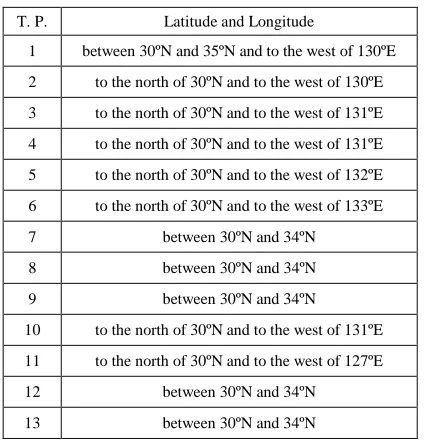
[image:2.612.340.548.386.617.2]The 43 typhoons, which passed through an area delineated by a latitude of 30° N and 35° N and a longitude of 127° E and 132° E, between 1980 and 1994 were divided into 13 groups based on their paths (Figure 3) (Hashimura, R., 2002).
Figure 3 Historical typhoon paths[2], [7]
International Journal of Emerging Technology and Advanced Engineering
Website: www.ijetae.com (ISSN 2250-2459,ISO 9001:2008 Certified Journal, Volume 4, Issue 7, July 2014)
[image:3.612.63.275.420.640.2]102 The longitude of the typhoon’s position at a latitude of 30°N was 128.3° E. The direction of progress was 22.5° clockwise from north. Therefore, Typhoon 9918 can be classified as a No. 4 Typhoon based on the classification in Table 1. The classification is based on a latitude of 30° N, since at this point the typhoon’s direction of movement is roughly fixed and the scale becomes stable.
III. EQUIVALENT WAVE ENERGY
Considering the effect of waves on the maritime structure damage, not only the wave height H but also the wave period T is important. The maximum wind speed and the duration of strong wind are closely related to the typhoon energy and its transfer. Wind waves gain its energy from the typhoon energy, and the wave height and period increase in the process of typhoon energy transfer.
In this paper, the damage length of maritime structures at the coasts and the harbors is estimated based on the equivalent wave energy of typhoon. The equivalent wave energy is defined as H2T2 (Hashimura, R., 2007b). It is determined based on the duration time of wind blowing and the maximum wind speed near the center of typhoon.
TABLE 1
SPECIFIED AREA TO ESTIMATE TO ESTIMATE EWE[4],[7]
T. P. Latitude and Longitude
1 between 30ºN and 35ºN and to the west of 130ºE 2 to the north of 30ºN and to the west of 130ºE 3 to the north of 30ºN and to the west of 131ºE 4 to the north of 30ºN and to the west of 131ºE 5 to the north of 30ºN and to the west of 132ºE 6 to the north of 30ºN and to the west of 133ºE 7 between 30ºN and 34ºN
8 between 30ºN and 34ºN 9 between 30ºN and 34ºN
10 to the north of 30ºN and to the west of 131ºE 11 to the north of 30ºN and to the west of 127ºE 12 between 30ºN and 34ºN
13 between 30ºN and 34ºN
To determine the wind speed and its duration, different areas are specified for each course (Table 1). The areas were determined considering the effectiveness of waves on the damage of the maritime structures along the coasts in Kumamoto Prefecture and the Nagasaki Prefecture. The first column in Table 1 indicates the course number of typhoon shown in Figure 3.
By observing the maximum wind speed Vmax,i at time ti
and the maximum wind speed Vmax,i+1 at time ti+1 (=ti+∆t),
the average maximum wind speed Vmax,ave is defined by Eq.
(1).
Vmax,ave= [∑{(Vmax,i+1+Vmax,i)/2} × (ti+1-ti)]/ ∑(ti+1-ti) (1)
The maximum wind speed near the center of typhoon at a standard observatory time is periodically observed every one, three or six hours by Japan Meteorological Agency (JMA). The time t1 is adjusted at the observatory time when
the typhoon passes through the 30 degrees north latitude. tn
is the time when the typhoon passes out from the specified area (Table 1) for each typhoon course. The duration, t, is determined by tn-t1.
Next, the significant wave height, H1/3, and period, T1/3,
are determined from the wave forecasting curves based on SMB method by using the duration, t, and average maximum wind speed, Vmax,ave, calculated by Eq. (1). The
equivalent wave energy, E, is calculated as H1/32T1/32, the
equi-value lines of which are shown in the wave forecasting curves based on SMB method.
IV. ESTIMATION OF THE SMOOTHED DAMAGE LENGTH
USING THE IEWE
A. Smoothed Damage Length for Each Coast
The damage length for each coast is defined as the damage length of maritime structures damaged by each typhoon, which can be given by Eq. (2)
Ls = (Ld/Lt)×100 (2)
Where Ls is the smoothed damage length, Ld is the
damage length caused by each typhoon for each coast, and Lt is the total damage length by all typhoons for this
particular coast. The smoothed damage length indicates the contribution to the total damage for the coast by each typhoon.
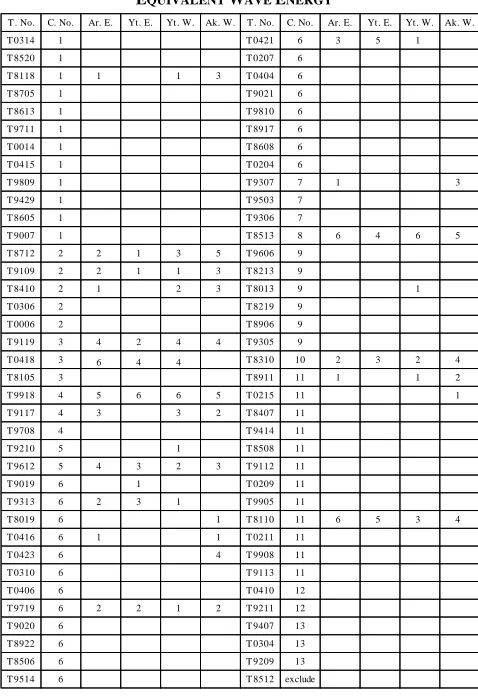
Table 3 shows the calculated smoothed damage length. The second column (C. No.) indicates the path No. as determined based on Figure 3 and Table 1. The typhoons are ordered based on [1] the path No., [2] the maximum wind speed near the typhoon center, and [3] the central typhoon pressure at a latitude of 30° N.
B. The Relationship between the EWE of Typhoon and the Smoothed Damage Length
The smoothed damage length is expected to increase rapidly with an increase in the maximum wind speed (Hashimura, 2003). This trend can be expressed by Eq. (3).
[image:3.612.62.276.420.640.2]International Journal of Emerging Technology and Advanced Engineering
Website: www.ijetae.com (ISSN 2250-2459,ISO 9001:2008 Certified Journal, Volume 4, Issue 7, July 2014)
103 Where Vmax is the maximum wind speed near the
typhoon center, Ls is the smoothed of damage length.
Based on the classification of JMA, the value of m for the first 7 ranks are 17, 25, 29, 33, 37, 41 and 44 m/s (Hashimura, R., 2002).
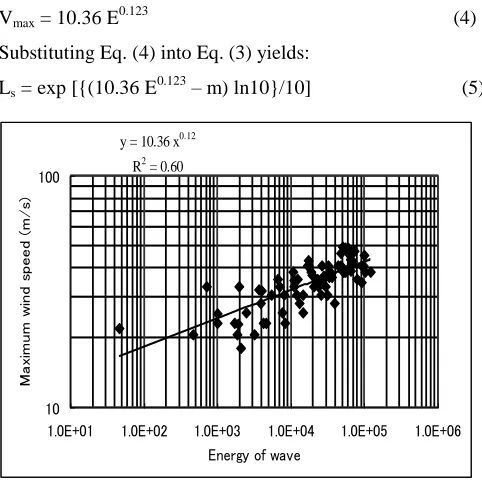
Figure 4 shows a relationship between the maximum wind speed near the center and the equivalent wave energy (EWE) based on the 75 typhoons (Hashimura, R., 2013). Applying regression analysis to the data in Figure 4, the following relationship was obtained between the maximum wind speed and the EWE, E:
Vmax = 10.36 E0.123 (4)
Substituting Eq. (4) into Eq. (3) yields:
Ls = exp [{(10.36 E 0.123
[image:4.612.49.290.265.505.2]– m) ln10}/10] (5)
Figure 4 Equivalent wave energy of typhoons and maximum wind speeds[7]
Figure 5 Equivalent wave energy and smoothed damage length[7]
The horizontal axis, E, in Figure 5 shows the equivalent wave energy of typhoon. The vertical axis shows the smoothed damage length. Table 3 shows the smoothed damage length for each typhoon along each coast as plotted in Figure 5. The symbols represent the different coasts. The lines a to g in Figure 5 show the theoretical values predicted using Eq. (5), with the values of m varying from 44 to 17. The numerical values, 1 to 6, shown outside of the figure, denote the six areas delineated by the lines b to f.
C. Sensitivity of Typhoon iEWE
Table 4 shows the number of areas in which the plotted point is located. When no damage occurs, the number is not shown. The number given in Table 4 is termed the ―sensitivity value‖ for typhoon iEWE based on the damage length. The sensitivity value indicates the vulnerability of the coast to the individual typhoons. It should be noted that a typhoon with the largest smoothed damage length at the coast does not always have the largest sensitivity value.
V. THE APPLICATION OF THE PATHS TO TYPHOON 9918 Table 6 shows the damage length and other parameters for each path of Typhoon 9918. The first line shows No. of typhoon path for Typhoon 9918. The second line shows the duration of wind blowing. The third line shows the value of EWE for each path of Typhoon 9918. The fifth line shows the right side line and its m value at each region shown in Fig. 5. The sixth line shows the left side line and its m value at each region shown in Fig. 5. The seventh and eighth line shows the smoothed damage length for right and left lines. The ninth and tenth line shows the damage lengths. As shown in Table 6, the EWE of typhoon 9918 for path No. 4 was 60,200 at a latitude of 30° N.
y = 10.36 x0.12
R2 = 0.60
10 100
1.0E+01 1.0E+02 1.0E+03 1.0E+04 1.0E+05 1.0E+06
Energy of wave
M
a
x
im
um
w
ind
s
peed
(
m
/s
[image:4.612.50.286.533.700.2]International Journal of Emerging Technology and Advanced Engineering
Website: www.ijetae.com (ISSN 2250-2459,ISO 9001:2008 Certified Journal, Volume 4, Issue 7, July 2014)
104 TABLE 4
SENSITIVITY VALUES OF SMOOTHED DAMAGE LENGTH FOR EQUIVALENT WAVE ENERGY[7]
Based on Table 6, the maximum sensitivity value for the western coast of Yatsushiro Sea for path No. 4 is 6. From Figure 5, it can be seen that Region 6 is located in the left side of line f. Thus, the smoothed damage length, Ls, is
obtained from Eq. (5) for a sensitivity value of 6 and a typhoon EWE of 60,200. The minimum smoothed damage length, Ls, is 32.4, which was obtained by substituting m =
25 for line f. The range for the smoothed damage length along the western coast of Yatsushiro Sea for Typhoon 9918 is greater than 32.4. Therefore, it is clear that the actual length (L=8,047 m) is included in the range 6. The total damage length along the western coast of Yatsushiro Sea during the last 25 years was Lt = 16,544 m. The
damage length for Typhoon 9918 is estimated to be 32.4 % of 16,544 m, that is, 5,365 m.
The estimated damage length is a small compared with the actual length (L = 8,047 m), but the actual length is included in region 6.
TABLE 5
MAXIMUM SENSITIVITY VALUES FOR THE SMOOTHED DAMAGE LENGTH[7]
TABLE 6
DAMAGE LENGTH FOR EACH PATH OF TYPHOON 9918
On the other hand, comparing the track of Typhoon 9918, shown in Figures 1 with the 13 tracks given in Figure 3, the path of Typhoon 9918 is considered similar to the paths No. 3, 5, 6, 7, or 8.
Based on Table 5, the maximum sensitivity value along the western coast of Yatsushiro Sea for path No. 3 is 4. Based on Table 5, the maximum sensitivity value along the western coast of Yatsushiro Sea for path No. 5 is 2. Performing a similar calculation yields the maximum damage length for Typhoon 9918 as 1.0 % to 2.6 % of 16,544 m, that is, from 172 m to 432 m. These values are smaller than the actual length (L = 8,047 m). The maximum sensitivity value for path No. 6 is 1. The maximum sensitivity value for path No. 7 is 0.
Based on Table 5, the maximum sensitivity value along the western coast of Yatsushiro Sea for path No. 8 is 6. The smoothed damage length, Ls, is obtained from Eq. (5) for the sensitivity value 6 and the typhoon EWE of 61,000. The minimum smoothed damage length is 32.9, which was obtained by substituting m = 25 for line f. Thus, the minimum damage length for Typhoon 9918 is estimated to be 32.9% of 16,544 m, that is, 5,446 m. The range of damage length of region 6 is greater than 5,446 m. Therefore, it is clear that the actual length (L = 8,047 m) is included in the range 6. Thus, the result is the same as assuming a path No. 4 case.
T . No. C. No. Ar. E. Yt. E. Yt. W. Ak. W. T . No. C. No. Ar. E. Yt. E. Yt. W. Ak. W.
T 0314 1 T 0421 6 3 5 1
T 8520 1 T 0207 6
T 8118 1 1 1 3 T 0404 6
T 8705 1 T 9021 6
T 8613 1 T 9810 6
T 9711 1 T 8917 6
T 0014 1 T 8608 6
T 0415 1 T 0204 6
T 9809 1 T 9307 7 1 3
T 9429 1 T 9503 7
T 8605 1 T 9306 7
T 9007 1 T 8513 8 6 4 6 5
T 8712 2 2 1 3 5 T 9606 9
T 9109 2 2 1 1 3 T 8213 9
T 8410 2 1 2 3 T 8013 9 1
T 0306 2 T 8219 9
T 0006 2 T 8906 9
T 9119 3 4 2 4 4 T 9305 9
T 0418 3 6 4 4 T 8310 10 2 3 2 4
T 8105 3 T 8911 11 1 1 2
T 9918 4 5 6 6 5 T 0215 11 1
T 9117 4 3 3 2 T 8407 11
T 9708 4 T 9414 11
T 9210 5 1 T 8508 11
T 9612 5 4 3 2 3 T 9112 11
T 9019 6 1 T 0209 11
T 9313 6 2 3 1 T 9905 11
T 8019 6 1 T 8110 11 6 5 3 4
T 0416 6 1 1 T 0211 11
T 0423 6 4 T 9908 11
T 0310 6 T 9113 11
T 0406 6 T 0410 12
T 9719 6 2 2 1 2 T 9211 12
T 9020 6 T 9407 13
T 8922 6 T 0304 13
T 8506 6 T 9209 13
T 9514 6 T 8512 exclude
Course No. 1 2 3 4 5 6 7 8 9 10 11 12 13
Ar. E. (Closed) 1 2 6 5 4 3 1 6 0 2 6 0 0
Yt. E. (Closed) 0 1 4 6 3 5 0 4 0 3 5 0 0
Yt. W. (Closed) 1 3 4 6 2 1 0 6 1 2 3 0 0
Ak. W. (Open) 3 5 4 5 3 4 3 5 0 4 4 0 0
1 Typhoon path No. 3 No. 4 No. 5 No. 6 No. 7 No. 8
2 Duration 11hrs 42min. 11hrs 42min. 15hrs 54min. 17hrs 24min. 12hrs 42min. 12hrs 42min.
3 Value of EWE 60200 60200 74300 90500 61000 61000
4 Maximum sensitivity 4 6 2 1 0 6
5 Right line and m value at
region in Fig. 5
m=33 for d line
m=25 for f line
m=41 for b line
m=25 for f line
6 Left line and m value at
region in Fig. 5
m=29 for e line
m=37 for c line
m=41 for b line
7 S.D.L. for right line 5.14 32.43 1.04 32.92
8 S.D.L. for left line 12.91 2.61 1.31
9 D.L. for right line (m) 850 5365 172 5446
[image:5.612.48.287.159.508.2] [image:5.612.322.564.179.373.2]International Journal of Emerging Technology and Advanced Engineering
Website: www.ijetae.com (ISSN 2250-2459,ISO 9001:2008 Certified Journal, Volume 4, Issue 7, July 2014)
105 VI. DISCUSSION
TABLE 7
TIDE AND SEA LEVELS DURING TYPHOON PASSAGE
[image:6.612.48.290.171.494.2]The application of path No. 3, 4, 5, 6, 7, and 8 to Typhoon 9918 shows that the estimated values of total damage length of maritime structures along the western coast of Yatsushiro Sea differ greatly.
[image:6.612.53.282.550.692.2]Figure 6 Example of tidal elevation of Typhoon 9119 at Misumi tide station
Figure 6 Example of tidal elevation of Typhoon 9119 at Misumi tide station[5]
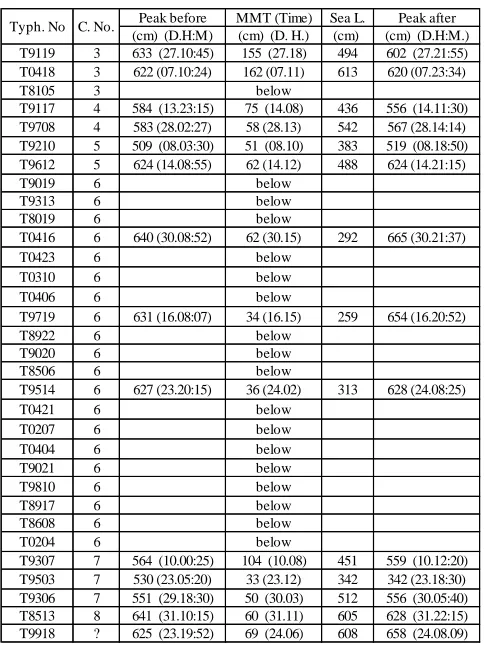
It was shown that the estimated damage along the western coast of Yatsushiro Sea is largely affected by the changes in the path of the typhoon. Figure 6 shows the tidal elevation of Typhoon 9119. Table 7 shows the maximum meteorological tide and the sea level due to the typhoons following path No. 3 to 8, and the tide due to Typhoon 9918 based on data from the Misumi tide station. In Figure 6, the left vertical axis shows the sea level, and the right vertical axis shows the scale for meteorological tide.
Under normal circumstances, the maximum
meteorological tide does not occur at the same time as the maximum astronomical tide (Figure 6). The third column (Peak before) indicates the peak sea level and the time (day, hour, and minute) when the maximum astronomical tide occurred before the maximum meteorological tide occurred. The fourth column (MMT) indicates the maximum meteorological tide and the time (day and hour). The fifth column (Sea L.) is the sea level when the maximum meteorological tide occurred. The sixth column (Peak after) indicates the peak sea level and the time (day, hour, and minute) when the maximum astronomical tide occurred after the maximum meteorological tide occurred. In Table 7, ―below‖ is used to indicate that the maximum meteorological tide value was below 30 cm.
For Typhoon 9117, which followed path No. 4, the maximum meteorological tide occurred 3.5 hours before the second maximum astronomical tide. The sea level at this time was rather low, 436 cm. Thus, it can be assumed that the damage caused by Typhoon 9117 was not due to the storm surge. For Typhoon 9708, which followed path No. 4, the maximum meteorological tide occurred 1.2 hours before the second maximum astronomical tide. The sea level at this time was not particularly high, 542 cm. For Typhoon 9918, although the maximum meteorological tide occurred 2 hours before the second maximum astronomical tide, the sea level was rather high, 608 cm. For this reason, when using path No. 4 conditions, the estimated damage length is a little small compared to the actual length. In fact, the very high storm surge had occurred along the northern coast facing the west coast of Yatsushiro Sea. Therefore, the actual damage length was three times greater than the estimated damage length of 5,365 m.
For Typhoon 9119, which followed path No. 3, the maximum meteorological tide was 155 cm, which is the second largest value between 1945 and 2004. However, it occurred 1 hour after the time of the minimum astronomical tide, while the sea level at the maximum meteorological tide was low at 494 cm. For this reason, when using path No. 3 conditions, the estimated damage length is smaller than the actual length.
Peak before MMT (Time) Sea L. Peak after (cm) (D.H:M) (cm) (D. H.) (cm) (cm) (D.H:M.) T9119 3 633 (27.10:45) 155 (27.18) 494 602 (27.21:55) T0418 3 622 (07.10:24) 162 (07.11) 613 620 (07.23:34)
T8105 3 below
T9117 4 584 (13.23:15) 75 (14.08) 436 556 (14.11:30) T9708 4 583 (28.02:27) 58 (28.13) 542 567 (28.14:14) T9210 5 509 (08.03:30) 51 (08.10) 383 519 (08.18:50) T9612 5 624 (14.08:55) 62 (14.12) 488 624 (14.21:15)
T9019 6 below
T9313 6 below
T8019 6 below
T0416 6 640 (30.08:52) 62 (30.15) 292 665 (30.21:37)
T0423 6 below
T0310 6 below
T0406 6 below
T9719 6 631 (16.08:07) 34 (16.15) 259 654 (16.20:52)
T8922 6 below
T9020 6 below
T8506 6 below
T9514 6 627 (23.20:15) 36 (24.02) 313 628 (24.08:25)
T0421 6 below
T0207 6 below
T0404 6 below
T9021 6 below
T9810 6 below
T8917 6 below
T8608 6 below
T0204 6 below
International Journal of Emerging Technology and Advanced Engineering
Website: www.ijetae.com (ISSN 2250-2459,ISO 9001:2008 Certified Journal, Volume 4, Issue 7, July 2014)
106 For Typhoon 0418, which followed path No. 3, the maximum meteorological tide was 162 cm, which is the largest value. The sea level at this time was 613 cm, which was the highest sea level at the time when the maximum meteorological tide occurred. Thus, it can be assumed that the damage caused by Typhoon 0418 was due to the storm surge. For this reason, when using path No. 3 conditions, the estimated damage length is roughly similar to the actual length.
The storm surge is small for typhoons that follow path No. 5, 6, and 7. For this reason, when using path No. 5, 6, or 7 conditions, the estimated damage length is very small compared to the actual length.
The sea level at the maximum storm surge induced by Typhoon 8513, which followed path No. 8, was high, 605 cm. The maritime structures along the western coast of Yasushiro Sea suffered serious damage caused by the storm surge and the wind waves during high tide. For this reason, when using path No. 8 conditions, the range of the estimated damage length for line of Typhoon 8513 is almost same as the estimated damage range caused by Typhoon 9918. In fact, for both Typhoons 8513 and 9918, the sea level at the maximum meteorological tide was high (608 cm for Typhoon 9918 and 605 cm for Typhoo 8513) (Table 7). Consequently, the actual damage length (L=8,047 m) is included in the range of 6 for Typhoon 8513 and 9918 shown in Figure 5. The reason is that the equivalent wave energy is almost same values for them shown in Table 6. The course of Typhoon 9918 was different from the course of Typhoon 8513, which followed path No. 8. The maximum wind speed of Typhoon 8513 did not decrease after passing a latitude of 30° N, while the maximum wind speed of Typhoon 9918 did not rapidly decreased after passing 30° N (Figure 1).
VII. CONCLUSIONS
In 1999, Typhoon 9918 struck Kyushu Island, which is in the western part of Japan, causing enormous damage to maritime structures. The damage length to maritime structures caused by Typhoon 9918 was estimated using the iEWE Method (Hashimura, R., 2006), and compared with the actual damage length. When path No. 3 condition, which were determined by the position and the direction of the typhoon at a latitude of 30° N, was applied, the estimated length was small compared with the actual length. Similarly, when path No. 4 condition was applied, the estimated length was a little small.
Compared to the actual length, the estimated damage length for path No. 5 conditions was very small; for path No. 6 and 7 conditions, the estimated length was extremely small; while for path No. 8 conditions it was the same damage length as the application of No. 4 condition. This can be explained by noting that, except for path No. 8 typhoons, no serious storm surges were observed for path No. 3, 4, 5, 6, and 7 typhoons, while Typhoon 9918 had a substantive storm surge. In order to improve the accuracy of the EWE method, the effect of the storm surge should be included, and the effectiveness of the central pressure of typhoon should be considered.
Acknowledgements
I would like to thank Prof. emeritus K. Takikawa of Kumamoto University and Prof. emeritus T. Sakai of Kyoto University for their useful advice. I am also grateful to the staff of all the public offices of the prefectures, cities, towns and land divisions surveyed, who provided data on Kumamoto and Nagasaki Prefectures, and to the members of the Japan Meteorological Agency for their cooperation. This work is supported by JSPA (JAPAN SOCIETY FOR THE PROMOTION OF SCIENCE) KAKENHI Grant Numbers 17510153 and 25350512.
REFERENCES
[1] Takikawa, K. and Tabuchi, Y., 2000. Characteristics of storm surge and sea waves due to Typhoon 9918 in the Shiranui-Sea, Proceedings of Coastal Engineering, JSCE, Vol. 47(1), pp. 291-295 (in Japanese).
[2] Hashimura, R., 2002. A study of forecasting method on damage level of maritime structures caused by typhoons, Proceedings of the 5th International Conference on Hydro-Science and Engineering, Warsaw, Poland, IAHR, pp.1-9.
[3] Hashimura, R., 2003. Forecasting method of damage length of maritime structures caused by typhoons, XXX IAHR Congress Proceedings, THEME A Coastal environment: Processes and integrated Management, Thessaloniki, Greece, pp.505~512. [4] Hashimura, R., 2006. Forecasting of damage length of maritime
structures caused by Typhoons based on equivalent wave energy, Pacific 2006 International Maritime Conference Proceedings, Sydney, Australia, pp. 1~10, CD-ROM, 2006.
[5] Hashimura, R., 2007a. Using the Magnitude Method to forecast damage to maritime structures caused by Typhoon 9918, Jornal of Coastal Research SI 50, pp.1126~1131.
[6] Hashimura, R., 2007b. Forecasting of damage length of maritime structures caused by Typhoon 9918 based on EWE method, Proceedings of the 3rd International symposium on Geo-information
for disaster management, Toronto, Canada, pp1~10, CD-ROM [7] Hashimura, R., 2013. Forecasting damage length of maritime
![Figure 2 The 8 coastal regions located in the Kumamoto and Nagasaki Prefectures[5]](https://thumb-us.123doks.com/thumbv2/123dok_us/8709985.881655/2.612.62.283.312.592/figure-the-coastal-regions-located-kumamoto-nagasaki-prefectures.webp)