AGEING IN DOGS (CANIS FAMILIARIS) AND
ITS RELATIONSHIP TO THEIR ENVIRONMENT
LUÍSA MASCARENHAS LADEIA DUTRA
Ageing in dogs (Canis Familiaris) and its
rela-tionship to their environment
Luísa Mascarenhas Ladeia Dutra
This thesis is presented to the School of Environmental & Life Science, University of Salford, in fulfilment of the requirements for the degree of Ph.D.
Supervised by Professor Robert J. Young
Co-supervised by Professor Jean Phillippe Boubli
i
Table of contents
Chapter 1 General Introduction ... 19
1.1 Animal Welfare Assessment ... 19
1.2 Evaluation of stress levels as a measure of animal welfare ... 21
1.3 Telomeres as biological clocks ... 25
1.4 Apparent age as a measure of life experience ... 29
1.5 Canids as a model group ... 31
1.6 Thesis structure ... 32
Chapter 2 Validating the use of oral swabs for telomere length assessment in dogs 34 2.1 Introduction ... 34
2.2 Objective ... 37
2.3 Justification ... 37
2.4 Methods ... 38
2.4.1 Ethical statement: ... 38
2.4.2 Samples ... 38
2.4.3 DNA extraction... 40
2.4.4 DNA quantification ... 40
2.4.5 Primer validation ... 41
2.4.6 qPCR assay ... 42
2.4.7 Measuring relative telomere length (RTL) ... 44
2.4.8 Statistical Analysis ... 44
2.5 Results ... 45
2.5.1 DNA quantity and quality ... 45
ii
2.6 Discussion ... 47
Chapter 3 Validating telomere length as a marker for animal welfare in domestic dogs 49 3.1 Introduction ... 49
3.2 Objectives ... 54
3.3 Justification ... 54
3.4 Methods ... 54
3.4.1 Subjects ... 54
3.4.2 Dog housing and husbandry ... 55
3.4.3 Collection of faeces: ... 56
3.4.4 Hormone Extraction ... 56
3.4.5 Enzyme Immunoassay ... 57
3.4.6 Swab collection ... 57
3.4.7 DNA extraction and quantification ... 57
3.4.8 qPCR assay ... 58
3.4.9 Measuring relative telomere length (RTL) ... 58
3.4.10 Statistical analysis ... 58
3.5 Results ... 59
3.5.1 Model 1: Factors that impact on a dog’s relative Telomere Length ... 59
3.5.2 Model 2: Factors that impact on a kennel dog’s relative Telomere Length 60 3.5.3 Model 3: Factors that impact on a laboratory dog’s relative Telomere Length 61 3.6 Discussion ... 63
iii
4.1 Introduction ... 67
4.2 Objective ... 72
4.3 Justification ... 72
4.4 Methods ... 72
4.4.1 Ethical statement ... 72
4.4.2 Subjects’ background ... 73
4.4.3 Subjects ... 75
4.4.4 Swab collection ... 82
4.4.5 DNA Extraction ... 82
4.4.6 DNA Quantification ... 82
4.4.7 qPCR assay ... 82
4.4.8 Measuring relative telomere length (RTL) ... 83
4.4.9 Data collection and statistical analyses ... 83
4.5 Results ... 86
4.5.1 DNA extraction kits - Pilot Study ... 86
4.5.2 Grouping Dogs... 87
4.5.3 Relative Telomere Length and Age in dogs’ groups ... 88
4.5.4 Association of rTL and Age ... 88
4.5.5 Model 1: Association of rTL and two-year-old dogs ... 92
4.5.6 Model 2: Association of rTL and dogs’ breed ... 94
4.5.7 Model 3: Factors that impact on a dog’s relative Telomere Length ... 95
4.5.8 Investigating significant factors from Model 3 ... 97
iv
4.6 Discussion ... 108
Chapter 5 Evaluating laboratory dogs’ relative Telomere Length over one year 115 5.1 Introduction ... 115
5.2 Objectives ... 118
5.3 Justification ... 118
5.4 Methods ... 119
5.4.1 Laboratory Dogs ... 119
5.4.2 Dog housing and husbandry from 2017 and 2018 ... 120
5.4.3 Swab collection ... 121
5.4.4 DNA extraction and quantification ... 121
5.4.5 qPCR assay ... 121
5.4.6 Measuring relative telomere length (RTL) ... 122
5.4.7 Statistical Analysis ... 122
5.5 Results: ... 122
5.5.1 Descriptive statistics for years 17 and 18 ... 122
5.5.2 Swab rTL were significantly different ... 123
5.6 Discussion ... 125
Chapter 6 Evaluating Dogs’ Welfare through ‘apparent age’ ... 127
6.1 Introduction ... 127
6.2 Objectives ... 129
6.3 Justification ... 129
6.4 Methods ... 130
6.4.1 Dog subjects ... 130
v
6.4.3 Evaluation of photographs by specialists ... 130
6.4.4 Evaluation of pictures by general public volunteers ... 131
6.4.5 Building Zooniverse Project: Dogs’ Life Project ... 131
6.4.6 Dogs’ relative telomere length (RTL) ... 132
6.4.7 Data Analysis ... 133
6.5 Results ... 134
6.5.1 Evaluating dogs’ apparent age ... 134
6.5.2 Dogs’ apparent age evaluated by specialists ... 136
6.5.3 Dogs’ apparent age evaluated by Zooniverse volunteers ... 140
6.5.4 Specialists versus Volunteers ... 143
6.5.5 What helped or difficulted assessors correctly predicting a dog’s age 143 6.5.6 Dogs’ apparent age versus Dogs’ relative Telomere Length ... 146
6.6 Discussion ... 159
Chapter 7 Conclusions ... 163
7.1 General discussion ... 163
7.2 Limitations ... 165
7.3 Future research ... 168
vi
List of tables
Table 1 Primers described in literature for relative telomere length estimation
tested in qPCR assay ... 41
Table 2 Albumin Primers Designed for qPCR trial with domestic dogs ... 41
Table 3 Primers used for measuring domestic dogs’ relative Telomere Length in qPCR assay ... 42
Table 4 Representation of master mix preparation for the qPCR reaction (O’Callaghan & Fenech, 2011) ... 44
Table 5 Mean DNA yield and percent Standard Error (SE) for each dog sample collected with swab and dried blood spot ... 45
Table 6 Generalised linear model result for the effects of sex, age, group and cortisol levels on relative telomere length of domestic dogs from two different backgrounds: a kennel and a laboratory 1 ... 60
Table 7 Generalised linear model result for the effect of sex, age and basal cortisol levels on relative telomere length of dogs from a kennel 1 ... 61
Table 8 Generalised linear model result for the effect of sex, age and basal cortisol levels on relative telomere length of dogs from a laboratory 1 ... 62
Table 9 Dogs’ background information categories collected ... 74
Table 10 Police dogs’ working routine information collected ... 74
Table 11 Dog breed groups in the present study according to The Kennel Club (UK) ... 84
Table 13 Dogs group categories based on their backgrounds ... 84
Table 13 Discriminant analysis for dogs' groups ... 87
vii
Table 15 Discriminant analysis for dogs' ages groups using relative telomere
length as the predictor ... 89
Table 16 Relative telomere length by each dog’s age sampled ... 90
Table 18 Final Generalised linear model result for the effects of group category on
relative telomere length of two years old domestic dogs 1 ... 92
Table 19 Final Generalised linear model result for the effects of group category,
sex, food treat, sleep and walk on relative telomere length dogs from different
body sizes 1 ... 94
Table 20 Final Generalised linear model result for the effects group category, sex,
sleep, walk, and animal contact on relative telomere length of domestic dogs 1 .. 96
Table 21 Final Generalised linear model result for the effects group category, sex
and working type on relative telomere length of working dogs 1 ... 103
Table 22 Information from 2017 data collection of dogs from a laboratory setting in
Brazil ... 119
Table 24 Mean percentage score for correct predictions of dogs’ apparent age
assessed from photos by specialists and volunteers ... 135
Table 25 Specialists’ frequency of correct answers for dogs apparent age
prediction by dogs’ true age category (N= 20) ... 136
Table 26 Discriminant analysis for specialists’ correct answers for dogs apparent
age prediction by dogs’ true age category ... 137
Table 27 Dogs that had their ages most accurately estimated (%) from
photographs by dog specialists ... 137
Table 28 Dogs that had their ages least accurately estimated (%) from
viii
Table 29 Final generalised linear model result for the effects of specialist’s
experience (time) with dogs on dog’s apparent age prediction by dog specialists.
... 139
Table 30 Volunteers’ correct frequency of answers for each dogs’ age category (N
= 20) ... 141
Table 31 Discriminant analysis for volunteers’ correct answers for dogs’ age
prediction by dogs’ age categories ... 141
Table 32 Dogs that had their ages most accurately estimated from photographs by
Zooniverse volunteers ... 142
Table 33 Dogs that had their ages least accurately estimated from photographs by
volunteers ... 142
Table 34 Dogs’ age prediction accuracy ... 147
Table 35 Dogs that had their age most accurately predicted from photographs by
specialists and volunteers ... 148
Table 36 Dogs that had their age least accurately predicted from photographs by
ix
List of figures
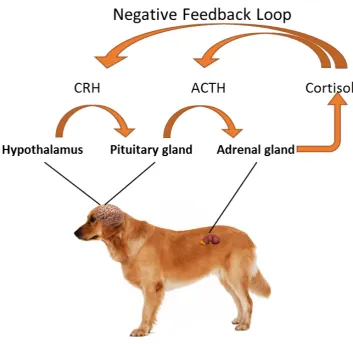
Figure 1: The response of the HPA-axis to a stressor adapted from Protopopova
(2016). ... 23
Figure 2 Telomere structure, D-loop and T-loop regions and Shelterin complex
with its proteins. (Source: Calado & Young, 2008) ... 26
Figure 3 Telomere length comparison. (Source: Armanios & Blackburn (2012). .. 26
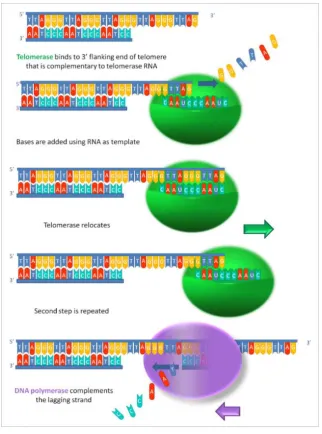
Figure 4 Telomerase repairing telomeric DNA. (Source: Wikiwand, on 20/03/19) 27
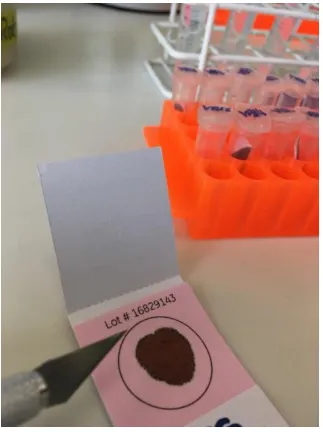
Figure 5 Dried drop of whole blood fixed on an Indicating FTA™ micro card ... 39
Figure 6 a) Swab sampling dog for DNA in a shelter in Brazil b) Swab stored after
dogs’ buccal cell collection kept under room temperature. ... 40
Figure 7 Median DNA concentration (ng/µl) for each collection method. Median:
solid line; Interquartile range: boxes; Minimum and Maximum value: whiskers;... 46
Figure 8. Telomere length (TL) was significantly associated across sample types.
T/S in dry spot blood and dried blood spots (DBS) had a medium strength positive
correlation (r = 0.42, p < 0.05). ... 47
Figure 9 Facilities of laboratory housed domestic dogs (Canis familiaris) ... 55
Figure 10: Facilities of the commercial kennel domestic dogs in Brazil (Canis
familiaris) ... 56
Figure 11 Correlation of basal cortisol levels and relative telomere length of
laboratory dogs. ... 63
Figure 12 Project stand on The Family Pet Show 2017 Manchester, UK where the
dogs were both sampled and photographed ... 76
Figure 13 Pet dogs being sampled during The Family Pet Show 2017 Manchester,
UK using an oral swab to collect buccal cells (i.e. DNA) and pet dogs being
x
Figure 14 Photographs of dog shelter facilities in Brazil ... 77
Figure 15 Photographs of Police Working dogs in the UK and Brazil ... 78
Figure 16 Laboratory facilities and dogs in Brazil ... 79
Figure 17 Examples of rehoming dogs that were sampled ... 80
Figure 18 Behavioural Research dogs – WSC dogs, Austria ... 81
Figure 19 Relative Telomere Length by dog’s age ... 91
Figure 20 relative Telomere Length by group categories of two-year-old dogs .... 93
Figure 22 relative Telomere Length by dogs' categories ... 98
Figure 23 relative Telomere Length by dogs' sex ... 99
Figure 24 relative Telomere Length by dogs' sleeping place ... 100
Figure 25 relative Telomere Length by dogs' walk routine ... 101
Figure 26 relative Telomere Length by dogs' contact with other animals ... 102
Figure 27 relative Telomere Length by police dogs’ origin group ... 105
Figure 28 relative Telomere Length by police dogs’ working type ... 106
Figure 29 relative Telomere Length by police dogs’ sex ... 107
Figure 30 Examples of dogs from the Veterinary School of University of Ouro Preto, Brazil. ... 120
Figure 31 Median of relative Telomere Lengths from laboratory dogs from 2017 and 2018. Median: solid line; Interquartile range: boxes; Minimum and Maximum value: whiskers; Outliers: ● ... 123
Figure 32 relative Telomere Length from female and male laboratory dogs sampled in 2017 and 2018. ... 124
xi
Figure 34 Features helped participants make predictions on a dog’s age from
photographs ... 144
Figure 35 Features that difficulted participants’ predictions on a dog’s age from
photographs ... 145
Figure 36 Dog 1: Senior male, seven years old mainly classified as a senior dog
by assessors. Telomere length was as expected for his age (Dog 1 relative
Telomere Length: 0.75; Expected relative Telomere Length for the age: 0.74). . 149
Figure 37 Dog 2: Senior male, twelve years old mainly classified as a senior dog
by assessors. Telomere length shorter than expected for his age (Dog 2 relative
Telomere Length: 0.57; Expected relative Telomere Length for the age: 0.67). . 149
Figure 38 Dog 3: Senior female, six years old mainly classified as a senior dog by
assessors. Telomere length longer than expected for her age (Dog 3 relative
Telomere Length: 0.82; Expected relative Telomere Length for the age: 0.75). . 150
Figure 39 Dog 4: Senior female, thirteen years old mainly classified as a senior
dog by assessors. Telomere length shorter than expected for her age (Dog 4
relative Telomere Length: 0.65; Expected relative Telomere Length for the age:
0.79). ... 150
Figure 40 Dog 5: Senior male, ten years old mainly classified as a senior dog by
assessors. Telomere length longer than expected for his age (Dog 5 relative
Telomere Length: 0.65; Expected relative Telomere Length for the age: 0.79). . 151
Figure 41 Dog 6: Senior female, nine years old mainly classified as a senior dog
by assessors. Telomere length as expected for her age (Dog 6 relative Telomere
xii
Figure 42 Dog 7: Senior female, seven years old mainly classified as a senior dog
by assessors. Telomere length as expected for her age (Dog 7 relative Telomere
Length: 0.74; Expected relative Telomere Length for the age: 0.74). ... 152
Figure 43 Dog 8: Young female, two years old mainly classified as a young dog by
assessors. Telomere length as expected for her age (Dog 8 relative Telomere
Length: 0.74; Expected relative Telomere Length for the age: 0.74). ... 152
Figure 44 Dog 9: Young female, two years old mainly classified as a young dog by
assessors. Telomere length longer than expected for her age (Dog 9 relative
Telomere Length: 0.85; Expected relative Telomere Length for the age: 0.74). . 153
Figure 45 Dog 10: Senior female, ten years old mainly classified as an adult dog
by assessors. Telomere Length shorter than expected for her age (Dog 10 relative
telomere length: 0.68; Expected relative Telomere Length for the age: 0.74). ... 155
Figure 46 Dog 11: Senior male, twelve years old mainly classified as a young dog
by assessors. Telomere length longer than expected for his age (Dog 10 relative
Telomere Length: 0.75; Expected relative Telomere Length for the age: 0.67). . 155
Figure 47 Dog 12 Senior male, seven years old mainly classified as an adult dog
by assessors. Telomere length longer than expected for his age (Dog 12 relative
Telomere Length: 0.78; Expected relative Telomere Length for the age: 0.74). . 156
Figure 48 Dog 13: Senior male, eight years old mainly classified as an adult dog
by assessors. Telomere length longer than expected for his age (Dog 13 relative
Telomere Length: 0.90; Expected relative Telomere Length for the age: 0.80). . 156
Figure 49 Dog 14: Senior female, six years old mainly classified as a young dog
by assessors. Telomere length longer than expected for her age (Dog 13 relative
xiii
Figure 50 Dog 15: Senior male, seven years old mainly classified as a young dog
by assessors. Telomere length shorter than expected for his age (Dog 14 relative
Telomere Length: 0.67; Expected relative Telomere Length for the age: 0.74). . 157
Figure 51 Dog 15: Young male, two years old mainly classified as an adult dog by
assessors. Telomere length shorter than expected for his age (Dog 15 relative
Telomere Length: 0.70; Expected relative Telomere Length for the age: 0.74). . 158
Figure 52 Dog 16: Young male, two years old mainly classified as a senior dog by
assessors. Telomere length shorter than expected for his age (Dog 16 relative
Telomere Length: 0.64; Expected relative Telomere Length for the age: 0.74). . 158
Figure 53 Dog 18: Young male, two years old mainly classified as an adult dog by
assessors. Telomere length shorter than expected for his age (Dog 16 relative
xiv
Abbreviations
ACTH- Adrenocorticotropic hormone, also adrenocorticotropin or corticotropin
ACTH- Corticotropin-releasing hormone
DNA- Acid deoxyribonucleic
HPA - hypothalamic–pituitary–adrenal axis
PCR- Polymerase chain reaction
POT1- Protection of telomeres protein1
qPCR- Quantitative polymerase chain reaction
RAP1- Repressor/Activator protein 1
rTL – Relative Telomere Length
TIN 2- TRF1 interacting protein 2
TRF- Telomeric restriction fragment
TRF1- Telomeric repeat binding factor 1
xv
Acknowledgements
I would like to thank my supervisor Robert Young for all the encouragement for the
past 9 years of guidance, since my undergrad, through my masters and now with
my PhD he always gave space for my curiosity and creativity in science. He was
the one that showed that I could investigate anything I found interesting; he
al-lowed my passion for animals and my desire to give them a better quality of life
become my research object. Robert taught me be dreamer, to appreciate the
beauty in all beings, he always trusted me, gave me freedom to choose my
ques-tions, my animals, to be stubborn and do things in my own way, for that I will be
always grateful.
I would also like to thank Angélica Vasconcellos not only for the supervision but for
the friendship., in times of doubts, fears and insecurities she was always there for
me. Her politeness, candour, pragmatism and dedication make me have her as
role model.
I am grateful to the program Science without Borders and to the National Council
for Scientific and Technological Development (CNPq) for the financial support of
my studies.
I am profoundly grateful to all the institutions, police units, shelters, laboratory,
re-searcher centre, training centre, kennel owners, that agreed in participating,
trust-ing and allowtrust-ing me to sample their dogs. To Rupert Palme, from University of
Vienna’s School of Veterinary Medicine for performing the glucocorticoid
metabo-lites’ measurements from the faecal samples.
The Family Pet Show organization for helping with every detail to host our project
during the 2017 event and all dog owners that stopped to talk, engage with the
xvi
the mission of photographing non-stop hundreds of dogs and my dear helpers
dur-ing this two-day event: Marina, Ivana, Luiza, Nathan and Lucas without you would
not be possible.
I would like to thank to all dogs that participate on this project, sampling you
al-ways put a smile on my face, writing about you warmed my heart, I remember
your names and many of your particularities, working with you was really a
privi-lege. This thesis is dedicated to the memory of Vivinha, our oldest dog sampled.
Chiara Benvenuto, Kevin Bown, Christopher Meyer, Alan McDevitt and Paul
Kendrick for the advice throughout the development of my PhD. Jean Boubli for
always carrying a warm smile, having a hot cup of coffee and time for a
discus-sion. Ida Jackson for her willingness to help when I felt indeed lost, her patience
for reading my protocols, reference papers and most important for her time to sit
and play detective through the tricky telomere endeavours I will always be grateful
for all your help.
I would like to thank the Little Brazil family: Lu, João, Vinicius, Camilla, Luiza,
Ma-rina, Helder, Isabela, Tarcio, Ivana, Bruno, Ana, Flaviane, Mariane, Naiara, and
Felipe for making Manchester feel like home. To ‘Wives United’ thank you deeply
for sharing laughs and tears, for the yoga classes, statistics help, spiritual debates,
feminist discussions, the gatherings and especially for holding my hand and not
letting it go. To Flaviane, words are not enough, when I lost all hope in the lab you
were there, you gave me all your time and serenity, you taught how to pipette, how
to read results, you bet on me when I was not even betting on me anymore. I will
forever cherish your friendship and the lesson of persistence you taught me. To
post-xvii
ers, for fixing tables, playing video games and above all for believing and
encour-aging me. Meeting you was truly a gift.
All my gratitude to Manchester Kardec group, for being my safe heaven, a place
where I could connect with my faith, principles and meet the dearest people, Tali,
Rosi, Poli, Deia, Helena, André, Tissi and Vinicius thank you for all the support. To
Poli, for your friendship and for teaching me one of the most beautiful lessons. A
special thanks to GFF Damian Studio family for being my therapy, for making me
feel home, for sharing bruises, pain and falls, for keeping smiling upside down. To
Franks team and Lucio Sergio BJJ Lifestyle family, specially André, Becky, Katie,
for always being in the place where I could let problems go and focused on my
breath, my body limits, thank you for your friendship, care and respect to my
jour-ney.
Nat, for being a true friend, always present and ready to listen to me, thank you for
showing that having an ocean between us is not enough to keep our souls
con-nected.
I am thankful to my family, especially Márcio, Hélia, and Rafael, for their trust and
love. I am the result of all the affection, values and knowledge that you invested in
me. Cali and Lord, you taught me the true meaning of love, responsibility and
pa-tience, being away from you was one of my biggest challenges. My family Dutra,
Ladeia and Assunção for all love and support, always cheering and wishing me
the best of luck with my studies.
And finally, I would like to thank Lucas, my partner, who came along on this
jour-ney. Thank you for your understanding, for choosing to leave your life behind to
support me to pursue my dreams. Thank you for being my family, my safe place,
xviii
Abstract
Animal welfare is assumed to be influenced by the cumulative effects of positive and
neg-ative events experienced by an individual. The present study investigated the levels of
cortisol, relative telomere length and the association of these variables with the perception
of canine age (apparent age). Firstly, it was investigated whether dogs’ telomere lengths
from dried blood correlated with the ones measured from oral swabs from the same
indi-viduals. As a correlation between samples from these two tissues were found we
validat-ed the use of buccal swab sampling to obtain dogs’ relative telomere length. We then
in-vestigated whether dogs’ relative telomere length present in buccal cells co-varies with
glucocorticoid levels, results showed association between these factors. Since
glucorti-coids are the most used physiological parameter to assess animal welfare our results
suggest the use of relative telomere length as a potential to evaluate animal welfare. We
investigated if the different backgrounds of dogs were associated with relative telomere
length. Results showed that dogs from different background, sex and with different activity
levels had significantly different relative telomere lengths. We investigated whether dogs’
relative telomere length would vary over a one-year period, and results showed that the
implementation of social enrichment can increase relative telomere length of laboratory
dogs. Finally, we investigated if a novel approach, estimating apparent age, could be
used as a tool to assess welfare. Results showed that a dog’s apparent age assessed
from photographs could, potentially, be used as an animal welfare assessment method
since people were able to identify dogs that were prematurely ageing. In conclusion,
te-lomere attrition and apparent age can be used to indicate a dog’s welfare.
19
Chapter 1
General Introduction
1.1 Animal Welfare Assessment
Humans have surrounded themselves with animals since the Neolithic
revolu-tion, either to stabilize their food resources, for guarding or helping in hunting, the
fact is domestication has played a major role in the formation of human societies
(Driscoll, Macdonald, & O’Brien, 2009) . Because of this close contact with domestic
species, humans started to develop the concept of animal welfare as moral systems
evolved, especially in modern times (Broom, 2011). The confinement of farm
ani-mals was one of the first topics to be instigated in the animal welfare debate
(Hemsworth, Mellor, Cronin, & Tilbrook, 2015a). The notion of animal welfare at this
time came mainly from farmers and veterinary surgeons; it was mostly associated
with the animals’ bodily integrity (i.e. if they were being fed, offered shelter, etc.) and
whether they were producing, as a sign of positive welfare (Hewson, 2003).
The human concepts of moral actions, what is acceptable and what is not,
have significantly changed over time, a better understanding of animals cognition,
motivation and the complexity of social behaviour has resulted in the fast
develop-ment of animal welfare science over the past few decades (Fraser, 2008b).
Scien-tists have proposed different concepts and definitions of animal welfare, which have
resulted in divergent methodologies and ways of understanding experimental data
(Fraser, Weary, Pajor, & Milligan, 1997). The most common definition used is that
the wellbeing of animals is related to how they cope with their environment and it can
be said that the welfare of an animal is undoubtedly affected by both failure to cope
20
Scientists have different perspectives regarding ways to assess animal
wel-fare, some will emphasise health, physiological functioning and absence of diseases,
while others will consider freedom to express natural behaviour, whereas others
consider animals affective states, through positive or negative experiences, such as
fear (Fraser, 2008a). The two main parameters used for welfare evaluation are
be-haviour and physiology, where the first one considers if the animal is allowed to
per-form species natural behaviour, including behaviours such as playing, courtship and
copulation, foraging or if the animal performs abnormal behaviours. The second
pa-rameter investigates the animal’s biological responses underlying attempts to cope,
such as changes in body temperature, heart rate, cortisol (stress hormone) levels
and immunological functioning (Hemsworth, Mellor, Cronin, & Tilbrook, 2015b; Hill &
Broom, 2009; Passantino, Quartarone, Pediliggeri, Rizzo, & Piccione, 2014).
The discussion that once arose from farm animals currently includes the
wel-fare of laboratory animals, shelter animals, working animals and zoo animals
(Bassett & Buchanan-Smith, 2007; Cafazzo et al., 2014; Hart, Zasloff, Bryson, &
Christensen, 2000; Hill & Broom, 2009; Overall & Dyer, 2013). For farm animals the
issue moved from only focusing on better production to also consider the quality of
life animals experience (Broom, 2011). Since the use of animals and the ethics
around it are being intensively discussed, consumers are becoming more interested
about the ethics behind the products they consume and expecting their products to
be produced and processed with better respect for the animal’s welfare (Biesalski et
al., 2003; Broom, 2011; Seeker, Ilska, Psifidi, Wilbourn, Underwood, Fairlie, Holland,
Froy, Salvo-Chirnside, et al., 2018; Waiblinger et al., 2006).
The same public awareness regarding animal welfare is observed for zoo
21
states of animals (Afonso, Berdasco, Medeiros, & Rejowski, 2012; Bassett &
Buchanan-Smith, 2007; Fernandez, Tamborski, Pickens, & Timberlake, 2009; Hill &
Broom, 2009). Pet owners are another segment of the population that are aware and
concerned about their animal’s quality of life and current considerations are a better
diet, exercise and human-pet interaction (Marinelli, Adamelli, Normando, & Bono,
2007; Schneider, Lyons, Tetrick, & Accortt, 2010; Wojciechowska & Hewson, 2005).
Defining animal welfare can be challenging because of its complex nature,
while the impact of some adverse stimuli are easy to detect such as food deprivation,
injury, or poor housing others such as novelty or confinement could be more difficult
to detect and measure (Broom, 1991; Protopopova, 2016). Physiology and
behav-iour are the main approaches used for measuring poor welfare, however, interpreting
their outputs are not always straightforward (Mason & Mendl, 1993). In addition,
pro-cedures to obtain physiological or behavioural samples may offer different levels of
difficulty depending on the size of enclosure or if the animal is extensively on
inten-sively managed, for example (Turner & Dwyer, 2007). Evaluating the absence of
ab-normal behaviour can be time-consuming and requires the knowledge of the species
natural behaviours and physiological measures will require laboratory analysis,
which are not always practical and can be expensive (Cafazzo et al., 2014; Hill &
Broom, 2009; Miller, Pisacane, & Vicino, 2016).
1.2 Evaluation of stress levels as a measure of animal
wel-fare
Too much stress is one of the major problems related to animal welfare and
understanding the mechanisms associated with animal welfare assessment is
im-portant for species’ management since high levels of stress affect the individual’s
22
with environmental challenges and change is highly related to the stress response
(Sheriff, Dantzer, Delehanty, Palme, & Boonstra, 2011). Stress is a term that is
gen-erally used to describe the behavioural or physiological response of an animal to
perceived threats or aversive stimuli (Hill & Broom, 2009). The
hypothalamic-pituitary-adrenal axis (HPA) is responsible for initiating a cascade of hormonal and
behavioural responses to a stressor, which redirects energy to the performance of
survival or "emergency" behaviours (Owen, Swaisgood, Czekala, Steinman, &
Lindburg, 2004). The response to a stressor is characterized by the release of
corti-cotrophin-releasing hormone (CRH) via the hypothalamus. When this hormone
(CRH) binds to its receptors the adrenocorticotropic hormone (ACTH) is released by
pituitary gland. The ACTH binds to receptors on the adrenal cortex and stimulates
adrenal release of glucocorticoids. Cortisol may be released for several hours after
encountering the stressor (Möstl & Palme, 2002a). When a certain cortisol
concen-tration is maintained in the blood it exerts negative feedback to the hypothalamic
re-lease of CRH and the pituitary rere-lease of ACTH (negative feedback) and then the
systemic homeostasis returns when the stressor is moderate and the contact with it
23
Figure 1: The response of the HPA-axis to a stressor adapted from Protopopova (2016).
The behavioural response, which is usually flight or fight is activated in part by
adrenal gland glucocorticoid secretion (Bonne Beerda, Schilder, Van Hooff, De
Vries, & Mol, 1998; Sapolsky, 2000). The steroid hormone secretion facilitates the
mobilisation of glycogen stores that serve as a ready source of energy for the
appro-priate behavioural response (Owen et al., 2004).
When the stimulus is very intense or constant chronic stress is developed,
which leads to elevated levels of HPA axis hormones; that is, glucocorticoids, ACTH
and corticotrophin releasing hormone that may have deleterious effects on the
indi-vidual. These effects includes inhibition of normal reproductive function, suppression
of the immune system, and tissue atrophy, all consequences of the body not being
glucocorti-24
coid levels (or metabolites of this hormone) allows not only the evaluation of animal
welfare, but also to define animals’ management strategies (Teixeira, de Azevedo,
Mendl, Cipreste, & Young, 2007). Stress responses can be triggered by a number of
factors, such as exposure to novelty, lack of predictability or controllability of
im-portant events (Möstl & Palme, 2002a). Glucocorticoid concentration in the blood
gives information about stress levels, however, the sample collection could itself be a
stressor and often it is not feasible to blood sample wild species (Palme & Möstl,
1997). One of the techniques for noninvasively monitoring glucocorticoid levels in
wild animals is the measurement of faecal glucocorticoid metabolites (Palme, 2005).
One of the advantages of this method is that hormone metabolites can be collected
without capturing and disturbing the animal (Hulsman et al., 2011). Currently, this
method is used to investigate questions about hormone-behaviour interactions,
re-production, animal welfare and conservation (Van der Weyde et al., 2016). But the
disadvantage is that it only provides a mean measurement of an animal’s welfare
over the period of the intestinal transit of each species, dogs for example takes 24
hours; that is, it cannot detect acute stressors. Furthermore, a baseline level needs
to be established for each individual since it is the elevated presence of this hormone
that indicates an animal welfare problem and not the mere presence of the hormone
(Touma & Palme, 2005).
Over time elevated levels of cortisol, a glucocorticoid, are potentially harmful
to tissues, and its associated as well with a greater prospect of the development of
cardiovascular disease and suppressed immunity (Sapolsky, 2000). Whereas, basal
25
1.3 Telomeres as biological clocks
Telomeres are structures of non-coding DNA-protein complexes at the ends of
chromosomes and are composed of repeats of a six nucleotide unit sequence
TTAGGG that extend for thousands of bases at chromosome caps (Aydinonat et al.,
2014). Telomeric DNA is associated with a specialized multi protein complex, formed
by six proteins: TRF1 (Telomeric repeat binding factor 1), TRF2 (Telomeric repeat
binding factor 2), RAP1 (Repressor/activator protein 1), TIN2 (TRF1 interacting
pro-tein 2), TTP1 (TRF1‑interacting nuclear protein 1) interacting protein) and POT1
(Protection of telomeres protein 1) (Armanios & Blackburn, 2012). This structure that
is essential to shield the exposed ends of telomeres protecting the chromosome
called she (Shay, 2018). In its structure telomeres have a displacement loop or
D-loop, that is a DNA structure where the two strands of a double-stranded DNA
mole-cule are separated for a stretch and held apart by a third strand of DNA; and it also
has a T-loop, a loop similar to a knot, which stabilizes the telomere, preventing the
telomere ends from being recognized as break points by the DNA repair machinery
(Greider, 1999) (Figure 2). Telomere function is to protect the chromosome DNA
coding regions from recombination, degradation, fusion, damage during cell division,
they are therefore essential for the maintenance of genomic integrity (Gunn et al.,
2008).
Research shows that telomeres play a role in cellular ageing because the
DNA at the very end of the chromosome cannot be fully copied in each cell division,
resulting in a slow, gradual shortening of the chromosome. When eventually reaches
a short length it triggers senescence (Monaghan, Charmantier, Nussey, & Ricklefs,
26
Figure 2 Telomere structure, D-loop and T-loop regions and Shelterin complex with its proteins. (Source: Calado & Young, 2008)
Figure 3 Telomere length comparison. (Source: Armanios & Blackburn (2012).
The replication of telomere-DNA involves telomerase, a specialized enzyme,
which by copying a short template sequence from RNA can synthesize the telomeric
DNA and therefore extend the chromosome’s end (Blackburn, 2005) (Figure 4).
Alt-hough telomeres can be repaired by the enzyme telomerase, this enzyme
abun-dance varies between species, tissues and throughout development (Aydinonat et
al., 2014). In germline cells telomerase provides a mechanism for the maintenance
of telomere length as they proliferate indefinitely (Nasir, Devlin, Mckevitt, Rutteman,
& Argyle, 2001). In somatic tissues, the telomerase is repressed immediately after
[image:28.595.221.372.324.470.2]so-27
matic tissue proliferation, consequently telomeres shorten with age from birth; thus,
the length of the telomeres is a biological clock that effectively counts the cell
[image:29.595.155.478.158.593.2]divi-sions of the organism (Bateson, 2016).
Figure 4 Telomerase repairing telomeric DNA. (Source: Wikiwand, on 20/03/19)
Telomere maintenance in humans is influenced by several factors such as
psychological stress, diet, exercises and behavioural habits such smoking (Arsenis,
You, Ogawa, Tinsley, & Zuo, 2015; Mirabello et al., 2009). Stressful events usually
have a severe negative impact on telomere length (i.e. accelerate reduction)
28
may delay, prevent or possibly reverse the effect of telomere attrition (Bateson,
2016). This is evidence that telomere length is an indicator for either positive or
neg-ative stimuli (welfare state).
Studies show that depression, posttraumatic stress disorder, being a refugee
(i.e. displaced from their ancestral home), being exposed to pain, childhood traumas,
financial stress, women suffering from intimate partner violence, are negative
situa-tions that exposure individuals to stress hormones, which are associated with the
down-regulation of telomerase activity, the main enzyme responsible for the
mainte-nance of telomeres (Cai et al., 2015; Choi, Fauce, & Effros, 2008; Küffer,
O’Donovan, Burri, & Maercker, 2016; Zahran et al., 2015). Whereas having 33
minutes of vigorously physical activity training per week, a healthy diet, including
greater intake of antioxidant, less processed meat consumption, intake of fruits and
vegetables and less dietary fat, meditation training in a retreat setting are all
associ-ated with the reduction of cortisol and/or inflammation levels and as a result
telomer-ase activity augmentation (Boccardi et al., 2013; Conklin et al., 2018; Puterman et
al., 2010).
Since telomere conservation can be influenced by numerous factors rather
than trying to determine the specificity of its maintenence it can be more valuable if
contemplated as reflecting ageing (Blackburn, 2010). Ageing reduces the structural
integrity and functional performance of tissue over time, the measurements of these
changes are representative of the biological age of the tissues (Gunn et al., 2008).
Once the measurement of biological age has been precisely established, it can be
used to investigate the influence of environmental and genetic factors on telomere
shortening and, therefore, it can be used to study the aetiology of ageing (Gunn et
integra-29
tive indicator of health, as standard hemograms are used currently (Blackburn,
2010).
1.4 Apparent age as a measure of life experience
The speed of ageing varies between individuals in the same way that we grow
at different rates. Since the 1980s the concept of age has been investigated and
de-bated resulting in concepts such as: biological age – the age related to the body’s
physiology and cells; chronological age – refereeing to the actual amount of time that
an individual has been alive (Borkan & Norris, 1980). In humans, ‘apparent age’ -
usually the estimated chronological age of an individual - is a validated parameter for
assessing patient health because it is associated with the patient's physiological
state (Christensen et al., 2004).
The evaluation of apparent age, in humans, typically takes into consideration
physical changes that happen with ageing progression, for example, alterations in
facial skin such as presence wrinkles, sagginess, pigmentation alterations such as
freckles and age spots (Porcheron, Mauger, & Russell, 2013). For assessing
appar-ent age several studies use digital photographs (passport-type) where images were
cropped at the neck up to the top of the head, and the subjects presented a neutral
expression (Christensen et al., 2004; Gunn et al., 2013, 2009).
It has been found that individuals who look older than their chronological age
had more health problems related to their apparent age than to their chronological
age (Borkan & Norris, 1980; Gunn et al., 2008). A study highlighted that “looking
old-er for your age” when identical twins wold-ere compared between each othold-er was
asso-ciated with increased mortality in a group of 387 twin pairs (Christensen et al., 2004).
lon-30
gevity and cardiovascular diseases in a group of 670 individuals (Gunn et al., 2013).
Therefore apparent age is a feature recommended to be used by medical doctors
because in general it relates to an individual’s health and for individuals older than
70 years old it predicts survival and associates with physiological and functional
age-ing (Christensen et al., 2009).
Human gerontology, the scientific study of the process of ageing, is a growing
field of investigation, despite this the use of apparent age as a health indicator is not
widely investigated yet. For non-human species studies are even more sparse, one
study investigated the association between personality and health in facial
appear-ance of chimpanzees (Pan troglodytes) and revealed that evaluators could infer
about the apes’ health status from photographs (Kramer, 2012). No similar study has
been conducted for dogs, however, ageing studies already point out some important
features related to dogs appearance that can be used when assessing dogs ageing
health such as texture of skin, hyperpigmentation alopecia, cataracts, and greying
hair (Bellows et al., 2015; King, Smith, Grandin, & Borchelt, 2016).
Several studies have associated chronic stress and apparent age where high
levels of cortisol are associated with a higher perceived age, for example, people
under financial stress tend to look six years older than their chronological age
(Agrigoroaei, Lee-Attardo, & Lachman, 2017; Noordam et al., 2012). A study
investi-gated the association between apparent age and leucocyte telomere length finding a
significant correlation between the age assessed from photographs and the
promis-ing molecular biomarker of agepromis-ing (Christensen et al., 2009). No studies have been
conducted with non-human mammals that associate chronic stress, perceived age
31
1.5 Canids as a model group
Canids were chosen to be our model group for the present study for the
fol-lowing reasons: 1) the domestic dog (Canis familiaris) is a species that is much
stud-ied and for this reason abundant data is available; 2) it is also a species with great
availability of individuals, which is not true for wild species; 3) canids are good
mod-els for carnivores in general; and 4) domestic dogs are easy to sample from as most
have obedience training. Furthermore, once this new assessment method has been
validated, other species of carnivores in captivity may benefit from it.
For a number of reasons, the domestic dog is an interesting model to
investi-gate different issues concerning animal welfare, evolution and cognition (Cooper et
al., 2003; Rehn & Keeling, 2011; Trut, Plyusnina, & Oskina, 2004). Studies with dogs
are carried out to understand wolves’ domestication, to understand the
communica-tion between dogs and owners, and to understand cognicommunica-tion and learning (Boyko et
al., 2009; Kaulfuß & Mills, 2008; Thorpe et al., 2006). Besides being companion
ani-mals, dogs are also used for work, such as patrol dogs, sniffer dogs, search and
as-sistance dogs (Horváth, Igyártó, Magyar, & Miklósi, 2007; Jalongo, Astorino, &
Bomboy, 2004). Currently, dog welfare issues are widely discussed because they
reflect the growth of the pet market (Boya, Dotson, & Hyatt, 2012; Downes, Canty, &
More, 2009). Therefore, results of studies with dogs, besides having animal welfare
and scientific relevance will be of economic interest.
Dogs are housed under many different management routines: pets, police,
shelters, laboratories, strays, etc which also makes them a good model (Downes et
al., 2009; Hart et al., 2000; Luescher & Tyson Medlock, 2009). This is because
these different uses of dogs allow us to study the impact of lifestyle on their aging
32
1.6 Thesis structure
In the following chapters we employed a multidisciplinary approach to
investi-gate the dynamics of dog ageing. The research was developed in three main
themes: first the methodological validation of the use of relative telomere lengths for
dog welfare assessments and the examination of possible association between
dogs’ faecal glucocorticoids metabolites and dog’s relative telomere length (Chapters
2 and 3); second, the investigation of dogs’ relative telomere length and the
dynam-ics of dog telomere length over a year (Chapters 4 and 5); and, lastly, the perception
of a dog’s apparent age from photographs evaluated by specialists and volunteers
(Chapter 6).
The current research was approved by the University of Salford Science and
Technology Ethics Panel (ethics application STR1617-22). The decision to sample
using a non-invasive method led us to the validation of buccal swab use to collect
DNA from buccal cells for telomere analysis, instead of the standard sampling
meth-od: blood sampling (Chapter 2). One of the most frequently used method for animal
welfare assessment is the measurement of faecal glucocorticoids metabolites
(Schwarzenberger, 2007). Therefore, we examined if there was any association
be-tween dogs’ faecal glucocorticoids metabolites and dogs’ relative telomere length to
determine if relative telomere length could be used to give information regarding
stress (Chapter 3). After these methodological validations we proceeded to sample
dogs with buccal swabs to investigate the association of relative telomere length with
dogs’ age, sex, breed and background (Chapter 4). Then we selected laboratory
dogs to be sampled twice a year apart to investigate how relative telomere length
varies overtime in response to a social enrichment intervention (Chapter 5). In the
33
the possibility of using apparent age to assess a dog’s quality of life. Dog
photo-graphs were assessed by specialists and volunteers and their predictions associated
significantly with relative telomere length (Chapter 6).
Within these topics we discuss the complexity of relative telomere length, its
potential to be implemented in animal welfare assessment, the positive impact of
an-imal enrichment on telomere length and the use of a novel approach to assessing
animal welfare: apparent age evaluations. The aim of this research is to improve the
welfare of dogs in shelters, police canine units, laboratories and pets by developing
34
Chapter 2
Validating the use of oral swabs for
te-lomere length assessment in dogs
2.1 Introduction
Telomeres are defined as regions of DNA–protein complexes located at the
ends of linear eukaryotic chromosomes whose function is to protect the DNA’s
integ-rity during cell division (Epel et al., 2004). In general, the telomere complex
compris-es double-stranded non-coding DNA sequenccompris-es, usually consisting of tandem
re-peats of the nucleotides TTAGGG (Pat Monaghan & Haussmann, 2006). During cell
division the telomere is not fully replicated, resulting in telomere shortening with
eve-ry replication. Eventually it will reach a minimum length preventing any further cell
division and therefore its protective function will trigger cell senescence (Nasir et al.,
2001). Telomere length reduction is natural and a consequence of cellular division,
aging, senescence and for this reason is used as a biological clock (Bateson, 2016).
Studies have shown that fast telomere shortening (attrition), and short telomeres are
related to cellular damage, making telomere lengths (TL) a valuable indicator of
cel-lular aging and physiological stress (Aydinonat et al., 2014). Therefore, shorter
telo-mere lengths are associated with chronic stress and diseases of old age, TL is of
great interest in welfare assessment and healthy ageing studies (Woody, Hamilton,
Livitz, Figueroa, & Zoccola, 2017).
TL may be assessed by a wide range of methods such as the Southern blot
that measure Telomere Restriction Fragments (TRF), Flow-FISH cytometry and
quantitative PCR (qPCR), which measures relative Telomere Length (rTL) (Cawthon,
es-35
timates the average telomere length in kilobases, whereas Flow-FISH method
re-sults are expressed as mean fluorescence intensity and the average telomere length
are translated into kilobase estimates. (Gutierrez-Rodrigues, Santana-Lemos,
Scheucher, Alves-Paiva, & Calado, 2014; Mckevitt, Nasir, Devlin, & Argyle, 2018).
The measurement of telomere length using qPCR is determined by the average of
telomere sequences content (nucleotides) in a sample using the ratio of telomere
re-peat copy number from a DNA sample to control gene (T/S ratio) (Cawthon, 2002).
This technique has advantages over the others when it comes to cost, simplicity and
amount of DNA needed for the analysis (Abechuco, Soto, Pardo, Haussman, & Diez,
2013).
Relative telomere length (rTL) can be measured in any cell population from
proliferating tissues with high quality undamaged DNA; in humans, rTL is extensively
measured in leukocytes from whole blood, but it can also be measured from buccal,
liver, kidney, heart, spleen, brain, skin, triceps (muscle), tongue, intercostal skeletal
muscle, subcutaneous fat, and abdominal fat cells (Dlouha, Maluskova, Lesna,
Lanska, & Hubacek, 2014).
Recent research links environmental factors such as psychological and
physi-ological stress, heart diseases, obesity and smoking to premature telomere
shorten-ing and accelerated human agshorten-ing (Arsenis et al., 2015; Ash, Smith, Knight, &
Buchanan-Smith, 2018; Hadchouel et al., 2015; O’Callaghan & Fenech, 2011;
Zahran et al., 2015) . Recent studies show that poor animal welfare related to ‘bad
stress’ (i.e. distress) is also associated with shorter telomeres in numerous
36
Animal welfare is of global concern, not only from an ethical point of view but
because it has significant negative financial impacts on the economies of animal
in-dustries (Mason & Latham, 2004). Animal welfare assessment usually considers
general health and display of typical behaviours as welfare parameters, which can
be measured through observations and physiological examinations, this can be
time-consuming and expensive. (Broom, 2008). Traditionally, health checks were
con-ducted using blood samples, however, capturing, containing and handling the animal
during sample collection may stress the animal (Palme, 2012).
The length of telomere is traditionally assessed from blood samples, however,
obtaining blood for research purposes would require a scientific licence, is costly,
in-vasive to the animal, requires trained veterinarians, laboratory expertise and
infra-structure for sample processing and storage (Thomson, Brown, & Clague, 1992).
Studies have shown advantages of collecting saliva and buccal cells through swabs
as they are more cost effective, stable at room temperature, collection does not
re-quire expertise and is less invasive, especially with trained animals (Feigelson et al.,
2001). Despite the use of buccal swab cells and toe nails as a source of
non-invasive DNA samples, there is no study describing the use buccal swabs for
as-sessing rTL in any non-human species (Oberbauer et al., 2003).
Ensuring an animal’s well-being in scientific studies involves choosing
meth-odologies, which cause none or minimal distress to the subject. The development of
more non-invasive methodologies is paramount for the animal welfare evaluation of
pets, shelter, laboratory and captive animals. It is imperative that we have sampling
collec-37
tion and a continuous monitoring of subjects’ well-being. As the association of the
relative telomere length from different body cells were already established we predict
that the same association will occur with dog samples from different tissues. Thus,
the present study addresses gaps in the scientific literature by measuring and
com-paring rTL from samples collected from two different tissues of healthy domestic
dogs (Canis familiaris).
2.2 Objective
Investigate whether dogs’ telomere lengths vary between samples collected
from dried blood and from oral swab.
2.3 Justification
Presently, protocols for analysis of telomeres are typically performed with
blood samples (Cai et al., 2015; Cawthon, 2002; Fick et al., 2012; Goyns, 2002). The
intent of this research is to validate buccal cell swab sampling as a non-invasive and
effective method for assessing telomere length in dogs. The initial intention was to
only use oral swab sampling during data collection, but blood samples were
necsary for validating the novel sampling approach, therefore a collaboration was
es-tablished with a veterinary clinic for obtaining dogs’ blood samples (Vetmaster,
Vet-erinary Clinic, Belo Horizonte, MG, Brazil) (Stout et al., 2017).
The blood samples were not collected exclusively for our study, they were
col-lected in routine veterinary exams requested by the owners, and all efforts were
38
clarified about the project’s objectives and received a project invitation letter, an
in-formation sheet and a consent form (Appendices 1, 2 and 3).
2.4 Methods
2.4.1 Ethical statement:
The data for this project were collected under ethical approval number:
STR1617-22 conceded by The University of Salford Ethic Committee (Appendix 4).
All biological material collected for this study was authorised under license number:
ITIMP16.1096 (Appendix 5).
2.4.2 Samples
Samples were obtained from 25 dogs, 17 females and 8 males, ranging from
1 to 13 years old.
2.4.2.1 Dried whole blood spot collection
Sub-samples of venous blood that were collected during routine veterinary
exams requested by the owners were donated for the research. Veterinarians also
collected an oral swab from the same individual, at the same time, to allow a
com-parison between TL from blood samples and from oral swabs.
A drop of venous blood collected from each individual was fixed in an
Indicat-ing FTA™ micro card (GE Whatman, Maidstone, Kent, United KIndicat-ingdom), air dried,
stored in sealed plastic bags and kept at room temperature until further processing.
39
Figure 5 Dried drop of whole blood fixed on an Indicating FTA™ micro card
2.4.2.2 Swab collection:
The swab was placed against the inside surface of the canid’s cheek. Saliva
and tissue were collected by rolling the Isohelix Buccal Swab (Cell Projects, Kent,
UK) firmly against the cheek (Chang et al., 2007). A Dri-Capsule (Cell Projects, Kent,
UK) was added to each swab tube to allow the sample to be stored at room
40
Figure 6 a) Swab sampling dog for DNA in a shelter in Brazil b) Swab stored after dogs’ buccal cell collection kept under room temperature.
2.4.3 DNA extraction
The DNA extraction from the blood and swab samples was performed using
DNeasy® Blood & Tissue Kit (Qiagen) following the manufacturers’ protocol with a
few adjustments (Appendix 6).
2.4.4 DNA quantification
Concentration of DNA extracted from dried whole blood spot and swab
sam-ples was determined using the NanoDrop® ND-1000 UV-Vis Spectrophotometer
(Thermo Fisher Scientific). Then all samples were diluted to a working stock
concen-tration of 50 ng/µL in PCR-grade water and single-use aliquots were kept frozen at –
41
2.4.5 Primer validation
For the relative telomere length measurement, we tested primers described in
literature (Table 1).
Table 1 Primers described in literature for relative telomere length estimation tested in qPCR assay
Primers trials
Primers Target gene Reference
Tel1, Tel2 Telomere Cawthon, 2002 Telb1, Telb2 Telomere Giradeaudeu, 2016 Telc, Telg Telomere Cawthon, 2009
36B4F, 36B4R 36B4 Cawthon, 2002
36B4mF, 36B4mR 36B4 Buddhachat, 2017
Albu, Albd Albumin Cawthon,2009
18SF, 18SR 18S Giradeaudeu, 2016
We took into consideration Richard Cawthon’s (personal communication, 21
of February 2018) advice to work with albumin as the gene reference for the relative
telomere measurement because albumin have been used previously for measuring
telomere from human samples (Cawthon, 2009). Since there were few mismatches
from the human primer compared to dog, three primers were design specifically for
canine albumin. Primers had similar thermodynamic properties, so they would be
able to be used in the same PCR cycling conditions (Table 2).
Table 2 Albumin Primers Designed for qPCR trial with domestic dogs
Albumin Primers Design
Primers Sequence Size
Alb1_F AGACATCCGTACTTCTACGCCC 22
Alb1_R GCAGCACTCCGCAAAGACTC 20
Alb2_F TGAGCCAGCGATTTCCCAAAG 21
Alb2_R TGGCAGCATTCCTTGTGGAC 20
42
After testing more than seven primer sequences for telomere and reference
gene, the ones that showed the best performance for dog swab samples for
telo-mere gene were Telg and Telc from Cawthon (2009) and for the reference gene 18S
were 18S-F and 18S-R from Giraudeau and colaborators (2016). As multicopy genes
were already used in literature for measuring relative telomere length and showed
the same consistence as a single copy gene, the 18S was used the reference gene
and primers were used at the same concentration (800nm) (Table 3) (Wang et al.,
2013). The performance of each primer on each reaction was calculated by the
Ro-tor-Gene Q Series v.2.3.1 software and were between 98% and 100% efficient.
Table 3 Primers used for measuring domestic dogs’ relative Telomere Length in qPCR assay
Primer Primer sequence Target gene Reference
telg 5’-ACACTAAGGTTTGGGTTTGGGTTTGGGTTTGGGTTAGTGT-3’ Telomere (Cawthon, 2009)
telc 5’-TGTTAGGTATCCCTATCCCTATCCCTATCCCTATCCCTAACA-3’ Telomere (Cawthon, 2009)
18S F 5’-GAGGTGAAATTCTTGGACCGG-3’ 18S (Plot et al., 2012)
18S R 5’-CGAACCTCCGACTTTCGTTCT-3’ 18S (Plot et al., 2012)
2.4.6 qPCR assay
A pool from the 25 swab samples (conc. 107.2 ng/µl) and one for the dried
whole blood spot (conc. 190.9 ng/µl) was produced. Each qPCR batch (i.e. run)
con-sisted of two components: i) a tenfold point serial dilution prepared from pool of DNA
from the swab pool or from the dried whole blood spot, which was used to construct
the standard curve and formed the basis of each primer optimization and quality
contami-43
nation and/or primer dimer formation. This was done for the telomere gene and the
reference copy gene. Each step of the dilution series and the NTC were run in
tripli-cate in each batch (Olsen, Bérubé, Robbins, & Palsbøll, 2012).
Primers were designed according to literature, telomere primers telg,
(5’-ACACTAAGGTTTGGGTTTGGGTTTGGGTTTGGGTTAGTGT-3’), telc,
(5’-TGTTAGGTATCCCTATCCCTATCCCTATCCCTATCCCTAACA-3’) from (Cawthon,
(2009); and 18S primers, 18S sense (5’-GAGGTGAAATTCTTGGACCGG-3’), 18S
antisense (5’-CGAACCTCCGACTTTCGTTCT-3’) for the reference gene from Plot,
Criscuolo, Zahn, & Georges (2012). Quantitative PCR reactions were performed
us-ing monochrome multiplex assay adapted from Olsen, Bérubé, Robbins, & Palsbøll,
(2012). Master mix reactions were prepared following O’Callaghan & Fenech (2011)
master mix protocol (Table 4). Amplifications were performed in a Rotor - Gene ® Q
cycler (QIAGEN) with the Rotor-Gene Q Software ver. 2.3.1 using the
manufactur-er’s 0.1 ml strip tubes and caps. Conditions were 95°C for 15 min, 2 cycles of 94°C
for 15 s and 49°C for 15 s, 40 cycles of 94°C for 15 s, 62°C for 10 s, 74°C for 15 s
with signal acquisition, 84°C for 10 s, 88°C for 15 s with signal acquisition, and
con-cluded with a melting curve ramping from 72°C to 95°C, rising by 0.5°C in steps of
30 s (Olsen et al., 2012). Each run had a standard curve calculated by the
Rotor-Gene Q Series v.2.3.1 software and the dilution factors of the standards
44
Table 4 Representation of master mix preparation for the qPCR reaction (O’Callaghan & Fenech,
2011)
Master mix preparation for relative telomere length assay
Reagents Volumes for one sample (µl) Final concentration
Power SYBR Green master mix (2x) 10 1x
Primer (telomere-fwd (2 μM)) 1 0.1 μM
Primer telomere-rev (2 μM) 1 0.1 μM
H20 4 -
DNA (5 ng/μl DNA) 4 20 ng total
2.4.7 Measuring relative telomere length (RTL)
The measurement of the relative telomere length was calculated by using an
adaptation of the qPCR method described by Cawthon (2002), using a multi-copy
gene instead of a single copy gene as the reference gene as validated previously by
Wang et al. (2013). The calculation consisted in the ratio of telomere repeat copy
number (T) to reference gene copy number (S). As each experimental sample was
assayed in duplicate, two T/S results were obtained for each sample, if the
dupli-cates values differed from each other we did a second assay for the sample; the final
reported result for each sample in a given run was the average from each duplicate
(Cawthon, 2002).
2.4.8 Statistical Analysis
We tested the normality of T/S ratios from each sample using
Kolmogorov-Smirnov tests, differences between the T/S ratio means from blood and swab
sam-ples with paired t-test and conducted Pearson correlations to assess the
concord-ance of T/S ratios across samples from dried whole blood spot and saliva. All
45
2.5 Results
2.5.1 DNA quantity and quality
Results are summarized in Table 5. Dried Blood Spot DNA yield had a mean
DNA concentration of 196.82 ng/µl [range: 23.1 - 397.3 ng/µl] and was greater than
swab DNA yield with 115.37 ng/µl mean DNA concentration [range: 18.40 – 240
ng/µl]. All samples were successful in providing adequate DNA quantities, despite
this Dried Blood Spot had two samples with low concentration quantified (Figure 7).
Table 5 Mean DNA yield and percent Standard Error (SE) for each dog sample collected with swab and dried blood spot
Sample type Mean DNA
yield (ng/µl)
Range
(ng/µl)
Mean SE
(%)
N
Swab 115.37 18.4 – 240.0 10.92 25
Dried blood
spot
46
Figure 7 Median DNA concentration (ng/µl) for each collection method. Median: solid line; Interquartile range: boxes; Minimum and Maximum value: whiskers;
2.5.2 Swab and Dried Blood Spot rTL were significantly correlated
Relative telomere length data were normally distributed (assessed using
Kol-mogorov-Smirnov tests). The associations between in rTL dried whole blood spot
and saliva can be seen in Figure 8. Swab T/S and dried whole blood T/S were