a s s o ci a t e d wi t h in c r e a s e d
fil a m e n t o u s f u n g a l b u r d e n in
a ll e r gi c f u n g a l d i s e a s e
F r a c z e k , MG, C hi s hi m b a , L, N iv e n , R M, B r o ml ey, M , Si m p s o n , A,
S m y t h , LJC, D e n n i n g , DW a n d Bo wy er, P
h t t p :// dx. d oi.o r g / 1 0 . 1 0 1 6 /j.j a ci. 2 0 1 7 . 0 9 . 0 3 9
T i t l e
C o r ti c o s t e r oi d t r e a t m e n t is a s s o ci a t e d wi t h in c r e a s e d
fil a m e n t o u s fu n g al b u r d e n i n a ll e r g i c f u n g al d i s e a s e
A u t h o r s
F r a c z e k , MG, C hi s hi m b a , L, N iv e n , R M, B r o ml ey, M ,
Si m p s o n , A, S m y t h , LJC, D e n n i n g , DW a n d Bo wy er, P
Typ e
Ar ticl e
U RL
T hi s v e r si o n is a v ail a bl e a t :
h t t p :// u sir. s alfo r d . a c . u k /i d/ e p ri n t/ 4 4 4 7 3 /
P u b l i s h e d D a t e
2 0 1 7
U S IR is a d i gi t al c oll e c ti o n of t h e r e s e a r c h o u t p u t of t h e U n iv e r si ty of S alfo r d .
W h e r e c o p y ri g h t p e r m i t s , f ull t e x t m a t e r i al h el d i n t h e r e p o si t o r y is m a d e
f r e ely a v ail a bl e o nli n e a n d c a n b e r e a d , d o w nl o a d e d a n d c o pi e d fo r n o
n-c o m m e r n-ci al p r iv a t e s t u d y o r r e s e a r n-c h p u r p o s e s . Pl e a s e n-c h e n-c k t h e m a n u s n-c ri p t
fo r a n y f u r t h e r c o p y ri g h t r e s t r i c ti o n s .
Corticosteroid treatment is associated with increased filamentous fungal burden in allergic fungal disease
Marcin G. Fraczek, PhD, Livingstone Chishimba, PhD, Rob M. Niven, MD, Mike Bromley, PhD, Angela Simpson, MD, PhD, Lucy Smyth, PhD, David W. Denning, FRCP, Paul Bowyer, PhD
PII: S0091-6749(17)31732-3
DOI: 10.1016/j.jaci.2017.09.039
Reference: YMAI 13095
To appear in: Journal of Allergy and Clinical Immunology
Received Date: 13 April 2017 Revised Date: 6 September 2017 Accepted Date: 21 September 2017
Please cite this article as: Fraczek MG, Chishimba L, Niven RM, Bromley M, Simpson A, Smyth L, Denning DW, Bowyer P, Corticosteroid treatment is associated with increased filamentous fungal burden in allergic fungal disease, Journal of Allergy and Clinical Immunology (2017), doi: 10.1016/ j.jaci.2017.09.039.
M
AN
US
CR
IP
T
AC
CE
PT
ED
1 Corticosteroid treatment is associated with increased filamentous fungal burden in
allergic fungal disease
Marcin G. Fraczek PhD1,2,5, Livingstone Chishimba PhD2,6, Rob M. Niven MD2, Mike Bromley PhD1, Angela Simpson MD, PhD2, Lucy SmythPhD3, David W. Denning FRCP1,2,4 and Paul Bowyer PhD1,2
1
University of Manchester, Faculty of Biology, Medicine and Health, Manchester Fungal Infection Group, Institute of Inflammation and Repair, Core Technology Facility,
Manchester, UK
2
University of Manchester, Manchester Academic Health Science Centre, University Hospital of South Manchester (UHSM), Manchester, UK
3University of Salford, School of Environment and Life Sciences, Salford, UK 4
National Aspergillosis Centre, University Hospital of South Manchester (UHSM), Manchester, UK
5
University of Manchester, Faculty of, Biology, Medicine and Health, Manchester Institute of Biotechnology, Princess Street, Manchester, UK
6
Current address: Cardiff and Vale University Hospitals Health Board, Cardiff, UK
Corresponding author: Paul Bowyer, The University of Manchester, Manchester Fungal Infection Group, Institute of Inflammation and Repair, Core Technology Facility, Manchester, UK. Phone: +44(0)1612751214 E-mail: paul.bowyer@manchester.ac.uk
Sources of Support: MB and PB receive support from MRC grant MR/M02010X/1. MF, MB and PB were funded by EU Framework 7 (FP7-2007-2013) under grant agreement. HEALTH-F2-2010-260338 ''ALLFUN.''
M
AN
US
CR
IP
T
AC
CE
PT
ED
2 ABSTRACT
Background
Allergic diseases caused by fungi are common. The best understood conditions are allergic bronchopulmonaryaspergillosis (ABPA) and severe asthma with fungal sensitisation (SAFS). Our knowledge of the fungal microbiome (mycobiome) is limited to a few studies involving healthy individuals, asthmatics and smokers. No study has yet examined the mycobiome in fungal lung disease.
Objectives
The main aim of this study was to determine the mycobiome in lungs of individuals with well characterised fungal disease. A secondary objective was to determine possible effects of treatment on the mycobiome.
Methods
After bronchoscopy, ITS1 DNA was amplified and sequenced and fungal load determined by RT-PCR. Clinical and treatment variables were correlated with the main species identified. ABPA (n=16), SAFS (n=16), severe asthma not sensitised to fungi, (n=9), mild asthma patients(n=7) and 10 healthy controls were studied.
Results
The mycobiome was highly varied with severe asthmatics carrying higher loads of fungus. Healthy individuals had low fungal loads, mostly poorly characterised Malasezziales.The most common fungus in asthmatics was Aspergillus fumigatus complex and this taxon accounted for the increased burden of fungus in the high level samples. Corticosteroid treatment was significantly associated with increased fungal load (p<0.01).
Conclusions
M
AN
US
CR
IP
T
AC
CE
PT
ED
3 Capsule summary: This article reports the first analysis of fungal communities in lungs of individuals with fungal disease. Effects of steroid and antifungal drugs suggest complex patterns of fungal burden with potential implications for treatment.
Key words: Lung mycobiome, Aspergillus, steroid, antifungal, ABPA, asthma.
Abbreviations:
ITS: Ribosomal internal transcribed spacer region
RT-PCR: real time PCR
qPCR: quantitative PCR
CF: cystic fibrosis
BTS: British Thoracic Society
CTAB: cetyltriammonium bromide
ICS: inhaled corticosteroid
M
AN
US
CR
IP
T
AC
CE
PT
ED
4 INTRODUCTIONFungal diseases are a serious health problem worldwide (1). A common form of fungal disease is caused by allergic reactions to fungi that complicates existing respiratory pathology. Severe asthma is frequently linked with fungal sensitisation (2). Recognised asthma endotypes include allergic bronchopulmonary mycosis (ABPM) (3), which includes allergic bronchopulmonaryaspergillosis (ABPA) (4). A recently proposed phenotype of severe asthma is severe asthma with fungal sensitisation (SAFS) (5). All are serious airway diseases whose pathogenesis is only partially understood. ABPA affects between 2 and 5% of adult asthmatics and SAFS may account for 40% of severe asthmatics so the healthcare and economic impact of fungal allergy is significant. It is currently assumed that ABPA and SAFS are directly linked to fungal colonisation of airways and made worse by increased fungal burden, however existing culture based tests are inadequate to determine level and composition of fungal communities in the lungs of affected individuals (6,7).
Most of the microbiome studies performed to date have focused on gastro-intestinal tract, oral, skin and vaginal bacterial microenvironment (3, 15, 16). The data available on the lung mycobiome (reviewed in (8))is limited to samples from individuals that did not have well characterised fungal disease.
Commonly reported fungal respiratory infections in immunocompromised patients are caused by fungi such as Aspergillus spp., Candida spp., Mucorales or Cryptococcus spp.(1). Endemic pathogens such as Histoplasma spp., Coccidioides spp. and Blastomyces spp. may also cause diseases in otherwise healthy individuals (9). Aspergillusfumigatuscauses life-threatening invasive aspergillosis, chronic pulmonary aspergillosis, Aspergillus-associated asthma and allergic diseases such as ABPA and SAFS (1,10–12). ABPA is characterised by exaggerated Th2 CD4+ allergic inflammatory response to A. fumigatus allergens (13), including proteases (14) in the bronchial airway of atopic asthma and CF patients. Other fungi are implicated in SAFS and allergic bronchopulmonary mycosis (3,15). However, there are limited data describing the range of fungal species that are present, their relative and absolute abundances, and how antimicrobial or corticosteroid therapies impact these microbial communities. Corticosteroid treatment is a known risk factor for development of invasive aspergillosis(16–18) but is also a common treatment to alleviate symptoms of asthma (19).
M
AN
US
CR
IP
T
AC
CE
PT
ED
5 METHODS
Sample collection and processing.
Patients were identified using the exclusion and inclusion criteria defined in suppl. methods. Briefly, 64 individuals were identified with 58 agreeing to bronchoscopy (Table 1 and suppl. table 1). Bronchoalveolar lavage (BAL) samples were collected using local guidelines and BTS standard procedures (34). After bronchoscopy all collected samples were immediately placed on ice and transferred to the laboratory for processing. The BAL was subjected to immediate DNA extraction, then PCR and Illumina sequencing as described below. Dilution of endogenous lung fluids in the lavage medium was estimated as described (35) using a Sigma urea assay kit (Sigma – Aldrich, UK).
DNA extraction, PCR and Illumina sequencing.
BAL samples were processed immediately after they were obtained, without storage then DNA extraction was carried out immediately using a CTAB method previously described (36). Controls consisted of sterile water or known dilution series of A. fumigatus or C. albicans
DNA substituted for BAL and also added to BAL before the initial sample prep then carried through each step in the procedure before sequencing. Where appropriate reads associated with potential reagent contaminant fungi were excluded from subsequent analysis.
Statistics.
Unless otherwise stated statistical analysis was performed within QIIME v1.8 using appropriate QIIME workflows (37-39). Beta diversity for fungal taxa was calculated using Bray - Curtis metrics. Confounding variables were selected a priori and included age, weight, sex, corticosteroid treatment, antifungal treatment, azithromycin treatment and disease. Groups were stratified and differences in effects compared to assess potential confounding. Minimum group size after stratification was 3. Alpha diversity metrics were calculated for fungi using an Excel spreadsheet. Numbers of fungal otus and diversity statistics are shown in supplementary table 2. Pairwise comparison of specific species within datasets was assessed using T–test or Mann Whitney in cases where deviation from normal distribution was observed. Statistics were adjusted for multiple sampling using Benjamini-Hochberg correction as appropriate. Dunn’s comparison test and logistical regression was used to identify potential confounding factors in comparison of multiple groups as appropriate.
Analysis of mycobiome.
Fungal ITS1 sequences were compared with the UNITE database using the QIIME 1.8 closed-reference OTU (organised taxonomic unit) picking workflow.
M
AN
US
CR
IP
T
AC
CE
PT
ED
6 Overall fungal burden was determined using RT-PCR with Aspergillus 18S specific or pan-fungal ITS1-2 region primers as previously described (7,40,41).
Estimation of A. fumigatus complex clonality and diversity.
M
AN
US
CR
IP
T
AC
CE
PT
ED
7 RESULTSRecruitment of patients to the study.
This was an observational study conducted between November 2011 and November 2013 at the National Aspergillosis Centre (NAC) and the North West Severe Asthma Centre based at the University Hospital of South Manchester. Sixty four adults (31 female and 33 male) aged 22-75 years old were enrolled. All current or previous smokers had <10 pack years. No bronchoscopy samples were obtained from five patients and DNA extraction was unsuccessful in one. Therefore 58 patients were included in this study (ABPA n=16, SAFS n=16, severe asthma without fungal sensitisation (SA) n=9, mild asthma (MA) n=7 and healthy controls (HC) n=10) (Table 1 and Online Supplement Table E2). ABPA, SAFS and SA patients were recruited from a cohort of patients attending the above clinics. MA and HC subjects were recruited from among members of staff, general public and students from the University of Manchester. No individual in the study had cystic fibrosis. All patients gave a written informed consent to participate in the study, which was approved by the local Research Ethics Committee (REC reference no 11/NW/0175).
Mycobiome composition of BAL samples
Results from QIIME closed reference BLAST workflows using ITS1 overlapped sequences are shown in Figure 1A-C. A. fumigatus complex is predominant in lung samples. The load of fungus was estimated using RT-PCR and correlates closely with read count from the raw QIIME analysis (Figure 1 A) (Online Supplement Figure E1). Loads are very variable across samples (Figure 1A and 1B). Healthy individuals all have low fungal burden and are characterised by a high proportion of Basidiomycete DNA (Figure 1B) which is assigned by QIIME to unknown Malasezziales. BLAST results for these sequences are most consistent with M. restricta or a closely related species. Levels of fungus are highly variable between individuals but the highest levels of fungus are observed in severe asthmatics (Online Supplement Figure E2). When fungal loads are higher (>2 fold average) than those observed in healthy individuals the increased load is always due to additional burden of A. fumigatuscomplex (Supp Figure 2). A. fumigatus complex (Figure 1B) forms the largest proportion of fungi in the disease groups (20). ITS1 is not useful for precise assignment of species within the A. fumigatuscomplex and so assignation of species in this clade is represented as A. fumigatus species complex only. Reverse BLAST+ analysis using formatted fastq files as databases confirmed species identification.
Diverse A. fumigatuscomplex sequences are observed in individual lungs.
M
AN
US
CR
IP
T
AC
CE
PT
ED
8 set of identical ITS sequences representing between 22 and 61% of the total retrieved sequences was found in each sample. These identical sequences sit at the centre of the radial cladograms shown. Each diverse ITS sequence is shown as a branch on the cladogram with phylogenetic distance indicated by the scale. For all samples the branches consist of only one diverse ITS sequence.Comparison of the lung mycobiome by disease and treatment.
The secondary objective in this study was to determine whether different therapy could be associated with the mycobiome composition of the lung. To determine whether particular therapy or phenotype was associated with altered mycobiome we compared groups of individuals in this study by disease and treatment type. The groups are complex with considerable potential for confounding treatments or conditions. For example many individuals receiving antifungal therapy are also receiving steroid therapy. We estimated fungal burden using QIIME fungal composition (Figure 1) adjusted using fungal load as determined by total fungal RT-PCR, as well as by total fungal RT-PCR alone and Aspergillus -specific RT-PCR (7).
In order to determine whether individuals receiving oral itraconazole had lower loads of fungi in their lung samples, patients were initially grouped into those derived from individuals currently on itraconazole therapy (CURRENT group; n=17 including 8 ABPA, 9 SAFS), those who had previously been on itraconazole therapy (PREVIOUS group; n=10 including 5 ABPA, 3 SAFS, 2 SA) and those who had never been given itraconazole (NEVER group; n= 31 including 3 ABPA, 3 SAFS, 8 SA, 7 MA, 10 HC) (Figure 3). Antifungal therapy consisted of oral itraconazole, dosed to achieve therapeutic levels as determined by repetitive itraconazole blood measurements. Results based on RT-PCR were used to determine whether this finding was robust. Our results show that fungal load is comparable between those currently on therapy and those who have never been treated. In comparison, load of fungus in individuals with fungal disease who had stopped taking antifungal therapy are higher. The highest burden of fungus is observed in individuals with a history of itraconazole treatment but who were not on itraconazole therapy when sampled (PREVIOUS group). The lowest fungal burden was observed in individuals never treated with itraconazole (NEVER group).
M
AN
US
CR
IP
T
AC
CE
PT
ED
M
AN
US
CR
IP
T
AC
CE
PT
ED
10 DISCUSSIONTo our knowledge, this is the first study to identify the composition of the mycobiome in lungs of individuals with fungal disease. We show differences in fungal load in groups of individuals receiving corticosteroid treatment and antifungal therapy. The lung mycobiome varies substantially between individuals but is always at low level in healthy individuals and increased load is always due to higher levels of A.fumigatus complex.
A. fumigatuscomplex is the predominant fungus in the lung mycobiome in asthma and allergic fungal disease. Individuals receiving corticosteroid therapy have significantly higher loads of fungus in their lungs than those not receiving steroid therapy irrespective of their underlying disease. None of the mild asthmatics or healthy controls were on therapies that are predicted to influence their lung mycobiome or bacterial microbiome, and so these findings probably reflect the normal mycobiome of Caucasians in the North West of England.
In general our study shows comparable levels and taxa of fungi to previous studies (21–24). Additionally we manually removed fungal speciesidentified as arising from reagent contamination. In our study we did not observe Wallemia spp. contamination (25). This study was limited by the numbers of patients that could feasibly be bronchoscoped and the high variability of fungal level between samples. Therefore statistical power in some comparisons is low. However, we note that where specific treatments can be separated from confounding factors, significant differences in mycobiome associated with treatment can be observed, even with the limited numbers obtained. Future studies would benefit from either much larger recruitment of individuals with fungal disease but more importantly by careful selection of individuals using narrow treatment and/or endotype criteria. Lavage aliquots from several washes were combined in this study in order to maximise recovery of fungal DNA and the resulting data is likely to represent the combined bronchial and bronchoalveolarfungal communities.
In addition to A. fumigatus complex, we found a wide variety of other fungi. Our analysis shows a higher proportion of Aspergillus than has been previously reported with lower loads of Candida (8,25).Control experiments using no sample or spiked BAL samples from cough patients did not suggest that the efficiency of PCR and sequence assignation from
M
AN
US
CR
IP
T
AC
CE
PT
ED
11 Fungal burdens in the lungs of individuals with asthma or severe forms of asthma are comparable to those in individuals with well characterised allergic fungal disease. Fungal loads are highly variable between individuals with very high loads of fungus occurring only in those with ABPA, asthma and severe asthma. The difference in fungal load is almost always caused by increased level of A. fumigatus complex fungi. This might suggest that SAFS is simply a variant form of SA with a disproportionate IgE sensitivity and associated immunopathological reactions to fungi. The high variability in fungal load means that the differences between disease groups observed are not significant. Alpha – diversity metrics do not suggest differences in composition between these groups.The observation of diverse sequences in the A. fumigatus complex group (Figure 2) suggested that infection or colonisation did not arise from a single inoculum. Assuming that identical ITS1 sequences represent expansion of mycelium from a small inoculum then the presence of a high proportion of identical ITS sequences in all samples suggests that a substantial proportion of the A. fumigatus complex in any given sample arises from a single inoculum or a dominant strain. The remaining sequences are diverse with no sequence duplicated and suggest the presence of a wide range of fungifrom the A. fumigatus complex in each diseased persons’ lungs.It is possible that lungs of individuals with excess mucus (a characteristic feature of asthma) act as efficient spore traps and simply accumulate fungal spores from inhaled air and that relative loads of fungus observed simply reflect environmental abundance and the physical dynamics of spore deposition for small sporing fungi. However it is well known that there are genetic factors that predispose some individuals to ABPA and these factors may also explain why some individuals have higher fungal burden (26,27). Alternatively, the excess mucus could ‘protect’ A. fumigatus from phagocytic attack or differential adhesion to epithelial cells (28). In any scenario, at least some of the inhaled spores probably germinate forming mycelia that produce allergens in the airways (7,29). Substantial mycelium is commonly observed intermingled with eosinophils and neutrophils in plugs of sputum from asthmatics supporting the hypothesis that at least some of the fungal population could grow from a single inoculum (30).
M
AN
US
CR
IP
T
AC
CE
PT
ED
12 with remission of symptoms (5),however relapse is frequent on discontinuation. The interaction of steroid treatment with the lung mycobiome in such cases would clarify the effects of steroid treatment on fungal burden. One potential weakness of this study is the lack of information regarding cumulative steroid use in the cohort, if this is important. Increased cumulative use could be a factor determining fungal burden and correlation of cumulative steroid use and fungal burden is a future objective for this work. A further possibility is that the age of the study participants may also determine fungal burden. We are unable to show any confounding effect for age in our data however the numbers of individuals in the study groups are small and we cannot rule out the possibility that age related effects may emerge from larger study numbers in the future. One other potential effect of age may be that it is correlates with increased cumulative steroid exposure.
As expected, individuals receiving antifungal therapy had lower loads of fungus in the lung and it is striking that the load in individuals who stopped antifungal therapy was significantly higher than in untreated individuals. Individuals with worse asthma linked to fungal allergy in our practice are more often prescribed antifungals and it is of great interest that higher fungal loads in their lungs are associated with cessation of therapy.
M
AN
US
CR
IP
T
AC
CE
PT
ED
13 ACKNOWLEDGEMENTS
M
AN
US
CR
IP
T
AC
CE
PT
ED
14 POTENTIAL CONFLICTS OF INTEREST
Dr Bowyer is a co - founder of Alergenetica SL, an immunotherapeutics company and Syngenics Ltd., a food diagnostics company and has current grant support from Medical Research Council, Fungal Infection Trust, EU Framework 7 and National Institute of Health.
Dr Denning holds Founder shares in F2G Ltd a University of Manchester spin-out antifungal discovery company, in Novocyt which markets the Myconostica real-time molecular assays and has current grant support from the National Institute of Health Research, Medical Research Council, Global Action Fund for Fungal Infections and the Fungal Infection Trust. He acts or has recently acted as a consultant to Astellas, Sigma Tau, Basilea, Scynexis, Cidara, Biosergen, Quintilles, Pulmatrix, Zambon and Pulmocide. In the last 3 years, he has been paid for talks on behalf of Astellas, Dynamiker, Gilead, Merck and Pfizer. He is also a member of the Infectious Disease Society of America Aspergillosis Guidelines and European Society for Clinical Microbiology and Infectious Diseases Aspergillosis Guidelines groups.
M
AN
US
CR
IP
T
AC
CE
PT
ED
15 REFERENCES
1. Brown GD, Denning DW, Gow NAR, Levitz SM, Netea MG, White TC. Hidden killers: human fungal infections. SciTransl Med. 2012 Dec 19;4(165):165rv13.
2. Denning DW, O’Driscoll BR, Hogaboam CM, Bowyer P, Niven RM. The link between fungi and severe asthma: a summary of the evidence. EurRespir J. 2006 Mar;27(3):615–26.
3. Chowdhary A, Agarwal K, Kathuria S, Gaur SN, Randhawa HS, Meis JF. Allergic bronchopulmonary mycosis due to fungi other than Aspergillus: a global overview. Crit Rev Microbiol. 2014 Feb;40(1):30–48.
4. Agarwal R, Chakrabarti A, Shah A, Gupta D, Meis JF, Guleria R, et al. Allergic bronchopulmonaryaspergillosis: review of literature and proposal of new diagnostic and classification criteria. ClinExp Allergy J. 2013 Aug;43(8):850–73.
5. Denning DW, Pashley C, Hartl D, Wardlaw A, Godet C, Del Giacco S, et al. Fungal allergy in asthma-state of the art and research needs. ClinTransl Allergy. 2014;4:14.
6. Denning DW, Park S, Lass-Florl C, Fraczek MG, Kirwan M, Gore R, et al. High-frequency triazole resistance found InnonculturableAspergillusfumigatus from lungs of patients with chronic fungal disease. Clin Infect Dis 2011 May;52(9):1123–9.
7. Fraczek MG, Kirwan MB, Moore CB, Morris J, Denning DW, Richardson MD. Volume dependency for culture of fungi from respiratory secretions and increased sensitivity of
Aspergillus quantitative PCR.Mycoses. 2014 Feb;57(2):69–78.
8. Tipton L, Ghedin E, Morris A. The lung mycobiome in the next-generation sequencing era.Virulence. 2016 Sep 29;1–8.
9. Surana N, Kasper. Infectious Diseases. In: Harrison’s Principles of Internal Medicine [Internet]. 19th ed. McGraw-Hill, New York; [cited 2017 Jan 5]. p. 761–1435. Available from: http://www.harrisonsim.com/
10. Denning DW. The ambitious ‘95-95 by 2025’ roadmap for the diagnosis and management of fungal diseases.Thorax. 2015 Jul;70(7):613–4.
11. Singh M, Das S, Chauhan A, Paul N, Sodhi KS, Mathew J, et al. The diagnostic criteria for allergic bronchopulmonaryaspergillosis in children with poorly controlled asthma need to be re-evaluated. ActaPaediatr Oslo Nor 1992. 2015 May;104(5):e206-209.
M
AN
US
CR
IP
T
AC
CE
PT
ED
16 13. Knutsen AP, Bush RK, Demain JG, Denning DW, Dixit A, Fairs A, et al. Fungi and allergic lower respiratory tract diseases. J Allergy ClinImmunol. 2012 Feb;129(2):280-291-293.
14. Namvar S, Warn P, Farnell E, Bromley M, Fraczek M, Bowyer P, et al. Aspergillus fumigatus proteases, Asp f 5 and Asp f 13, are essential for airway inflammation and remodelling in a murine inhalation model. ClinExp . 2015 May;45(5):982–93.
15. Denning DW, O’Driscoll BR, Powell G, Chew F, Atherton GT, Vyas A, et al. Randomized controlled trial of oral antifungal treatment for severe asthma with fungal sensitization: The Fungal Asthma Sensitization Trial (FAST) study. Am J RespirCrit Care Med. 2009 Jan 1;179(1):11–8.
16. Schaffner A, Douglas H, Braude A. Selective protection against conidia by mononuclear and against mycelia by polymorphonuclear phagocytes in resistance to Aspergillus. Observations on these two lines of defense in vivo and in vitro with human and mouse phagocytes. J Clin Invest. 1982 Mar;69(3):617–31.
17. Ng TT, Robson GD, Denning DW. Hydrocortisone-enhanced growth of Aspergillus spp.: implications for pathogenesis. Microbiol Read Engl. 1994 Sep;140 ( Pt 9):2475–9.
18. Life [Internet]. [cited 2017 Jan 5]. Available from: http://www.life-worldwide.org/fungal-diseases/corticosteroids
19. Normansell R, Kew KM, Mansour G. Different oral corticosteroid regimens for acute asthma. Cochrane Database Syst Rev. 2016 May 13;(5):CD011801.
20. Samson RA, Visagie CM, Houbraken J, Hong S-B, Hubka V, Klaassen CHW, et al. Phylogeny, identification and nomenclature of the genus Aspergillus. Stud Mycol. 2014 Jun;78:141–73.
21. Erb-Downward JR, Thompson DL, Han MK, Freeman CM, McCloskey L, Schmidt LA, et al. Analysis of the lung microbiome in the ‘healthy’ smoker and in COPD. PloS One. 2011 Feb 22;6(2):e16384.
22. Kim SH, Clark ST, Surendra A, Copeland JK, Wang PW, Ammar R, et al. Global Analysis of the Fungal Microbiome in Cystic Fibrosis Patients Reveals Loss of Function of the Transcriptional Repressor Nrg1 as a Mechanism of Pathogen Adaptation. PLoSPathog. 2015 Nov;11(11):e1005308.
M
AN
US
CR
IP
T
AC
CE
PT
ED
17 24. Delhaes L, Monchy S, Fréalle E, Hubans C, Salleron J, Leroy S, et al. The airway microbiota in cystic fibrosis: a complex fungal and bacterial community--implications for therapeutic management. PloS One. 2012;7(4):e36313.
25. Bittinger K, Charlson ES, Loy E, Shirley DJ, Haas AR, Laughlin A, et al. Improved characterization of medically relevant fungi in the human respiratory tract using next-generation sequencing. Genome Biol. 2014;15(10):487.
26. Overton NL, Denning DW, Bowyer P, Simpson A. Genetic susceptibility to allergic bronchopulmonary aspergillosis in asthma: a genetic association study. Allergy Asthma Clin Immunol. 2016 Sep 27;12:47.
27. Agarwal R, Aggarwal AN, Gupta D, Jindal SK. Aspergillus hypersensitivity and allergic bronchopulmonary aspergillosis in patients with bronchial asthma: systematic review and meta-analysis. Int J Tuberc Lung Dis. 2009;13:936–944
28. Gravelat FN, Beauvais A, Liu H, Lee MJ, Snarr BD, Chen D, et al. Aspergillusgalactosaminogalactan mediates adherence to host constituents and conceals hyphal β-glucan from the immune system. PLoSPathog. 2013;9(8):e1003575.
29. Green BJ, Mitakakis TZ, Tovey ER. Allergen detection from 11 fungal species before and after germination.J Allergy ClinImmunol. 2003 Feb;111(2):285–9.
30. Pashley CH, Fairs A, Morley JP, Tailor S, Agbetile J, Bafadhel M, et al. Routine processing procedures for isolating filamentous fungi from respiratory sputum samples may underestimate fungal prevalence. Med Mycol. 2012 May;50(4):433–8.
31. Bafadhel M, McKenna S, Agbetile J, Fairs A, Desai D, Mistry V, et al.
Aspergillusfumigatus during stable state and exacerbations of COPD. EurRespir J. 2014 Jan;43(1):64–71.
32. Philippe B, Ibrahim-Granet O, Prévost MC, Gougerot-Pocidalo MA, Sanchez Perez M, Van der Meeren A, et al. Killing of Aspergillusfumigatus by alveolar macrophages is mediated by reactive oxidant intermediates. Infect Immun. 2003 Jun;71(6):3034–42.
33. Crameri R, Garbani M, Rhyner C, Huitema C. Fungi: the neglected allergenic sources. Allergy. 2014 Feb;69(2):176–85.
34. Du Rand IA, Barber PV, Goldring J, Lewis RA, Mandal S, Munavvar M, et al. British Thoracic Society guideline for advanced diagnostic and therapeutic flexible bronchoscopy in adults. Thorax. 2011 Nov;66Suppl 3:iii1-21.
M
AN
US
CR
IP
T
AC
CE
PT
ED
18 36. Fraczek MG, Bromley M, Buied A, Moore CB, Rajendran R, Rautemaa R, et al. The cdr1B efflux transporter is associated with non-cyp51a-mediated itraconazole resistance in Aspergillusfumigatus. J AntimicrobChemother. 2013 Jul;68(7):1486–96.
37. Edgar RC, Haas BJ, Clemente JC, Quince C, Knight R. UCHIME improves sensitivity and speed of chimera detection. Bioinforma. 2011 Aug 15;27(16):2194–200.
38. QIIME allows analysis of high-throughput community sequencing data. - PubMed - NCBI [Internet]. [cited 2017 Jan 7]. Available from: https://www.ncbi.nlm.nih.gov/pubmed/20383131/
39. Nilsson RH, Ryberg M, Kristiansson E, Abarenkov K, Larsson K-H, Kõljalg U. Taxonomic reliability of DNA sequences in public sequence databases: a fungal perspective. PloS One. 2006 Dec 20;1:e59.
40. Pfaffl MW. A new mathematical model for relative quantification in real-time RT-PCR. Nucleic Acids Res. 2001 May 1;29(9):e45.
41. Torelli R, Sanguinetti M, Moody A, Pagano L, Caira M, De Carolis E, et al. Diagnosis of invasive aspergillosis by a commercial real-time PCR assay for Aspergillus DNA in bronchoalveolar lavage fluid samples from high-risk patients compared to a galactomannan enzyme immunoassay. J ClinMicrobiol. 2011 Dec;49(12):4273–8.
42. Altschul SF, Gish W, Miller W, Myers EW, Lipman DJ. Basic local alignment search tool. J Mol Biol. 1990 Oct 5;215(3):403–10.
43. Edgar RC. MUSCLE: multiple sequence alignment with high accuracy and high throughput. Nucleic Acids Res. 2004;32(5):1792–7.
44. Larsson A. AliView: a fast and lightweight alignment viewer and editor for large datasets. Bioinforma. 2014 Nov 15;30(22):3276–8.
M
AN
US
CR
IP
T
AC
CE
PT
ED
19 Figure legends:Figure 1.Mycobiome composition of BAL from individuals with allergic disease.(A) Level of fungus in BAL as assessed by total fungal RT-PCR. Ct values were converted into genome equivalents by calibration against known samples. (B) Fungal composition of each sample. The colour key for the most common taxons is given below the diagram. (C) Patient information for each sample. Samples are grouped by disease: ABPA, allergic bronchopulmonaryaspergillosis; HEALTHY, healthy controls; MA, mild asthmatics; SA, severe asthmatics with no fungal sensitisation; SAFS, severe asthmatics with fungal sensitisation. Antifungal (AF) and steroid treatment is indicated by the bars above the disease type with key below the diagram
Figure 2.Variation in the A. fumigatus population in individual samples. Two typical samples are shown for patient 34 (healthy control) and 35 (severe asthma). A. fumigatus
specific sequences were extracted from fastq files by BLAST+ then aligned using MUSCLE trimmed in ALIVIEW and trees constructed using PhyML. Typical A. fumigatussensustrictuand A. lentulus sequences were included in the analysis and are indicated in the figure. Each tree shows a core set of A. fumigatussequences with 84/256 sequences for patient 34 and 260/458 for patient 35 being identical to the A. fumigatus
sequence. Trees are constructed using ITS1 sequence to demonstrate isolate variation but are unlikely to represent true speciation.
Figure 3. Effects of antifungal therapy on fungal load in BAL. Per-individual loads of fungus and A. fumigatus grouped by antifungal treatment status.(A) Read count estimated loads of total fungus grouped by antifungal treatment. (B) Read count estimated load of A. fumigatus complex spp. grouped by antifungal treatment. CURRENT, individuals currently receiving antifungal therapy; NEVER, individuals that have never received antifungal therapy; PREVIOUS, individuals that have previously received antifungal therapy.
M
AN
US
CR
IP
T
AC
CE
PT
ED
20 steroid treatment). All individuals with previous antifungal therapy have SAFS or ABPA. *, p value <0.05; **, p value <0.01.
[image:22.612.132.514.171.667.2]M
AN
US
CR
IP
T
AC
CE
PT
ED
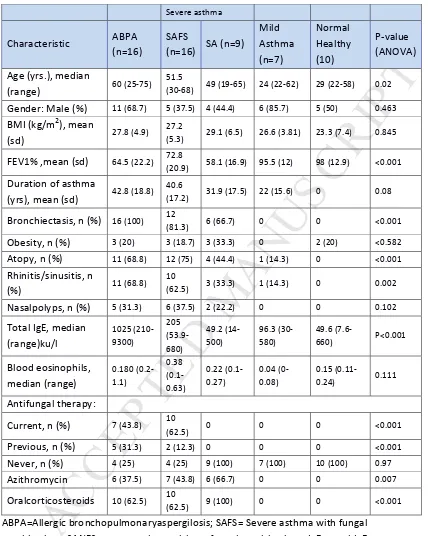
21 Table 1. Patient and healthy control demographicsSevere asthma
Characteristic ABPA (n=16)
SAFS
(n=16) SA (n=9)
Mild Asthma (n=7) Normal Healthy (10) P-value (ANOVA)
Age (yrs.), median
(range) 60 (25-75)
51.5
(30-68) 49 (19-65) 24 (22-62) 29 (22-58) 0.02
Gender: Male (%) 11 (68.7) 5 (37.5) 4 (44.4) 6 (85.7) 5 (50) 0.463
BMI (kg/m2), mean
(sd) 27.8 (4.9)
27.2
(5.3) 29.1 (6.5) 26.6 (3.81) 23.3 (7.4) 0.845
FEV1% ,mean (sd) 64.5 (22.2) 72.8
(20.9) 58.1 (16.9) 95.5 (12) 98 (12.9) <0.001
Duration of asthma
(yrs), mean (sd) 42.8 (18.8)
40.6
(17.2) 31.9 (17.5) 22 (15.6) 0 0.08
Bronchiectasis, n (%) 16 (100) 12
(81.3) 6 (66.7) 0 0 <0.001
Obesity, n (%) 3 (20) 3 (18.7) 3 (33.3) 0 2 (20) <0.582
Atopy, n (%) 11 (68.8) 12 (75) 4 (44.4) 1 (14.3) 0 <0.001
Rhinitis/sinusitis, n
(%) 11 (68.8)
10
(62.5) 3 (33.3) 1 (14.3) 0 0.002
Nasalpolyps, n (%) 5 (31.3) 6 (37.5) 2 (22.2) 0 0 0.102
Total IgE, median (range)ku/l 1025 (210-9300) 205 (53.9-680) 49.2 (14-500) 96.3 (30-580) 49.6
(7.6-660) P<0.001
Blood eosinophils, median (range) 0.180 (0.2-1.1) 0.38 (0.1-0.63) 0.22 (0.1-0.27) 0.04 (0-0.08) 0.15
(0.11-0.24) 0.111
Antifungal therapy:
Current, n (%) 7 (43.8) 10
(62.5) 0 0 0 <0.001
Previous, n (%) 5 (31.3) 2 (12.3) 0 0 0 <0.001
Never, n (%) 4 (25) 4 (25) 9 (100) 7 (100) 10 (100) 0.97
Azithromycin 6 (37.5) 7 (43.8) 6 (66.7) 0 0 0.007
Oralcorticosteroids 10 (62.5) 10
(62.5) 9 (100) 0 0 <0.001 ABPA=Allergic bronchopulmonaryaspergilosis; SAFS= Severe asthma with fungal
sensitization; SANFS=severe asthma without fungal sensitisation; tIgE =total IgE,
M
AN
US
CR
IP
T
AC
CE
M
AN
US
CR
IP
T
AC
CE
M
AN
US
CR
IP
T
AC
CE
M
AN
US
CR
IP
T
AC
CE
M
AN
US
CR
IP
T
AC
CE
M
AN
US
CR
IP
T
AC
CE
M
AN
US
CR
IP
T
AC
CE
M
AN
US
CR
IP
T
AC
CE
PT
ED
Online Data Supplement
Corticosteroid treatment is associated with increased filamentous fungal burden
in airways
Marcin G. Fraczek1,2,5, Livingstone Chishimba2,6, Rob M. Niven2, Mike Bromley1, Angela Simpson2,
M
AN
US
CR
IP
T
AC
CE
PT
ED
Recruitment of patients to the study
Inclusion criteria. The inclusion criteria included: men or women, age (18-70 years old), lifelong
non-smokers (<10 pack years) who had a physician diagnosis of asthma (or no asthma for healthy
controls), ABPA, or SAFS; had no coexisting inflammatory chronic lung disease (except
bronchiectasis in ABPA, SAFS and SA) and had an FEV1 ≥1 L/sec taken within the preceding 3
months. All patients with asthma underwent reversibility testing and confirmed by
post-bronchodilator (PBD) increase in FEV1 ≥12% and or ≥200 mL compared with baseline (67) (except
in some cases of chronic asthma who might have fixed airflow obstruction (68-69), in the absence
of features suggestive of COPD). Patients with symptoms suggestive of asthma but with no
evidence of PBD reversibility features of asthma (provided no fixed airflow obstruction) underwent
airway hyperresponsiveness test using methacholine challenge test (MCT) (70). A diagnosis of
asthma was considered when there was a significant bronchial responsiveness demonstrated by ≥
20% fall in the FEV1 with methacholine challenge (PC20 or PD20 FEV1) on a 5-breath dosimeter
protocol (71-72).
ABPA was defined as the patient’s highest serum total IgE of greater than 1000IU/L, raised serum
anti-Aspergillus IgE (or positive Aspergillus skin prick test), a history of asthma, with compatible
symptoms of ABPA (expectoration of mucus plugs and difficult to control asthma) (4,11). Central
bronchiectasis and a raised Aspergillus IgG were not required to make a diagnosis of ABPA,
although commonly found. SAFS was diagnosed by a combination of severe asthma, positive IgE or
skin prick test to any fungus tested and a total IgE of <1000 IU/L, as previously defined (27).
Subjects also needed to have had stable disease with no recent flare−ups (within 4 weeks) and to
have met the safety criteria to have a bronchoscopy including oxygen saturations whilst breathing
room air of >90%. Normal healthy subjects had no evidence of any long term lung condition and
no chest infection in the preceding 4 weeks. A summary of subject demographics is shown in Table
1 and details of phenotyping are shown in Supp. Table 1.
Exclusion criteria. Patients with a significant smoking history (>10 pack years), doubtful diagnosis,
significant respiratory comorbidities (except bronchiectasis) or a history of myocardial infarction
within the preceding 6 weeks were excluded from the study. We also excluded patients with
conditions that may mimic asthma including COPD, tracheobronchomalacia (TBM),
hypersensitivity pneumonitis, pulmonary vasculitis including eosinophilic granulomatosis with
polyangiitis (EGPA - formerly known as Churg-Strauss syndrome). Also excluded were those
patients with conditions associated with an elevated IgE such as hyper-IgE syndrome or patients
M
AN
US
CR
IP
T
AC
CE
PT
ED
therapy and anti-IgE therapy (omaluzimub). In addition, those unable to give valid informed
consent were excluded.
Sample collection and processing.
Patients were identified using the exclusion and inclusion criteria defined above. Briefly, 64
individuals were identified with 58 agreeing to bronchoscopy (Table 1 and suppl. Table 1).
Bronchoalveolar lavage (BAL) samples were collected using local guidelines and BST standard
procedures (31). If possible the lavage samples were collected from lobes with significant
radiological abnormality. Where there were no radiological abnormalities such as in SAFS, healthy
controls (HC) or most asthmatics, the samples were collected from the right lower lobes. A
maximum volume of 240 ml (4 x 60 ml) of pre-warm sterile 0.9% saline (NaCl) solution was
instilled. The volume instilled was judged by the clinician based on the patients’ clinical condition
and current oxygen saturation. Recovery of BAL varied between disease groups: for HC recovery
was 50-113% (mean 67%), ABPA – 20-76% (mean 51%), mild asthma (MA) 57-81% (mean 69%),
severe asthma non-fungal sensitised (SA) 50-84% (mean 69%), SAFS 30-93% (mean 61%). After
bronchoscopy all collected samples were immediately placed on ice and transferred to the The
BAL was subjected to DNA extraction, PCR and Illumina sequencing as described below. Dilution of
endogenous lung fluids in the lavage medium was estimated as described (32) using a Sigma urea
M
AN
US
CR
IP
T
AC
CE
PT
ED
Quantification of fungal burden using RT-PCR.
Overall fungal burden was determined using RT-PCR with ITS1 and ITS4 primers with SYBR-Green
detection in an Applied Biosystems 7500 RT-PCR machine. Each sample was assayed in triplicate
using standards containing known quantities of A. fumigatus and C. albicans DNA. The
MycAssayAspergillus kit (Myconostica) and the SmartCycler system (Cepheid, Sunnyvale, CA, USA)
were used for A. fumigatus complex qPCR essentially as described (13). Negative DNA and known
DNA controls as well as internal qPCR controls were also analysed. Data are presented as relative
values compared to a 100 ng A. fumigatus standard calculated using a ∆∆CT2 method (44). MycAssayAspergillus may also generate positive results for Penicillium spp. (45). Genome
equivalents were calculated using A. fumigatus AF293 as comparator assuming a rDNA copy
number of 38 as previously determined for this isolate (1 ng/ml of a 28Mb haploid genome ≈3049
rRNA copies@38 per genome ≈ 108 genomes/ml). This figure is unlikely to be accurate for all
species in this study hence genome equivalent measures should be regarded as estimates.
.
Figure E1. Correlation between read count estimates and RT-PCR based estimates of A.
fumigatus level. Total read counts for all fungi (A) or all members of the A. fumigatus complex
plus Penicillia (B) were plotted against relative quantity (µg/ml) assessed by comparison (∆∆Ct2) to
a RT-PCR standard consisting of 100 ng A. fumigatus DNA. There is good correlation between the
RT-PCR using ITS1 and ITS4 primers and total fungal read count (R2 = 0.947) and between
Aspergillus specific PCR and Aspergillus read count (R2 = 0.95). Panel A relative to 200ng total
[image:34.612.82.507.337.594.2]M
AN
US
CR
IP
T
AC
CE
PT
ED
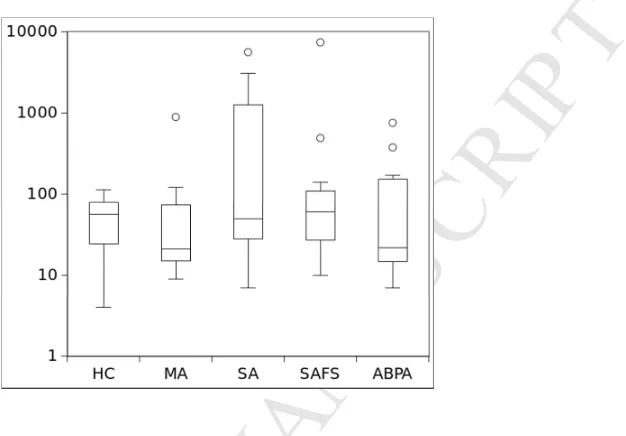
Fungal mycobiome level in different disease groups.
Average genome equivalent levels from individuals in disease groups were calculated and are
[image:35.612.197.510.148.366.2]shown in Supp. Figure 2. No significant difference between any 2 groups was observed.
Figure E2.Loads of fungus in lung by disease group. Average genome equivalents/ml for all fungi
are plotted against the disease type. No significant differences between groups is observed. HC,
healthy control; MA, mild asthma; SA, severe asthma; SAFS, severe asthma with fungal
M
AN
US
CR
IP
T
AC
CE
PT
ED
Effects of steroid on fungal level
We initially examined the effect of steroid treatment on fungal level by comparing average fungal
level in different disease groups separated by steroid treatment. Only individuals in the severe
asthma (SA), ABPA and SAFS groups received steroid therapy. We noted that effects in this
analysis apparently significantly associating steroid therapy with increased fungal level (Figure E3)
[image:36.612.153.518.146.490.2]could be confounded by antifungal therapy leading to the analysis presented in Figure 4.
Figure E3.Loads of fungus in lung by disease group considering corticosteroid therapy. Average
levels for all fungi (genome equivalents per ml) in each group are plotted against the disease type.
HC, healthy control; MA, mild asthma; SA, severe asthma; SAFS, severe asthma with fungal
sensitisation; ABPA, allergic bronchopulmonary aspergillosis; **, p <0.01; +S current corticosteroid
M
AN
US
CR
IP
T
AC
CE
PT
ED
DNA extraction, PCR and Illumina sequencing.
In order to determine the microbial composition in the BAL, each sample was subjected to DNA
extraction, PCR and IlluminaMiSEQ/Nextera XT sequencing. BAL samples were processed
immediately after they were obtained, without storage. After initial processing (above), samples
were transferred to high performance 50 ml Falcon tubes (VWR) and centrifuged at 10000 x g for
20 min at 4°C. DNA extraction was carried out on both the pellet and supernatant (500 µl) using a
CTAB method previously described (33). The DNA was resuspended in sterile dH2O, quantified
using a spectrophotometer and stored at -80°C until used for PCR and sequencing. Only DNA
obtained from the pellets was used for sequencing.
PCR was designed to target the fungal ITS1 region(Suppl. Table 1). PCRs were carried out in
accordance with the ’16S Metagenomic Sequencing Library Preparation’ protocol (Illumina) with
modifications as described below.Briefly, KAPA HiFiHotstart Polymerase (Peqlab) was used for PCR
in a total volume of 25 µl per sample. In the first PCR step 5 µl DNA containing 100 ng of total
sample DNA was used with primers targeting the rDNA genes and containing specific Illumina
overhang adapters. For fungal PCR, 5 mM of forward and reverse primer was used. Initial
touchdown PCR of 5 cycles (95°C for 30 sec, 45-50°C for 30 sec, 72°C for 30 sec) was carried out
before 25 cycles of 95°C for 30 sec, 55°C for 30 sec and 72°C for 30 sec. Following the PCR all 5
reaction mixtures per BAL sample were pooled and purified using Agencourt AMPure XP magnetic
beads as per manufacturer’s instructions. The quality of the reactions was tested by
electrophoresis on a 1.5% agar gel. Subsequently 5 µL of each purified pooled sample was used for
indexing PCR using the Nextera XT Index Kit (Illumina) as per manufacturer’s instructions and all
reactions were bead purified as above. In order to balance the indexed sequencing reactions were
pooled, normalised to 10 nM and sequenced using both lanes of an IlluminaMiSeq for 2x250
paired end reads. Controls consisted of sterile water or known dilution series of A. fumigatus or C.
albicans DNA substituted for BAL and also added to BAL in the initial sample prep then carried
through each step in the procedure before sequencing. The resulting fastq files were filtered for
quality using TrimmomaticSE v0.32 using trailing/leading quality scores of 30 and a 3 bp sliding
window phred score of 28. Results were analysed using QIIME v1.8. Read counts were adjusted to
normalise for urea level and pre-sequencing dilution so that numbers represented reads from
equivalent initial BAL volumes adjusted for bronchoscopy dilution effects using urea level. We
make the assumption that BAL recovery does not represent either concentration or dilution of the
M
AN
US
CR
IP
T
AC
CE
PT
ED
alter the significance of the results, hence results presented are adjusted for dilution using the
urea assay but not for BAL recovery by volume.
Design of PCR for lung mycobiomes.
PCR of complete fungal ITS (ITS1-5.8S-ITS2) sequences using ITS1 and ITS4 primers did not PCR
efficiently from lung samples (only 16/58 samples resulted in visible ITS band on an agarose gel)
and test runs suggested that mean read length obtained from a 2x250 bpMiSEQ run after QC
(Phred>/=26) was 214 bp, giving sequences that could not be overlapped in most cases. Hence, we
chose to sequence the shorter fungal ITS1 target using primers ITS1 and ITS2 giving amplicons
short enough in most cases (estimated size range was 150-290 bp) to give overlapping forward
and reverse sequence. We note however, that several known fungal target amplicons are longer
and may therefore become under-represented in the overlapped sequence set depending on
sequence length after quality filtering. For this reason fungal populations were calculated using
forward and reverse paired sequences alone and overlapped ITS1 sequences. Minor differences
were observed between forward (ITS1 primer) and overlapped sequences whereas reverse (ITS2
primer) sequences gave a slight bias towards Basidiomycete taxons.
Table E1. Primers used to amplify fungal rRNA genes in the first amplification reaction for
mycobiome analysis. Each fungal specific primer sequence had an Illumina specific adaptor
attached at the 5’ end (forward primer: TCGTCGGCAGCGTCAGATGTGTATAAGAGACAG, and
reverse primer: GTCTCGTGGGCTCGGAGATGTGTATAAGAGACAG)
Primer name Sequence (5’-3’)
Fungal ITS1:
FungITS1 TCGTCGGCAGCGTCAGATGTGTATAAGAGACAG tccgtaggtgaacctgcgg
FungTS2 GTCTCGTGGGCTCGGAGATGTGTATAAGAGACAG gctgcgttcttcatcgatgc
ITS1 TCCGTAGGTGAACCTGCGG
M
AN
US
CR
IP
T
AC
CE
PT
ED
Statistics.
Unless otherwise stated statistical analysis was performed within QIIME v1.8 using appropriate
QIIME workflows. Beta diversity for fungal taxa was calculated using Bray - Curtis metrics. Principle
component analysis did not indicate significant association of species to any disease group. Other
statistical tests were performed using Graphpad Prism v5.0 or SPSS v20.
Confounding variables were selected a priori and included age, weight, sex, corticosteroid
treatment, antifungal treatment, azithromycin treatment and disease. Groups were stratified and
differences in effects compared to assess potential confounding. Minimum group size after
stratification was 3. Alpha diversity metrics were calculated for fungi using an Excel spreadsheet.
Apha diversity statistics are shown in supplementary table 2. Retesting of ITS1 sequences against
databases was performed essentially as described in Nilsson et al. (39). Pairwise comparison of
specific species within datasets was assessed using T–test or Mann Whitney in cases where
deviation from normal distribution was observed. Statistics were adjusted using
Benjamini-Hochberg correction as appropriate. Dunn’s comparison test was used to identify potential
confounding factors in comparison of multiple groups as appropriate.
Analysis of mycobiome.
The human mycobiome was initially assessed using open-reference OTU picking in QIIME with the
UNITE database as reference. This returned results with very low read counts for fungi in all
samples with high proportions of Candida spp. Although these results matched the low number of
OTUs (10-20) previously observed (41-42) we noted that results obtained from a test dataset
(ITS-soils, http://qiime.org/1.9.0/tutorials/fungal_its_analysis.html) using closed-reference workflows
gave much higher read counts for fungi with significantly different composition QIIME workflows
using closed-reference OTU picking and manual assignation of taxon by BLAST (see below) also
gave very similar and higher read count results. Results were checked using FHiTINGS and
MEGAN5.6.3 (37-43) which suggested that closed reference workflows using BLAST assignment
gave the best results in terms of comparison to manual OTU calling and to alternative methods.
Fungal ITS1 sequences were therefore compared with the UNITE database using the QIIME 1.8
closed-reference OTU (organised taxonomic unit) picking workflow. To confirm that read count
results were representative of fungal species in the sample, we used BLAST+ to extract fungal ITS1
sequences from the fastq files after QC and then used BLAST to assign each sequence to a large
fungal ITS database. This database consists of 186,000 unique fungal ITS sequences collected in
M
AN
US
CR
IP
T
AC
CE
PT
ED
clinical isolates of the Aspergillus, Penicillium, Malasezzia and Cladosporium genera in order to
ensure that these taxa were accurately identified. BLAST+ parameters were set to exclude partial
matches and to output a single result for each input from the fastq. The number of BLAST hits per
species was obtained using custom BASH scripts. This analysis showed close agreement with the
closed reference workflow. Sequence files were also analysed by reference to the FHiTINGS
database (40) again showing close comparison to the results from the QIIME workflow.
Assessment of the main taxons
To check accuracy and specificity of the result, sequences from the most common taxons (>10% of
total) were extracted from fastq files, aligned, and then consensus sequence was cross referenced
with the NCBI nucleotide database. This method revealed two strong false positive results for
Phoma and “unknown Dothidiomycete isolate 108” that arise through spurious amplification of
bacterial sequences by the fungal ITS primers containing short (12-20 bp) regions of homology to
Phoma or the Dothidiomycete ITS1 target in the database. These results are excluded from
analysis using a BLAST E threshold better than 1E-20.
Correctness of species and otu assignation was tested by using a reverse BLAST procedure. Briefly
each fastq file was quality filtered as described then converted to FASTA. This was used as a
database for comparison using the UNITE, SOILS or our bespoke database as query. Results
correlated very closely to the forward BLAST procedure used.
Estimation of A. fumigatus complex clonality and diversity.
To estimate clonality and diversity in the sample we arbitrarily defined identical ITS1 sequences as
clonal and ITS1 sequences differing from the most common clonal ITS1 sequence as diverse. The
most common clonal ITS1 sequences were identical to A. fumigatus sensu strictu ITS1 sequence.
Diversity as defined may not represent different species within the sample.
Aspergillus complex sequences were isolated from fastq files using BLAST+ with empirically
defined parameters based on both the ability of the A. fumigatus ITS query to identify A.
fumigatus complex sequences in the large ITS database and comparison of resulting sequences
isolated from the fastq files with A. fumigatus complex ITS sequences from ITS databases and from
the type sequences as previously defined (46). To reduce the possibility of diversity arising from
sequence error, fastq files were first filtered using TrimmomaticSE to remove end sequences with
phred 33 scores lower than 30 and any sequences containing 3 base windows with quality lower
than phred 30. Files were then filtered to remove sequences shorter than full length ITS1. This
M
AN
US
CR
IP
T
AC
CE
PT
ED
fumigatus sequence and one A. lentulus ITS1 sequence were manually added to the resulting
FASTA file before further analysis for comparison. Sequences were aligned using MUSCLE (47)
trimmed using ALIVIEW (48) and used to make neighbour – joining trees using PHYML in Seaview
M
ANUS
CR
IP
T
AC
CE
PTE
D
ID no. date bronchoscopyage gender ht weight (kg)BMI smoking statuspack yrs
1 04.11.2011 56 Male 167 69.4 24.9 Previous smoker 10
2 18.11.2011 25 Female 168 74.2 26.3 Previous smoker 1
3 25.11.2011 68 Male 171 76.4 26.1 Previous smoker 4
4 25.11.2011 46 Male 175 92.8 30.3 Never smoked 0
5 02.12.2012 30 Female 178 82.4 26 Previous smoker 8
6 06.01.2012 63 Male 179 81.2 25.3 Never smoked 0
7 06.01.2012 23 Female 175 84 27.4 Never smoked 0
8 20.01.2012 44 Male 178 89.8 28.3 Never smoked 0
9 20.01.2012 57 Female 169 81.8 28.6 Previous smoker 15
10 03. 02. 201 2 24
1 172 100.4 33.94 mild asthma 0
11 03.02.2012 64 Male 186 77.6 22.4 Never smoked 0
12 02.03.2012 64 Female 162 112 42.7 Previous smoker 7
13 02.03.2012 52 Female 170 89.8 31.1 current smoker 8
14 09.03.2012 62 Male 177 91.7 29.3 Never smoked 0
15 09.03.2012 75 Male 171 85.8 29.3 Previous smoker 1
16 16.03.2012 55 Female 161 66 25.5 Never smoked 0
17 23.03.2012 53 Female 165 53.6 19.7 Never smoked 0
18 23.03.2012 58 Male 180 90.8 28 Never smoked 0
19 30.03.2012 62 Male 181 78 23.8 Never smoked 0
20 30.03.2012 67 Female Never smoked 0
21 04.05.2012 50 Female Never smoked 0
22 04.05.2012 48 Female 167 64.2 23 Never smoked 0
23 04.05.2012 47 Female 166 109.6 39.8 Previous smoker 7
24 11.05.2012 58 Male 177 80 25.5 Never smoked 0
25 11.05.2012 19 Female 168 55.2 19.2 Never smoked 0
26 18.05.2012 55 Female 160 109.7 42.9 Never smoked 0
27 25.05.2012 65 Male 174 93.2 30.8 Never smoked 0
28 25.05.2012 67 Male 165 68.2 25.1 Never smoked 8
29 01.06.2012 26 Female 177 65.2 20.8 current smoker 10
30 01.06.2012 24 Female 164 72 26.8 current smoker 0
31 01.06.2012 42 Female 175 91 29.7 Previous smoker 10
32 15.06.2012 54 Female 168 77.8 27.6 Never smoked 0
33 15.06.2012 55 Female 155 59.2 24.6 Never smoked 0
34 22.06.2012 32 Male 171 72.2 24.7 Never smoked 0
35 29.06.2012 49 Female 163 59.4 22.4 Never smoked 0
36 06.07.2012 60 Male 170 87.8 30.4 Never smoked 10
37 06.07.2012 49 Male 183 95 28.4 Previous smoker 6
38 03.08.2012 39 Male 178 76.2 24 Previous smoker 5
39 24.08.2012 30 Female 168 70.9 25.1 Never smoked 0
40 31.08.2012 46 Female 163 107.2 40.4 Previous smoker 15
41 30.11.2012 48 Male 172 98.8 33.4 Previous smoker 0
M
ANUS
CR
IP
T
AC
CE
PTE
D
Patient sample observed otus chao1 shannon berger parker_d
1 5 6.5 1.700439718 0.615384615
10 2 2 0.811278124 0.75
11 8 8 2.014945307 0.583333333
12 5 5.5 1.578897903 0.65
13 30 31.90909091 4.136940716 0.19375
14 3 3 1.298794941 0.625
15 5 5.5 0.796169217 0.828402367
16 5 5.5 1.408222676 0.708333333
17 5 5 1.478047839 0.681818182
18 15 15.14285714 2.611733064 0.515625
19 5 5 1.08715544 0.787878788
2 6 7.5 1.949137865 0.555555556
20 4 4 1.74741304 0.421052632
21 5 5 1.213971684 0.710144928
22 5 5 2.12833105 0.409090909
23 8 9.5 2.220490188 0.488372093
24 4 4 1.536534965 0.558139535
25 2 2 0.468995594 0.9
26 2 2 1 0.5
27 3 3 0.776973436 0.84375
28 3 3 1.040852083 0.75
29 1 1 0 1
3 4 4 0.938742551 0.817307692
30 7 7 1.405929659 0.729166667
31 2 3 1 0.5
32 13 23 0.972529102 0.819607843
33 20 21.42857143 0.619552663 0.876052501
34 19 21.5 0.70459438 0.863686534
35 32 36.5 0.79373888 0.848174387
36 5 5 2.321928095 0.2
37 3 6 1.584962501 0.333333333
38 4 4.5 1.186278124 0.75
39 5 6 1.492271866 0.666666667
4 25 27 3.093317501 0.384615385
40 7 10 1.899721832 0.6
41 2 2 0.886540893 0.695652174
42 3 3 1.298794941 0.625
43 2 2 0.503258335 0.888888889
44 3 3 0.803071727 0.833333333
45 1 1 0 1
46 4 7 1.79248125 0.5
47 4 4 0.955486022 0.811320755
48 4 4 1.321606958 0.705882353
49 8 8 0.823590875 0.840466926
5 9 9.25 0.906011896 0.813823857