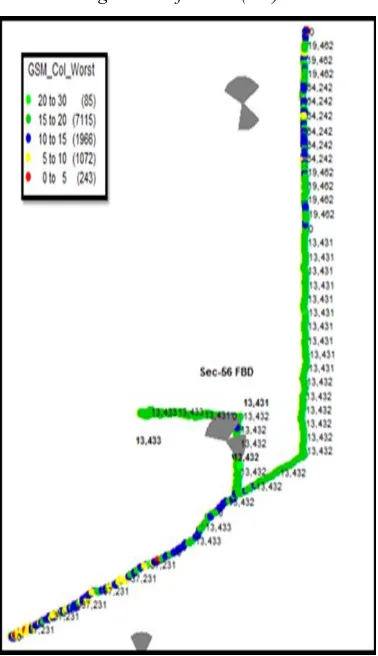
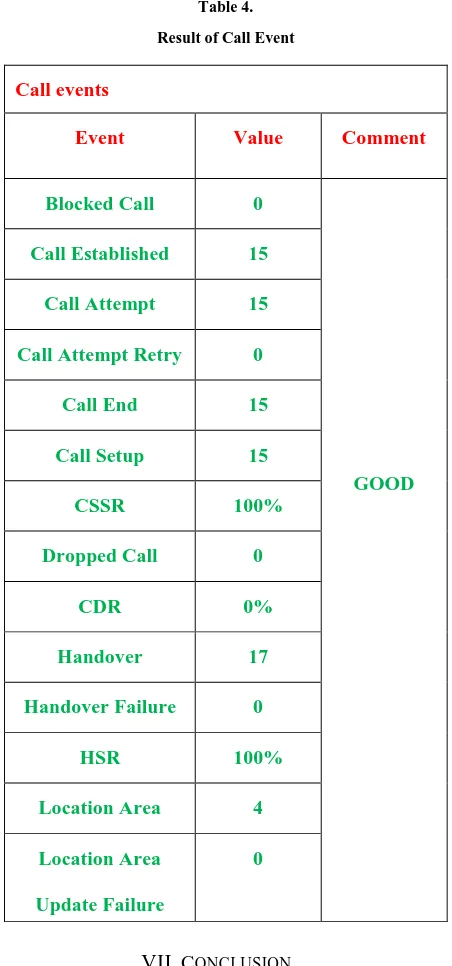
Case Study to Analysis GSM Network by Using 3G KPI Report
Full text
Figure
Related documents
• If a Practitioner has moved Firms or two or more Firms have merged or a Firm has dissolved in the preceding two years, the Practitioner should be cognisant of any relationships
Inasmuch as all mother trees from the natural forest in Southern Mindanao were identified through establishing field sample plots instead of prior information provided by seedling
As described in Section 7.2, the proposed model (i.e. MIMO-LSTM) can be utilised for short-term weather forecasting, and it yields more accurate results compare to the well-known
The study finds that the presence and variation of viscous dissipation parameter increases the velocity and temperature gradients leading to increase in volume
Our proposal is to reuse and adapt existing Information Architecture (IA) components to provide this overview to users and show that they can be generated automatically from
information being pushed out from the system of record, ensures that all data storage locations have the same information, based on the master copy.. This synchronization also
such difficulties may impact on musical learning, the development of motor skills using 92.. musical intervention has been successful (Montello & Coons, 1998; Schoemaker et al.,
It provides end-to-end functions of network business support, covering real-time service control, real-time rating & billing process, pricing, call detail record
