International Journal of Emerging Technology and Advanced Engineering
Website: www.ijetae.com (ISSN 2250-2459, ISO 9001:2008 Certified Journal, Volume 5, Issue 5, May 2015)
265
Spatial Mapping of Groundwater Quality using GIS
Danee Joycee.C.S
1, Helen Santhi.M
21Faculty of Building and Environment, Sathyabama University, Chennai, India
2School of Mechanical and Building Sciences, VIT University, Chennai Campus, Chennai, India
Abstract—Groundwater quality depends on the quality of recharged water, atmospheric precipitation and inland surface water. The groundwater quality is equally important as that of quantity. Assessing and monitoring the quality of groundwater is therefore, important to ensure sustainable safe use of these resources for the various purposes. The present study has been undertaken to analyze the physico-chemical parameters such as pH, electrical conductivity (EC), total dissolved solids (TDS), turbidity, dissolved oxygen (DO), total alkalinity (TA), total hardness (TH), Calcium (Ca2+), magnesium (Mg2+), Sodium (Na+), Potassium (K+),Sulphates (SO42-), Chloride (Cl) were analyzed (APHA, 1998) to know
the present status of the groundwater quality. The results were compared with standards prescribed by BIS 2003. The groundwater quality of 19 wells randomly distributed in Kanyakumari district, Tamil Nadu was selected for the present study. The spatial variation maps of major groundwater quality parameters were prepared. The results obtained gave the necessity of making the public, local administrator and the government to be aware on the crisis of poor groundwater quality prevailing in the area. The study helps us to understand the quality of the water as well as to develop suitable management practices to protect the groundwater resources.
Keywords—Groundwater Quality, physico-chemical, spatial map, Total dissolved solids, electrical conductivity.
I. INTRODUCTION
Groundwater is used for agricultural, industrial, household, recreational and environmental activities all over the world. In the last few decades, there has been a tremendous increase in the demand for fresh water due to rapid growth of population and the accelerated pace of industrialization. The quality of water is a vital ingredient for mankind as it is directly linked with human welfare. In India, most of the population is dependent on groundwater as the only source of drinking water supply [1].Determination of groundwater quality is significant in the field of water quality management due to its inconsistent variation with groundwater table, geological and soil conditions and contamination through percolation and seepage etc. The water quality assessment is mostly based on hydro chemical analysis. World Health Organization (WHO) published the guidelines for drinking water to protect public health [2].
The concentrations of naturally occurring chemicals, such as chloride, iron; manganese, sodium etc. are not of health concern at levels but affects the purity of drinking water. The quality of ground water may depend upon geology of a particular area, seasonal changes, composition of dissolved salts depending on the source and from soil surface interaction. These characteristics are mainly affected due to drastic pollution activities that occur on surface water [3]. In India, most of rural and urban areas depend on ground waters as their major water source. Based on the utility importance of ground waters their quality assessment came into effect [4]. It therefore becomes necessity to monitor the quality of groundwater regularly and to device ways and means to protect it. The objective of this study is to investigate qualitative analysis of some physicochemical parameters of groundwater and prepared the spatial variation of the parameters such as pH, TDS, TH, SO4, Cl etc. in the study area.
II. METHODOLOGY
The water samples were collected from 19 wells with in the study area and tested for physico-chemical parameters and are compared with the Permissible limits. The analysis of ground water samples were performed according to the procedure of APHA (1998) [5]. The major parameters namely pH, Electrical Conductivity (EC), Total Dissolved Solids (TDS), Total hardness (TH), Sulphates, Calcium , Magnesium , carbonates, bicarbonates and chlorides of the samples were analysed. The spatial and the attribute database generated are integrated for the generation of spatial variation maps of major water quality parameters like pH, Electrical Conductivity (EC), Total Dissolved Solids, Total hardness, Sulphates and Chlorine. Spatial interpolation technique through Inverse Distance Weighted (IDW) approach has been used in the present study to delineate the distribution of water pollutants. The spatial variation of the ground water quality parameters were studied using spatial analyst and Geo statistical analyst extensions modules of ArcGIS 10.2.
III. STUDY AREA
International Journal of Emerging Technology and Advanced Engineering
Website: www.ijetae.com (ISSN 2250-2459, ISO 9001:2008 Certified Journal, Volume 5, Issue 5, May 2015)
266
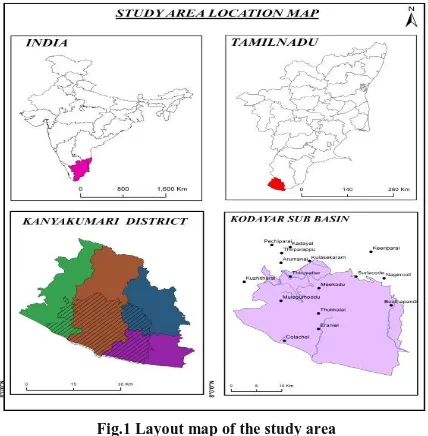
[image:2.612.60.274.285.503.2]The location map is shown in figure1.The climate of the area is sub-tropical and receives an annual average rainfall of about 1448.6 mm. It comes under the area bounded by Western Ghats in the north and Arabian Sea in the Southern west, Bay of Bengal in the East and Thirunelvelli district in the North east. The major land-use type in the study area are agricultural land which includes crop land, coconut and plantations, Forests land, waste land which includes land with and without shrub, barren rocky ,salt affected land and water logged areas, and settlement such as industrial, residential and settlement with vegetation etc. are identified.
Fig.1 Layout map of the study area
Geologically, the area is mostly dominated by granites of Archean age. The basic lithological units present in the study area are Alluvium-Fluvial, Aeolian, Fluvial-marine, Alluvium-marine, Khondalite group, Migmatite complex and Charnockite group. Coastal sand is seen in the entire coastal belt of the study area and above which Teri sand (Aeolian group) is found and over which coastal alluvium fluvial of quaternary age is present. North western part of the study area covers the Garnet-biotite gneiss of Archean age and the western pats of area covers Khondalite group of Archean age. Around 45% of the study area is covered by Charnockite group.
IV. RESULT AND DISCUSSIONS
The results of physicochemical parameter for the water samples collected from the study area and the test results are given in Table.1
A. pH
[image:2.612.361.521.317.504.2]The parameter pH generally indicates the acid or alkaline nature of any solution and usually does not bear any direct impact on consumers. The data revealed that the pH value is ranged from 6.5 to 8.5. The pH value of all the samples did not exceed the recommended limit (6.5-8.5) of BIS whereas the water samples were slight alkaline in characteristic .Spatial distribution of pH value in the study area is shown in Figure. 2. From the figure it is evident that the entire area covers the maximum value.
Fig. 2 pH variation map of the study area
B. Total Dissolved Solids (TDS)
International Journal of Emerging Technology and Advanced Engineering
Website: www.ijetae.com (ISSN 2250-2459, ISO 9001:2008 Certified Journal, Volume 5, Issue 5, May 2015)
267
TABLE.1
Variations of Physico-Chemical Parameters during the study period
Sample
location TDS NO3 Ca Mg Na K Cl SO4 CO3 HCO3 F pH EC TH
SW1
1085 28 60 114 154 51 234 58 0 579.50 0.44 7.8 1990 620
SW2
46.9 3 4 4.86 1 5 7 1 0.04 14.95 0.14 7.4 70 30
SW3
257 13 16 8.51 55 5 96 12 0.04 14.94 0.15 7.5 410 75
SW4
167 2 18 15.8 15 11 39 11 0.44 74.53 0.17 7.8 300 110
SW5
328 4 34 12.2 69 4 78 35 3.75 126.09 0.17 8.5 560 135
SW6
449 1 32 19.4 117 2 35 27 5.06 339.86 0.92 8.2 820 160
SW7
990 44 80 43.7 186 24 425 9 0 54.90 0.16 6.9 1630 380
SW8
483 13 32 20.7 101 18 138 40 0.18 119.81 0.37 7.2 830 165
SW9
229 4 16 9.72 51 5 96 4 0.03 44.97 0.09 6.8 390 80
SW10
145 8 4 2.43 39 7 43 1 0.01 19.99 0.09 6.5 200 20
SW11
513 36 14 10.9 124 17 170 4 0 24.40 0.29 6.8 730 80
SW12
141 1 14 9.72 20 8 46 7 0.02 49.97 0.12 6.7 250 75
SW13
319 4 40 17 53 3 85 32 1.12 118.83 0.15 8 570 170
SW14
955 25 68 63.2 175 18 326 65 0 256.20 0.17 8.2 1640 430
SW15
547 9 44 23.1 124 5 167 36 6 207.40 0.29 8.5 970 205
SW16
450 28 36 8.51 101 1 131 12 0.88 59.04 0.18 8.2 690 125
SW17
356 10 42 4.86 83 1 74 11 3.69 156.19 0.54 8.4 600 125
SW18
505 2 34 25.5 129 4 57 19 12 433.10 0.29 8.5 920 190
SW19 187 1 16 17 37 1 21 14 1.83 123.09 0.37 8.2 340 110
SW20 201 8 20 3.65 41 8 39 19 0.05 54.94 0.21 7 310 65
Minimum 46.9 1 4 2.43 1 1 7 1 0 14.94 0.09 6.5 70 20
Maximum 1085 44 80 114. 186 51 425 65 12 579.5 0.92 8.5 1990 620
Water with TDS less than 300 mg/L is desirable for dyeing of cloths and the manufacture of plastics, pulp paper, etc. [6]. The total concentration of dissolved minerals in water is a general indication of the over-all suitability of water for many types of uses.
International Journal of Emerging Technology and Advanced Engineering
Website: www.ijetae.com (ISSN 2250-2459, ISO 9001:2008 Certified Journal, Volume 5, Issue 5, May 2015)
268
The TDS values of present investigation are within the Standard limit. Water contains less than 500 mg/L of dissolved solids; it is generally satisfactory for domestic use and for many industrial purposes[7].
Fig.3 TDS map of the area
If the Water with more than 1000mg/L of dissolved solids usually gives disagreeable taste or makes the water unsuitable in other respects. The spatial distribution is shown in Figure.3.
C. Electrical Conductivity (EC)
The Electrical Conductivity (EC) was classified in to five ranges of < 500 (µS/cm), 500-1000 (µS/cm), 1000-1500 (µS/cm), 1000-1500-2000 (µS/cm) and >2000 (µS/cm). The minimum value of 70 (µS/cm) and the maximum value of 1989 µS/cm were observed in the study area. The spatial variation map for Electrical Conductivity (EC) was prepared and resented in Figure 4. From the map it has been observed that very small portion of the study area; the EC value exceeds the maximum limit of 1500 µS/cm. Three samples (SW1, SW7, and SW14) collected from Kochuthuparai, Kaliyakkavilai and Rajakkamangalam are observed high range of EC value greater than the maximum permissible value of 1500. Major portion of the area lies between the ranges from 1000µS/cm to 1500µS/cm.
D. Total Hardness (TH)
Hardness in water is caused primarily by the presence of carbonates and bicarbonates of calcium and magnesium, Sulphates, chlorides and nitrates. TH is to be used for domestic, industrial or agricultural purposes. The Total hardness was classified in to three ranges (0-300 mg/l, 300-600 mg/l and >300-600 mg/l) and based on these ranges the spatial variation map for total hardness has been obtained and presented in Figure. 5. From the map it was observed that for major areas, the total hardness value falls in the desirable limit (< 300mg/l). In the present study area the ranges of TH values are in the range of 20mg/l to 620mg/l were observed.
Fig.4 Electrical conductivity map of the study area
E. Chlorides
International Journal of Emerging Technology and Advanced Engineering
Website: www.ijetae.com (ISSN 2250-2459, ISO 9001:2008 Certified Journal, Volume 5, Issue 5, May 2015)
269
Fig.5 Total Hardness map of the study area
The maximum contaminant level (MCL) for chloride in drinking water is given as 250 mg/L by the WHO standards. In the present study except sample 7 and 14 remaining samples falls within the highest desirable amount of 250mg/l. The chloride concentration was recorded maximum of 425 mg/l in sample 7(SW7) and minimum 7 mg/l in the sample No. 2(SW2). The average concentration of the chloride was found to be 115 mg/l. The spatial variation of the area indicates that most of the central portion falls within the range of 7 to 250mg/l and the map is shown in Figure .6.
Fig.6 Spatial variation of Sulphates in the study area
F. Sulphates
Sulphates occur in natural waters at concentration up 50 mg/l and concentration of 1000 mg/l can found in water having contact with certain geological formations such as pyrite, lignite and coal [12]. Sulphates are naturally occurring element result from leaching of gypsum and other common minerals. Maximum Sulphates concentration is found in the range of 70 mg/l and a minimum of 1 mg/L. The recommended BIS limit for Sulphates in drinking water is 150 mg/L and all the samples fall within the permissible limit. The spatial variation map of study area is shown in Figure.7
G. Calcium Hardness
Calcium (Ca) is from natural sources like granitic terrain which contains large concentration of these elements Ca is within the permissible limits of 75 mg/l except one station where it is exceeding the permissible limit. Ca is ions of total hardness and hence they are interrelated. The study clearly indicates that Ca hardness is less than 75 to above 150. The maximum level of calcium occurred in the sample 7 in the range of 80mg/l and the minimum value occurred 4mg/l in sample 10.
Fig.7 Spatial variation of Chlorides in the study area
H. Magnesium Hardness
International Journal of Emerging Technology and Advanced Engineering
Website: www.ijetae.com (ISSN 2250-2459, ISO 9001:2008 Certified Journal, Volume 5, Issue 5, May 2015)
270
Magnesium is considered to be an essential metal at lower concentrations whereas it becomes toxic when it is at higher range and also gives unpleasant taste in the drinking water. The study clearly indicates that Mg hardness is less than 150 to less than 350.
I. Nitrate (NO3)
Groundwater contains nitrate due to leaching of nitrate with the percolating water. Groundwater can also be contaminated by sewage and other wastes rich in nitrates. The major source of nitrate in ground water is due to excessive use of nitrogenous fertilizers, sewage, plant and animal matters etc and nitrate at higher levels in the drinking water may cause adverse effects on human and animal health [13]. The nitrate content in the study area varied in the range 1.0 mg/L to 44 mg/L and found within the prescribed limit.
J. Potassium (K+)
The major source of potassium in natural fresh water is weathering of rocks but the quantities increase in the polluted water due to disposal of waste water .Potassium content in the water samples varied from 1mg/L to 50 mg/L.
K. Sodium (Na+)
Sodium concentrations were found in between 83mg/L to 129 mg/L. Sodium concentrations values for all the investigated samples were found within the prescribed limit.
V. CONCLUSION
From the water quality analysis of water samples collected from various locations within study area, it is observed that the parameters like total hardness, pH, Ca, Mg, NO3, Cl, K, etc. lie within the permissible limit
prescribed by WHO[14] and BIS[15] quality standards for drinking water. The spatial maps were prepared based on the above results to reflect the major parameters such as pH, Electrical Conductivity (EC), Total Dissolved Solids, Total hardness, Sulphates and Chloride using GIS approach.
The study thus concludes that water qualities within
the study area are found to be safe for drinking and
other purposes.
REFERENCES
[1] Ramakrishnaiah C.R. et al,2009, Assessment of Water Quality Index for the Groundwater in Tumkur Taluk, Karnataka State, India, E-Journal of Chemistry . 6(2), 523-530.
[2] Rizwan Reza and Gurdeep Singh,2009,” Physico Chemical Analysis of Ground Water in AngulTalcher Region of Orissa, India”, Marsland Press, Journal of American Science, 5(5),53-58 .
[3] Jameel, Evaluation of drinking water quality in Thiruchirapalli, Ind. J. Environmental. protection., 44(2), 108–112 (2002)
[4] Rajmohan N., Elango L., Ramachandran S. and Natarajan, 2002. Major ion correlation in groundwater of Kancheepuram region, South India, Ind. J. Env. Health, 45(1), 1-5)
[5] APHA, Standard methods for the examinations of water and wastewater, American Public Health Association, Washington, DC, 1998, 18th Ed.
[6] Durfor C.N. and Becker E., 1964. Public water supplies of the 100 largest cities in the United States, U.S. Geological Survey Water-Supply Paper, 1812, 364 .
[7] Sridhar.N , Poongothai.S and Ravisankar.N, 2014, ” Spatial Analysis of Groundwater Quality for Tarangabadi Taluk, Nagappatinam District, Tamilnadu using GIS”, International Journal of Emerging Technology and Advanced Engineering.
[8] Fetter CW (1999). Contaminant Hydrogeology. Prentice-HallEnglewood Cliffs, NJ.
[9] Shanthi K, Ramaswamy K, Pramalsamy P (2002). Hyderobiological study of Signanallur taluk, at Coimbatore, India, Nature Environ. Pollut. Technol., 1(2): 97-101.
[10] Shivakumar R, Mohanraja R, Azeez PA (2000). Physico-chemical analysis of water source of Ooty, South India. Pollut. Res., 19(1): 143-146.
[11] Hari Haran AVLNSH (2002). Evaluation of drinking water quality at Jalaripeta village of Visakhapatnam district, Andra Pradesh. [12] .N.Karthikeya.N.,A.Saranya,.A and Dr.M.C.Sashikkumar,2013
“Spatial analysis of groundwater quality for Virudhunagar district, Tamilnadu using GIS’, IJRSG,Volume 2, Issue 4, July (23-26) [13] Mohammed, A. G and Nur,A.,2-13, ”Physicochemical analysis of
groundwater samples Of gwoza town and environs, northeastern Nigeria”, International Journal of Research In Earth & Environmental Sciences, Vol 1,No (1).