International Journal of Emerging Technology and Advanced Engineering
Website: www.ijetae.com (ISSN 2250-2459,ISO 9001:2008 Certified Journal, Volume 5, Issue 5, May 2015)
60
Ductile Failure of Concrete Beam Reinforced with GFRP
Rafik K. Abd-ELwahab
1, Ahmed S. Elamary
2,31Lecturer , Al-Azhar University, Department of Civil Engineering, Qena, Egypt.
2Assistant Professor, Al-Azhar University, Department of Civil Engineering, Qena, Egypt.
3
Associated Professor, Taif University, Department of Civil Engineering, Taif, K.S.A. (Temporary)
Abstract— The objective of this study is to present the effectiveness of usage glass fiber reinforced polymer (GFRP) as reinforcement bars in concrete beams. This paper presents results of an experimental and analytical study on the behavior of centrally loaded beams reinforced with GFRP or steel bars. A set of experimental and analytical studies was carried out to evaluate the performance of GFRP bars bonded on concrete in simply-supported beams. Three groups of simply-supported beams subjected to a centrally concentrated load were studied experimentally. The first group was plain concrete beams, the second concrete beams reinforced using GFRP, and the third group was concrete beams reinforced with steel bars. Nonlinear finite element simulations were executed using ANSYS software package. According to the comparison between the theoretical and experimental beams vertical deflection and beams cracks shape an acceptable accuracy of the model was observed. This was followed by a parametric study using the calibrated model. The parametric study was carried out to evaluate the range of GFRP ratio which controls the ductile failure mechanism.
Keywords—Balanced Ratio; GFRP Bars; Beam Ductility; Finite Element Analysis.
I. INTRODUCTION
Fiber reinforced polymers (FRP) have recently been introduced into the construction market in various applications: rebars for concrete reinforcement, tendons for prestressed concrete, bolts for grouted anchors and more. In all the applications, the composite technology is used to produce a material that is as strong as steel, durable- with high resistance to aggressive environment, high strength to weight ratio and easy for handling and installation. Fiber reinforced polymer (FRP) applications in the structural engineering field involve concrete-FRP composite systems, where FRP components are attached to or embedded into concrete structures to improve their structural performance. Reinforced concrete beams are commonly used in the majority of reinforced concrete structures, which might be subjected to water leakage and the application of deicing salts. The use of the corrosion free fiber-reinforced polymer (FRP) reinforcing bars in such structures is beneficial to overcome the steel-corrosion problems.
International Journal of Emerging Technology and Advanced Engineering
Website: www.ijetae.com (ISSN 2250-2459,ISO 9001:2008 Certified Journal, Volume 5, Issue 5, May 2015)
61
Significant research has been devoted to beams and columns retrofitted with FRP and numerous models were proposed. Some of it in the strengthening of steel structures, where carbon FRP is preferred to glass FRP due to its much higher elastic modulus and strength. The critical difference between concrete and FRP-to-steel bonded interfaces is that the concrete is usually the weak link in the former, while in the latter the adhesive is the weak link. Failure at the steel/adhesive and FRP/adhesive interfaces can be avoided by careful selection of the adhesive and appropriate surface preparation of the steel and FRP [10]. Avoiding adhesive failure has been addressed in a separate study [11]. Different test methods for bonded joints have been used by different researchers [12]. The bond performance of sand-coated glass fiber-reinforced polymer (GFRP) bars into geopolymer concrete with a compressive strength of 33 MPa was investigated under a direct pullout test. The effects of parameters such as bar diameter (12.7, 15.9, and 19.0 mm) and embedment length (5, 10, and 15 d b , where d b is the bar diameter) were evaluated. The results showed that the maximum average bond stress obtained is around 23 MPa. As GFRP bar diameter increases, the average bond stress decreases. The specimens with shorter embedment length failed because of pullout of the bars, whereas those with longer embedment lengths failed because the concrete split. The results further revealed that the geopolymer concrete reinforced with GFRP bars have a bond strength similar to that of steel-reinforced geopolymer concrete. Finally, bond-slip models for the ascending branch up to maximum bond stress of the bond-slip curves for GFRP bars and geopolymer concrete were proposed. [13]. New approach that incorporates the effects of temperature, design life, and relative humidity (RH) of exposure into the environmental reduction factor (RF) for glass fiber reinforced polymer (GFRP) bars used as concrete re-inforcement. By using time extrapolation and time-temperature shift approaches, a new equation for design strength of GFRP bar under various exposure time and temperature was proposed [14]. Eight beams, including two control beams reinforced with only steel or only GFRP bars, were tested. The amount of reinforcement and the ratio of GFRP to steel were the main parameters investigated experimentally and theoretically. Hybrid GFRP/steel-reinforced concrete beams with normal effective reinforcement ratios exhibited good ductility, serviceability, and load carrying capacity.
Comparisons between the experimental results and the predictions from theoretical analysis showed that the models they adopted could adequately predict the load carrying capacity, deflection, and crack width of hybrid GFRP/steel-reinforced concrete beams [15]. The local bond mechanics of glass-fiber reinforced polymer (GFRP) bars in normal strength concrete was investigated through experimental testing and analytical modeling. The experimental program was comprised of 30 direct tension pullout specimens with short anchorages. Parameters considered were the bar roughness and diameter, the size effect expressed by the constant cover to bar diameter ratio, and the external confining pressure exerted over the anchorage length by transverse externally bonded FRP sheets. An analytical model of the bond stress-slip response of a GFRP bar was derived from first principles and calibrated against the test data of them investigation. Using the calibrated model, design values for bond and slip were estimated with reference to the code limit state model for bond [16]. This paper presents an experimental study on the behavior of reinforced concrete beams under three points bending. These beams were reinforced using GFRP or steel bars. The main objective of this study is to evaluate the range of GFRP ratio which controls the ductile failure mechanism of concrete beams.
II.EXPERIMENTAL PROGRAM
A. Test Specimen Details
International Journal of Emerging Technology and Advanced Engineering
Website: www.ijetae.com (ISSN 2250-2459,ISO 9001:2008 Certified Journal, Volume 5, Issue 5, May 2015)
[image:3.612.74.537.157.393.2]62
Table 1 Details of tested beams
Series Beam
no.
fcu
N/mm2
Bottom As
Top Asc
Dim. of stirrups (mm)
Spacing between stirrups (cm)
Material of stirrups
Plain PC1 19 ---- --- --- --- ---
PC2 22 --- --- --- --- ---
GFRP FRP1 25 10*10 10*10 5*10 20 GFRP
FRP2 23 10*10 10*10 5*10 20 GFRP
Steel RC1 28 2 10 2 10 Dia. 6 20 Steel–6mm
RC2 30 2 10 2 10 Dia. 6 20 Steel–6mm
Fig. 1. Details of test specimens
B. Materials
The materials for the experimental program were procured locally wherever possible. This was to retain the regional flavor of materials and in situ casting practices. Commercially-available GFRP and steel bars were used. Ordinary locally-available Portland cement having a specific gravity of 3.15 was employed in the casting of the specimens. Locally-available sand having a fineness modulus of 2.54 and a specific gravity of 2.62 was used. Coarse aggregate of 30 mm maximum size having a fineness modulus of 7.94 and specific gravity of 2.94 was used. The average standard 28-days compressive strength of concrete cubes was approximately 25 MPa with a mix weight ratio of cement: sand: gravel: water at1:1.8:3.2:0.48. The glass fiber manufacturer provided three samples of GFRP from the common used.
Tensile tests conducted on these samples to determine their ultimate tensile strength, ultimate strain and modulus of elasticity 180 MPa, 3.5% and 10500 N/mm2 respectively.
C. GFRP Tensile Test and Test Results
[image:3.612.75.533.622.702.2]Three GFRP specimens were tested using tensile testing machine. The top end of the specimen was fixed by grips on the top cross-head of the machine while the bottom end was pulled down. A load was applied at a constant speed until failure of the specimen. Figure 2-b shows the load displacement curve for the three specimens. All the failures started with splitting and ended with rupture of the bar. Every bar split into different numbers and sizes of pieces. This might also be related to the type of coating.
Table 2
Properties of reinforcement
Properties Diameter of bars (mm)
6 10
Yield strength (fy) kg/cm2 3250 4711
Ultimate strength (fu) kg/cm2 4838 6875
International Journal of Emerging Technology and Advanced Engineering
Website: www.ijetae.com (ISSN 2250-2459,ISO 9001:2008 Certified Journal, Volume 5, Issue 5, May 2015)
[image:4.612.231.380.143.319.2]63
Fig. 2. Results of tensile test of GFRP specimens
D. Specimens, Instrumentation, and Test Procedures
Six concrete beams with a square cross-section of 200 × 200 mm and 1000 mm length were tested under three points loading. The effective span of the tested beams was 900 mm. The beam length was adjusted to keep a distance of 50 mm as a support from each side of the beam. All the patch loading tests were conducted in an Avery 1000 KN Beam Testing Machine. Each test girder was simply supported on rollers in notches and subjected to a central patch load applied via a steel bar of circular cross-section 30 mm diameter. All beams were tested at an age of 28 days. Mid-span deflection of the beam was measured using dial gauges with an accuracy of 0.01 mm. This dial gauge was placed on the beam’s bottom surface at mid-span. All data were recorded using Smart System installed in a PC. Test setup and loading conditions are shown in figure 3. The initial reading of the dial gauge was first recorded. The test began with application of the load to the target value incrementally. For the first step of loading, the load value was 2 kN, and the next steps were incremented by 1 kN until final collapse of the beam. The load was kept constant between two successive increments for about 1 minutes, to enable recording of the different readings and observing the cracks. All the experimental data were stored at predetermined steps and recorded at specific occurrences such as cracking and ultimate displacement. Mid-span deflections versus applied loads obtained from each beam are shown schematically in figure 3-b. The measured compressive strengths of concrete cubes at the date of testing are listed in table 1. Two different types of reinforcing steel were used to construct specimens having mechanical properties as listed in table 2.
The parameters fyand fu represent the yield and ultimate
strength of the reinforcement steel bars, respectively. The observed mode of failure of each girder was similar to the characteristic failure mode of concrete beams subjected to patch loading as shown in figures 3-a, c, and e. Plots of the applied load versus the central deflection of the loaded beam are shown in figures 3-b, d and f for tested beams. Load-displacement curve was plotted for each specimen, the plotted curves were approximately linear up 25–30% of the maximum test load; thereafter, the curves gradually become non-linear, due to initial cracks in the tension side of beams. Increased deflection beyond that corresponding to the maximum test load was accompanied by a gradual decrease in the resistance to load. At the end of each test the collapse appeared fully formed. The average experimental ultimate loads P for all tested beams PC, FRP and RC are recorded as 13, 18.5 and 91 kN respectively.
E. Test Observations and Results
International Journal of Emerging Technology and Advanced Engineering
Website: www.ijetae.com (ISSN 2250-2459,ISO 9001:2008 Certified Journal, Volume 5, Issue 5, May 2015)
64 0 2 4 6 8 10 12 14 16
0 0.2 0.4 0.6 0.8 1 1.2 1.4 1.6 1.8 2
Lo
a
d
-kN
Mid-Span Deflection (mm) PCB1
Expermintal - Beam PCB2
a. Pattern of cracks shape of failure for beam (PC) b. Mid-span deflection vs. applied load, PC
0 2 4 6 8 10 12 14 16 18 20
0 0.5 1 1.5 2 2.5 3 3.5 4
c. Pattern of cracks, shape of failure for beam (FRP) d. Mid-span deflection vs. applied load, FRP
0 10 20 30 40 50 60 70 80 90 100
0 2 4 6 8 10 12
Mid-Span Deflection (mm)
Lo
a
d
-kN
[image:5.612.90.528.126.622.2]International Journal of Emerging Technology and Advanced Engineering
Website: www.ijetae.com (ISSN 2250-2459,ISO 9001:2008 Certified Journal, Volume 5, Issue 5, May 2015)
65
III. FINITE ELEMENT ANALYSIS
A.General
This study used finite element (FE) analysis by performing a numerical model representing full-sized beams tested at the Research Building Centre in Giza, Egypt. The boundary conditions of the FE model aimed to simulate the actual boundary conditions of the tested beams. The load applied at the top of the beam in one position as a concentrated line load was similar to the load condition applied in the test as shown in figure 4-a. The out of plane displacement of the loaded points were restrained to prevent any lateral torsional effect. A three dimensional solid finite element model was constructed using the ANSYS finite element software. This program provides a dedicated three dimensional eight node solid isoparametric element, Solid65, to model the nonlinear response of brittle materials based on the constitutive model for the triaxial behavior of concrete (ANSYS Manual 2013). The element includes a smeared crack analogy for cracking in tension zones and a plasticity algorithm to account for the possibility of concrete crushing in compression zones. Each element has eight integration points at which cracking and crushing checks are performed. The element behaves in a linear elastic manner until either of the specified tensile or compressive strengths is exceeded. Cracking or crushing of an element is initiated once one of the element’s principal stresses, at an element’s integration point, exceeds the tension or compressive strength of the concrete. Cracked or crushed regions, as opposed to discrete cracks, are then formed perpendicular to the relevant principal stress direction with stresses being redistributed locally.
The amount of shear transfer across a crack can be varied between full shear transfer and no shear transfer (0.0) at a cracked section. The smeared stiffness and strut modeling options allow the elastic-plastic response of the reinforcement to be included in the simulation at the expense of the shear stiffness of the reinforcing bars. In this case the reinforcement modeled using strut elements is Link8. These elements are embedded in the mesh of Solid65 elements and the inherent assumption is that there is a perfect bond between the reinforcing bars and the surrounding concrete. A linear elastic perfectly plastic material law, described by the elastic modulus of the yield strength and post-yield stiffness of the material, was used for these elements. Dummy PIPE16 pipe elements were used to ―line‖ the constraint equation region to provide the necessary rotational degrees of freedom at the nodes.
B.Model Verification
Figure 4-a shows the FE models executed for the three beams to verify the performance of the model. Mid-span deflection versus applied load curves obtained from the FE models of PC2, FRP2, and RC2 are plotted in figures 4-b, c, and d respectively and compared with the experimental results. The comparisons shown in these figures confirm that the FE models can represent the beams to an acceptable degree of accuracy. Based on these models parametric analyses were conducted to point out the effect of GFRP and/or steel bars on flexural behavior of concrete beams.
0 2 4 6 8 10 12 14 16
0 0.2 0.4 0.6 0.8 1 1.2 1.4 1.6 1.8 2
PCB2 PCB1 FEM
Lo
a
d
-kN
Mid-displacement - mm F.E.Model
Expermintal - Beam PCB2
a. Finite element model—Boundary conditions b. Experimental and FE model results—PC beams
Load line
GFRP bars
Support BC Longitudinal bars
[image:6.612.82.540.510.674.2]International Journal of Emerging Technology and Advanced Engineering
Website: www.ijetae.com (ISSN 2250-2459,ISO 9001:2008 Certified Journal, Volume 5, Issue 5, May 2015)
66 0 2 4 6 8 10 12 14 16 18 20 22
0 0.5 1 1.5 2 2.5 3 3.5 4
FRB1 FRB2 FEM
F.E.Model Lo a d -kN
Midspan deflection (mm) Expermintal - Beam FRB2
0 10 20 30 40 50 60 70 80 90 100
0 2 4 6 8 10 12
RCB1 RCB2 FEM
Lo
a
d
-kN
Mid-displacement - mm F.E.Model
Expermintal - Beam RCB2
[image:7.612.83.544.121.305.2]c. Experimental and FE model results—GFRP beams d. Experimental and FE model results—RC beams Fig. 4. Comparison between experimental and FE model results
IV. PARAMETRIC ANALYSES
A.Introduction
Since seismic design is one of the most critical design processes, elastic deformation, is generally quantified by ductility parameters and energy dissipation capacity. Consequently, this study will also spot a part from it on effect of GFRP on ductility index. For long-period structures, it has been stated that ductility is directly related to the strength reduction factor used in most codes to calculate the seismic base shear [17]. Deflection ductility index is defined as the ratio of ultimate deflection to yield deflection. The energy dissipation capacity is an important parameter in the design of short-period structures and structures subjected to a long-duration earthquake. For simplicity the energy dissipation can be defined by the area under the load deflection curve up to 80% of ultimate strain. The effect of GFRP bars ratio on the ultimate load and ductility of a concrete beam was studied in this paper. It is possible to assess the effect of each variable graphically from figure 5 to figure 7. To quantify the response of the beams, it is desirable to define response indexes that quantitatively describe the beams’ behavior. In this investigation the ductility index and the ultimate force achieved will be used as one of the bases of comparing the flexural behavior of the analyzed beams. Consequently, the results comparison for each parameter will be concerned with the ductility factor and energy dissipation.
Before starting these analyses, it should be mentioned that, since there isn’t any information available about the maximum allowable percentage of main GFRP bars for reinforced concrete beams, the maximum allowable was calculated using the percentages stated in the Egyptian code for beams with steel reinforcement bars ( [17], Table 4-1). This percentage is based on the yield and ultimate strength of the main reinforcement corresponding to steel yield of 360 MPa (5 E-4 * fcu) in this case where the maximum percentage
shown in the aforementioned table relates to the minimum yield and ultimate strength is 8.56 E-4 * fcu.
%
25
.
1
25
*
10
*
5
4max
(1)' , max , max
, s sbottom
sd
A
A
A
(2)
max , '
,top
*
sds
A
A
(3) '
, '
,top sbottom
s
A
A
(4) max , max , max, s
*
sdsd
A
A
A
(5)
1
max , max , s sdA
A
(6)
1
sec)
.
(
max max ,rft
Singly
for
d (7)By assuming α = 0.5
%
5
.
2
1
25
.
1
max ,
[image:7.612.316.548.463.679.2]International Journal of Emerging Technology and Advanced Engineering
Website: www.ijetae.com (ISSN 2250-2459,ISO 9001:2008 Certified Journal, Volume 5, Issue 5, May 2015)
67
0 2 4 6 8 10 12 14 16 18 20 22 24 26 28 30
0 0.5 1 1.5 2 2.5 3
G 4%
Lo
a
d
-kN
Midspan deflection (mm) Control FEM - G 0.5%
G 2.5%
G 1.25%
G 1%
Reference Load Limit
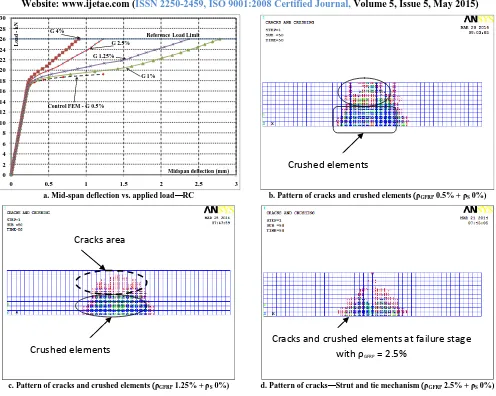
a. Mid-span deflection vs. applied load—RC b. Pattern of cracks and crushed elements (ρGFRP 0.5% + ρS 0%)
[image:8.612.56.552.121.517.2]c. Pattern of cracks and crushed elements (ρGFRP 1.25% + ρS 0%) d. Pattern of cracks—Strut and tie mechanism (ρGFRP 2.5% + ρS 0%)
Fig. 5. Crack patterns and shapes of failure
B. Effect of GFRP Longitudinal Main Bars Ratio
In this part of the parametric study, the effect of GFRP longitudinal bars ratio (ρGFRP) on the behavior of reinforced
concrete beams was studied. The analyses were performed for beams with an area of GFRP bars (AG) of 100, 200, 250,
500 and 800 mm2 equivalents to ρGFRP equaling 0.5%, 1%,
1.25%. 2.5% and 4% from concrete beam cross section area respectively. The relation between the total applied load and the measured mid-span deflection for the five analyzed beams are illustrated in figure 5-a. The behavior of such beams was studied under applied reference loads equaling 26 kN. The comparison shows that increasing the ρGFRP
decreased the ductility index due to increase in the yield deflection position corresponding to increase in the ultimate deflection where the ultimate load capacity increased significantly.
Figures 5-b, c, and d show the crushed and cracked elements and the end of load steps where behavior of four beams during the loading process was similar. These can be summarized as follows: At low load values, below the cracking load, the entire concrete section is effective in resisting compression and tension stresses. In addition, since the longitudinal bottom reinforcement bars deform by the same amount as the concrete, it will contribute to carrying the tension stresses. By increasing the applied load value tension cracks start to develop. At the locations of the cracks, the concrete does not transmit any tension forces and the reinforced bars are placed in the tension zone to carry all developed tensile forces below the neutral axis. Thus, only the compression force developed in the concrete is considered, and all the tension force is carried out by the reinforcement bars.
Crushed elements
Cracks area
Cracks and crushed elements at failure stage
with ρ
GFRP= 2.5%
International Journal of Emerging Technology and Advanced Engineering
Website: www.ijetae.com (ISSN 2250-2459,ISO 9001:2008 Certified Journal, Volume 5, Issue 5, May 2015)
68
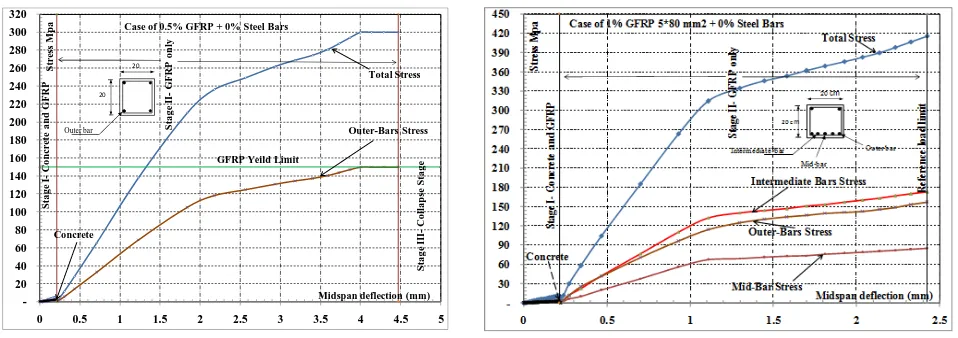
When the load is further increased, more cracks are developed and the neutral axis is shifted towards the compression zone. Consequently, the compression and tension forces will increase and the stresses over the compression zone will become nonlinear, which is indicated that, the beam section approaches the ultimate stage. In order to more thoroughly understand the benefits which can be gained from the bars’ arrangement, the total tensile force produced in the main longitudinal bars in beams are shown in figures 6-a, b, c and d. The contributions of each of these bars upon the total stress from by the bending moment action are different and depend on the number of bars. Figure 6-a shows the percentage of participation of each bar from the total tensile stress for a beam with two bars equivalent to ρGFRP 0.5%. Each bar in this case achieved a yield relevant to
a 4mm vertical deflection. Figure 6-b shows the percentage of participation of each bar from the total tensile stress for a beam with five bars with a total area equivalent to ρGFRP 1%.
Each bar in this case did not yield where the maximum stress achieved at reference load was 88 MPa. Figure 6-c shows the percentage of participation of each bar from the total tensile stress for a beam with five bars with a total area equivalent to ρGFRP 1.25%. Each bar in this case did not yield
where the maximum stress achieved at reference load was 72 MPa. Figure 6-d shows the percentage of participation of each bar from the total tensile stress for a beam with five bars with a total area equivalent to ρGFRP 2.5%.
Each bar in this case did not yield where the maximum stress achieved at reference load was 33 MPa. The recorded values of yield stress obtained for GFRP bars from tensile test was 150 MPa, The flexural strength of a concrete beam reinforced using 4% GFRP bars was studied, and it was noticed that cracks started to be recorded when the tensile stress of the concrete elements passed almost one tenth of the specified compressive strength. Strut and tie mechanism at the end of load steps, at reference load, showed significant decrease in the number of crushed elements. These elements were spread over one third of the beam depth as shown in figure 7-a. The crushed and cracked concrete elements spread over beam depth with an inclined angle almost equal to 49 degrees anticlockwise in the horizontal projection. The maximum load achieved at the end of the elastic stage was almost 19 kN as shown in figure 5-a. By studying the stress distribution in the concrete and GFRP bars, it was observed that the concrete elements which represent the bottom cover started to be crushed when the applied load value over the elements created tensile stress greater than concrete’s tensile strength. After that the GFRP sustained independently the applied tensile strength until the reference load where the maximum tensile stress recoded for each bar at reference load was 22 MPa.
-20 40 60 80 100 120 140 160 180 200 220 240 260 280 300 320
0 0.5 1 1.5 2 2.5 3 3.5 4 4.5 5
Total Stress
S
tr
es
s
M
p
a
Midspan deflection (mm) Concrete
Case of 0.5% GFRP + 0% Steel Bars
Outer-Bars Stress
GFRP Yeild Limit Outer bar
20 20
S
ta
g
e
I-C
o
n
cr
ete
a
n
d
G
F
R
P
S
ta
g
e
II
-G
F
R
P
o
n
ly
S
ta
g
e
II
I-C
o
ll
a
p
se
S
ta
g
e
[image:9.612.68.547.440.609.2]International Journal of Emerging Technology and Advanced Engineering
Website: www.ijetae.com (ISSN 2250-2459,ISO 9001:2008 Certified Journal, Volume 5, Issue 5, May 2015)
69
-20 40 60 80 100 120 140 160 180 200 220 240 260 280 300 320 340
0 0.5 1 1.5 2 2.5
Total Stress
S
tr
es
s
M
p
a
Midspan deflection (mm) Concrete
Case of 1.25% GFRP + 0% Steel Bars
Mid-Bar Stress
Outer-Bars Stress Intermediate Bars Stress Outer bar
Mid-bar
20 cm
20 cm
Intermediate -bar
S
ta
g
e
I-C
o
n
cr
ete
a
n
d
G
F
R
P
S
ta
g
e
II
-G
F
R
P
o
n
ly
R
efe
re
n
ce
l
o
a
d
l
im
it
[image:10.612.76.547.84.293.2]c. Mid-span deflection vs. tensile stress (ρGFRP 1.25%+ ρS 0%) d. Mid-span deflection vs. tensile stress (ρGFRP 2.5%+ ρS 0%)
Fig. 6. Concrete tensile strength and bar axial stress versus mid span deflection
a. Pattern of cracks—Strut and tie mechanism b. Mid-span deflection vs. tensile stress Fig. 7. Behavior and analysis of RC beam reinforced using ρGFRP 4% and ρS 0%
V. CONCLUSIONS
This paper presented an experimental investigation conducted to study the behavior of six 200mm × 200mm × 1000mm concrete beams tested under central point loading. Two beams were reinforced using GFRP and two were reinforced with steel bars. Both types of reinforced beams were provided with rectangular stirrups made from the same material used in the longitudinal reinforcement of bottom bars. The following conclusions are drawn:
1-Ductile beam failure can be obtained when ratio between GFRP bar areas to concrete beam cross section area ranged from 1% to 2.5%.
2-By increasing the ρGFRP ratio in concrete beam over
the balanced ratio the ductility index decreased where the ultimate load beam capacity increased significantly.
3-The ultimate failure load for beams reinforced with steel reinforcement is 6 times the failure load of PC beams and about 4.5 times the failure load in GFRP beams.
4-The finite element model is capable to simulate the behavior of concrete beams reinforced by GFRP.
Notation
AG Area of longitudinal main GFRP bars.
A's, top Area of longitudinal top bars.
A's,bottom Area of longitudinal bottom bars balanced
with top bars.
As,max Maximum area of longitudinal singly
reinforced bars.
Asd,max Maximum area of longitudinal doubly
[image:10.612.73.546.319.496.2]International Journal of Emerging Technology and Advanced Engineering
Website: www.ijetae.com (ISSN 2250-2459,ISO 9001:2008 Certified Journal, Volume 5, Issue 5, May 2015)
70
b Nominal beam breadth.
d Nominal beam depth.
EG Modulus of elasticity of GFRP.
Es Modulus of elasticity of reinforcing steel.
f′cu Cube compressive strength of C. specimen.
fu Ultimate stress of reinforcing steel.
fy Yielding stress of longitudinal Reinf.
n Number of longitudinal reinforced bars.
α Percentage of top reinforcement to bottom
reinforcement.
μd,max Ratio of reinforcement in doubly R.C.S.
μmax Ratio of reinforcement in singly R.C.S.
ρGFRP Ratio of reinforcement GFRP bars R.C.S
ΡS Ratio of reinforcement steel bars in R.C.S.
REFERENCES
[1] Saadatmanesh, H. (1994). Fiber composites for new and existing structures. ACI Struct J, 91(3), 346–54.
[2] Karbhari, V. M. (2001). Material considerations in FRP rehabilitation of concrete structures. J Mater Civil Eng, 13 (2), 90– 97.
[3] Karbhari, V. M., and Zhao, L. (2000). Use of composites for 21st century civil infrastructure. Comput Meth Appl Mech Eng, 185, 433–54.
[4] Arduini, M., and Nanni, A. (1997). Parametric study of beams with bonded FRP reinforcement. ACI Struct J, 94 (5), 493–501. [5] Malek, A. M., Saadatmanesh, H., and Ehasani, M. (1998).
Prediction of failure load of R/C beams strengthened with FRP plate due to stress concentration at the plate end. ACI Struct J, 95 (1), 142–52.
[6] Sim, J., and Oh, H. (2005). Structural improvement of strengthened deck panels with externally bonded plates. Cement Concrete, Res, 35, 1420–9.
[7] Teng, J. G., Caob, S. Y., and Lama, L. (2001). Behaviour of GFRP-strengthened RC cantilever slabs. Constr Build Mater, 15, 339–49. [8] Saadatmanesh, H., and Malek, A. M. (1998). Design guidelines for
flexural strengthening of RC beams with FRP plates. J Compos Constr ASCE, 2(4), 158–64.
[9] Wang, Y. C., and Chen, C. H. (2003). Analytical study on reinforced concrete beams strengthened for flexure and shear with composite plates. J Compos Struct, 59, 137–48.
[10] Teng, J. G., Yu, T., and Fernando, D. (2009). FRP composites in steel structures. Proceedings of the Third International Forum on Advances in Structural Engineering. Shanghai.
[11] Teng, J. G., Fernando, D., Yu, T., and Zhao, X. L. (2010). Treatment of steel surfaces for effective adhesive bonding. Proceedings of the 5th International Conference on FRP composites in Civil Engineering (CICE). Beijing.
[12] Zhao, X. L., and Zhang, L. (2007). State-of-the-art review on FRP strengthened steel structures. Eng Struct, 29 (8), 1808–23. [13] Maranan, G., Manalo, A., Karunasena, K., and Benmokrane, B.
(2015). "Bond Stress-Slip Behavior: Case of GFRP Bars in Geopolymer Concrete." J. Mater. Civ. Eng., 27 (1).
[14] Huang, J. and Aboutaha, R. (2010). ‖Environmental Reduction Factors for GFRP Bars Used as Concrete Reinforcement: New Scientific Approach.‖ J. Compos. Constr., 14 (5), 479–486 March 2010.
[15] Qu, W., Zhang, X., and Huang, H. (2009).‖Flexural Behavior of Concrete Beams Reinforced with Hybrid (GFRP and Steel) Bars.‖J. Compos. Constr., 13(5), 350–359.
[16] Tastani, S. and Pantazopoulou, S. (2006).‖Bond of GFRP Bars in Concrete: Experimental Study and Analytical Interpretation.‖J. Compos. Constr., 10 (5), 381–391.
[17] Ministry of Housing, Utilities and Urban Communities. (2007). CCS 203-2001 Egyptian Code for Design and Construction of Concrete Structures. Giza, Egypt: Ministry of Housing, Utilities and Urban Communities.