R E S E A R C H
Open Access
Transcriptomic classification of genetically
engineered mouse models of breast cancer
identifies human subtype counterparts
Adam D Pfefferle
1,2, Jason I Herschkowitz
3, Jerry Usary
2,4, Joshua Chuck Harrell
2,4, Benjamin T Spike
5,
Jessica R Adams
6, Maria I Torres-Arzayus
7, Myles Brown
7, Sean E Egan
6,8, Geoffrey M Wahl
5, Jeffrey M Rosen
9and Charles M Perou
1,2,4*Abstract
Background:Human breast cancer is a heterogeneous disease consisting of multiple molecular subtypes. Genetically engineered mouse models are a useful resource for studying mammary cancersin vivounder
genetically controlled and immune competent conditions. Identifying murine models with conserved human tumor features will facilitate etiology determinations, highlight the effects of mutations on pathway activation, and should improve preclinical drug testing.
Results:Transcriptomic profiles of 27 murine models of mammary carcinoma and normal mammary tissue were determined using gene expression microarrays. Hierarchical clustering analysis identified 17 distinct murine subtypes. Cross-species analyses using three independent human breast cancer datasets identified eight murine classes that resemble specific human breast cancer subtypes. Multiple models were associated with human basal-like tumors including TgC3(1)-Tag, TgWAP-MycandTrp53−/−. Interestingly, the TgWAPCre-Etv6model mimicked the HER2-enriched subtype, a group of human tumors without a murine counterpart in previous comparative studies. Gene signature analysis identified hundreds of commonly expressed pathway signatures between linked mouse and human subtypes, highlighting potentially common genetic drivers of tumorigenesis.
Conclusions:This study of murine models of breast carcinoma encompasses the largest comprehensive genomic dataset to date to identify human-to-mouse disease subtype counterparts. Our approach illustrates the value of comparisons between species to identify murine models that faithfully mimic the human condition and indicates that multiple genetically engineered mouse models are needed to represent the diversity of human breast cancers. The reportedtrans-species associations should guide model selection during preclinical study design to ensure appropriate representatives of human disease subtypes are used.
Background
Breast cancer is the second leading cause of cancer-related deaths in American women [1]. While increased public awareness has led to earlier detection, a greater understanding of tumor biology has led to the develop-ment of many promising therapeutics [2,3]. A difficult frontier, however, has been identifying the appropriate
target population for new drug(s) as not all breast cancer patients will respond to a particular therapeutic. Cur-rently, only approximately 5% of oncology drugs that enter clinical testing are ultimately approved by the US Food and Drug Administration for use [4]. This low success rate reflects not only the difficulty of developing anticancer therapeutics, but also identifies flaws in preclinical testing methodology for selecting the most appropriate cancer patient subset for early clinical testing [5,6].
Numerous murine models of breast cancer have been created to mimic the genetic aberrations found in human tumors [7-30]. Historically, each model has been analyzed independent of other models, which complicates effective
* Correspondence:[email protected] 1
Department of Pathology and Laboratory Medicine, University of North Carolina, Chapel Hill, NC 27599, USA
2
Lineberger Comprehensive Cancer Center, University of North Carolina, Chapel Hill, NC 27599, USA
Full list of author information is available at the end of the article
comparisons with human tumors. However, when mul-tiple models are consolidated into a single dataset, there is increased sensitivity to detect features that are conserved with the human disease state [31,32]. Identifying murine models that faithfully mimic specific human breast cancer subtypes [33-35] is an important need for the proper in-terpretation of mouse model results, and thus for translat-ing preclinical findtranslat-ings into effective human clinical trials [36]. To address this need, we used a transcriptomic approach to profile tumors from 27 different genetically engineered mouse models (GEMMs). We define and characterize 17 distinct murine subtypes of mammary car-cinoma (referred to as classes herein to distinguish them from the human subtypes), which we compare to three human breast tumor datasets comprising over 1,700 pa-tients to determine which GEMM classes resemble spe-cific human breast cancer subtypes.
Results
Expression classes of genetically engineered mouse models
As the genetic aberrations of human breast cancers have been elucidated, murine models have been created to in-vestigate the specific role that these genes/proteins have on tumor phenotype. Since our initial comparative gen-omics study of 14 mouse models and normal mammary tissue [31], the number of breast cancer GEMMs in our database has roughly doubled to 27 (Table 1). To com-pare the transcriptomic diversity of these GEMMs, glo-bal gene expression measurements from 356 unique murine tumors and 16 normal murine mammary sam-ples were analyzed using Agilent microarrays (Table 1A, Figure 1; Table S1 in Additional file 1). Using this larger and more diverse murine dataset, a new mouse‘intrinsic gene list’ was derived to identify genes associated with all 27 models. As expected, many of the genes from the previous intrinsic gene list were also present in the up-dated list. After filtering for genes found in both data-sets, 76.5% (500/654) of the intrinsic probes from Herschkowitz et al.[31] were again included within the new intrinsic list of 1,855 probes (Table S2 in Additional file 1), which represents 1,841 genes.
To determine if new murine subtypes/classes exist in this expanded dataset, SigClust analysis [37] was per-formed using supervised hierarchical clustering of the 385 murine microarrays and the intrinsic 1,855 probe list (Figure 2). Murine‘classes’were defined as having at least five tumors with a SigClust P-value ≤0.01. Using these criteria, 17 murine classes were identified with 94% (363/385) of tumors being included within one of these classes (Figure 2B; Figure S1 in Additional file 2). The name for each class was determined based upon the major model contributor (for example, MycEx), the major biological feature (for example, Squamous-likeEx),
or both (for example, p53null-BasalEx), with the super-script ‘Ex’ designation used to denote that this is an expression-based class. As previously observed [31], the
Brca1+/− Trp53+/− irradiated, TgC3(1)-Tag,
TgMMTV-Neu, TgWAP-Int3, TgWAP-Myc, and TgWAP-Tag mur-ine models have‘homogeneous’gene expression patterns in this dataset; here, a model was considered ‘ homoge-neous’if ≥80% of tumors from that GEMM were found within a single expression-defined class (Table 1B; Figure S2 in Additional file 2). Many of the newest models also showed homogeneous gene expression patterns, includ-ing Stat1−/−, TgMMTV-Myc, TgMMTV-Wnt1/iFGFR2, and TgWAPCre-Etv6.
Other models showed a‘semi-homogeneous’gene ex-pression pattern, defined as ≥80% of tumors from a sin-gle GEMM being found within two classes. These includedPik3ca-H1047R, TgMMTV-Atx, TgMMTV-Fgf3, TgMMTV-Hras, TgWAP-T121, and TgMMTV-Wnt1.
Interestingly, while maintaining the TgMMTV-Wnt1
mouse colony, it was observed that there might be two types of tumors based on latency, namely early and late arising tumors. This observation was also reflected in the two TgMMTV-Wnt1expression classes that also differed by median tumor latency: Wnt1-EarlyEx (8.8 weeks) and Wnt1-LateEx (22.2 weeks) (Wilcoxon Rank SumP-value <0.001). Lastly, about 40% of mouse mammary tumor virus (MMTV) driven Wnt1 tumors have cooperative activation of fibroblast growth factor signaling [38], a phenotype that is known to decrease tumor latency [16], and consistent with this, 88% (7/8) of TgMMTV-Wnt1/ iFgfr2tumors in our dataset were also classified as Wnt1-EarlyEx.
The remaining models had ‘heterogeneous’ gene ex-pression patterns, which were defined as no two classes containing at least 80% of the tumors analyzed: Brg1+/−
(five classes), DMBA-induced (five),p18−/−(three),Rb1−/−
(five), TgMMTV-Aib1 (four), TgMMTV-Cre BrcaCo/Co Trp53+/−(three), TgMMTV-Lpa (four),Trp53−/−(seven), and Trp53+/− irradiated (four). Similar to recent reports [32], the Trp53−/− model (which is distinct from the
Trp53+/−irradiated model) was primarily defined by three murine classes in this analysis: p53null-luminalEx(27/58), p53null-basalEx(15/58), and Claudin-lowEx(7/58).
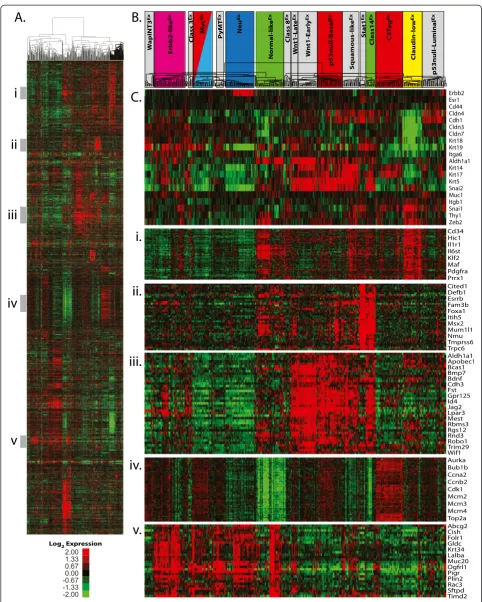
To begin investigating the defining features of these classes, a comparison of selected cell lineage markers was performed (Figure 2C). Several mouse classes highly expressed luminal cell markers (for example, Erbb2,
Esr1,Krt18, and/or Krt19), including Erbb2-likeEx, PyM-TEx, NeuEx, MycEx, and Stat1Ex. Other classes expressed basal cell cytokeratins (for example, Krt5, Krt14 and/or
Krt17), including Wnt1-LateEx, Wnt1-EarlyEx, p53null-BasalEx, Squamous-likeEx, Class14Ex, and C3TagEx. As identified previously [31], a murine Claudin-lowExclass was observed to be characterized by low expression of
Pfefferleet al. Genome Biology2013,14:R125 Page 2 of 16
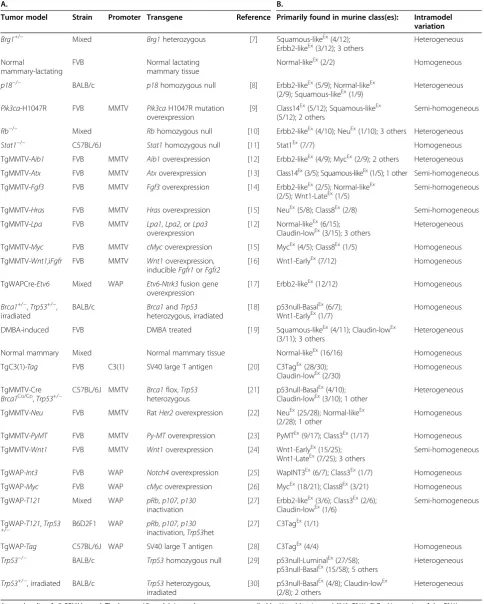
Table 1 Summary of murine models studied
A. B.
Tumor model Strain Promoter Transgene Reference Primarily found in murine class(es): Intramodel variation
Brg1+/− Mixed Brg1heterozygous [7] Squamous-likeEx(4/12);
Erbb2-likeEx(3/12); 3 others Heterogeneous
Normal
mammary-lactating
FVB Normal lactating
mammary tissue
Normal-likeEx(2/2) Homogeneous
p18−/− BALB/c p18homozygous null [8] Erbb2-likeEx(5/9); Normal-likeEx
(2/9); Squamous-likeEx(1/9) Heterogeneous
Pik3ca-H1047R FVB MMTV Pik3caH1047R mutation overexpression
[9] Class14Ex(5/12); Squamous-likeEx (5/12); 2 others
Semi-homogeneous
Rb−/− Mixed Rbhomozygous null [10] Erbb2-likeEx(4/10); NeuEx(1/10); 3 others Heterogeneous
Stat1−/− C57BL/6J Stat1homozygous null [11] Stat1Ex(7/7) Homogeneous
TgMMTV-Aib1 FVB MMTV Aib1overexpression [12] Erbb2-likeEx(4/9); MycEx(2/9); 2 others Heterogeneous
TgMMTV-Atx FVB MMTV Atxoverexpression [13] Class14Ex(3/5); Squamous-likeEx(1/5); 1 other Semi-homogeneous
TgMMTV-Fgf3 FVB MMTV Fgf3overexpression [14] Erbb2-likeEx(2/5); Normal-likeEx
(2/5); Wnt1-LateEx(1/5) Semi-homogeneous
TgMMTV-Hras FVB MMTV Hrasoverexpression [15] NeuEx(5/8); Class8Ex(2/8) Semi-homogeneous
TgMMTV-Lpa FVB MMTV Lpa1,Lpa2, orLpa3
overexpression
[12] Normal-likeEx(6/15); Claudin-lowEx(3/15); 3 others
Heterogeneous
TgMMTV-Myc FVB MMTV cMycoverexpression [15] MycEx(4/5); Class8Ex(1/5) Homogeneous
TgMMTV-Wnt1,iFgfr FVB MMTV Wnt1overexpression,
inducibleFgfr1orFgfr2
[16] Wnt1-EarlyEx(7/12) Homogeneous
TgWAPCre-Etv6 Mixed WAP Etv6-Ntrk3fusion gene
overexpression
[17] Erbb2-likeEx(12/12) Homogeneous
Brca1+/−,Trp53+/−, irradiated
BALB/c Brca1andTrp53
heterozygous, irradiated
[18] p53null-BasalEx(6/7);
Wnt1-EarlyEx(1/7) Homogeneous
DMBA-induced FVB DMBA treated [19] Squamous-likeEx(4/11); Claudin-lowEx
(3/11); 3 others
Heterogeneous
Normal mammary Mixed Normal mammary tissue Normal-likeEx(16/16) Homogeneous
TgC3(1)-Tag FVB C3(1) SV40 large T antigen [20] C3TagEx(28/30);
Claudin-lowEx(2/30) Homogeneous
TgMMTV-Cre
Brca1Co/Co,Trp53+/−
C57BL/6J MMTV Brca1flox,Trp53
heterozygous
[21] p53null-BasalEx(4/10); Claudin-lowEx(3/10); 1 other
Heterogeneous
TgMMTV-Neu FVB MMTV RatHer2overexpression [22] NeuEx(25/28); Normal-likeEx
(2/28); 1 other
Homogeneous
TgMMTV-PyMT FVB MMTV Py-MToverexpression [23] PyMTEx(9/17); Class3Ex(1/17) Homogeneous
TgMMTV-Wnt1 FVB MMTV Wnt1overexpression [24] Wnt1-EarlyEx(15/25);
Wnt1-LateEx(7/25); 3 others
Semi-homogeneous
TgWAP-Int3 FVB WAP Notch4overexpression [25] WapINT3Ex(6/7); Class3Ex(1/7) Homogeneous
TgWAP-Myc FVB WAP cMycoverexpression [26] MycEx(18/21); Class8Ex(3/21) Homogeneous
TgWAP-T121 Mixed WAP pRb,p107,p130
inactivation
[27] Erbb2-likeEx(3/6); Class3Ex(2/6);
Claudin-lowEx(1/6) Semi-homogeneous
TgWAP-T121,Trp53
+/− B6D2F1 WAP pRbinactivation,,p107,p130Trp53het [27] C3Tag
Ex(1/1)
TgWAP-Tag C57BL/6J WAP SV40 large T antigen [28] C3TagEx(4/4) Homogeneous
Trp53−/− BALB/c Trp53homozygous null [29] p53null-LuminalEx(27/58);
p53null-BasalEx(15/58); 5 others Heterogeneous
Trp53+/−, irradiated BALB/c Trp53heterozygous,
irradiated
[30] p53null-BasalEx(4/8); Claudin-lowEx (2/8); 2 others
Heterogeneous
multiple cell adhesion genes (Cldn3,Cldn4, and Cldn7) and high expression of epithelial-to-mesenchymal transi-tion genes (Snai1andZeb2), similar to the human claudin-low subtype [34].
Comparison of murine class defining gene sets versus human tumor subtypes
To specifically compare murine classes to human breast cancer subtype features, each murine class defining sig-nature (Figure 2i-v) was tested for differential expression across the human subtypes using the UNC308 dataset (Figure 3A-E) [34]. For example, the high expression signature that defines the murine Claudin-lowEx class (Figure 2i; including Hic1, Il6st, Klf2, Maf, Pdgfra,
Prrx1, Snai1) was also the most highly expressed in human claudin-low tumors (Figure 3A). Figure 2ii shows genes that are highly expressed in the newly identi-fied Stat1Exand Class14Exmurine classes, which show lu-minal characteristics (for example, Foxa1, Esrrb) and are the most highly expressed in human luminal A tumors (Figure 3B). While most of the GEMMs in this dataset are considered estrogen receptor (ER) negative, murine models comprising these two classes (Stat1−/−andPik3ca -H1047R, respectively) were often ERα+ [9,11], and these data suggest that they overall have a ‘luminal’expression profile. Interestingly, these classes cluster independent of the previously defined murine luminal models,
TgMMTV-Neuand TgMMTV-PyMT. Consistent with the individual cell lineage marker analysis, the Wnt1-LateEx, Wnt1-EarlyEx, p53null-BasalEx, Squamous-likeEx, and Class14Ex murine classes express a basal-like gene signature (Figure 2iii). As in human tumors, a proliferation sig-nature (Figure 2iv) further distinguishes these murine classes, with highest expression in murine C3TagEx and human basal-like tumors, and lowest expression in normal tissues from both species. This finding is
likely due to the loss of RB1 function in both human basal-like [39,40] and TgC3(1)-Tag murine tumors (due to T-antigen expression). Lastly, Figure 2v high-lights a gene cluster that is highly expressed in sev-eral murine classes, including Erbb2-likeEx, PyMTEx, and NeuEx; this signature was lower in normal mam-mary tissue, but highly expressed in the two lactating mammary samples (Figure 3E). Consistent with this observation, many of the genes in this signature are involved in alveolar function (for example, Abcg2,
Folr1, and Lalba).
For the dual purpose of validating our new classifica-tion system and for investigating the degree of diversity in our expanded dataset, the murine classes defined here were compared to those from Herschkowitz et al. [31] (Figure S3 in Additional file 2). The majority of the Herschkowitz et al. classes had one-to-one matching counterparts to those described here; however, two pre-vious groups (IX-WapTag and X-C3Tag) were combined into a single class in our dataset (C3TagEx). Importantly, several of the 17 murine classes defined here were not present within the 10 classes of Herschkowitz et al.
(Erbb2-likeEx, Class3Ex, Class8Ex, and Stat1Ex), almost all of which were populated by GEMMs that were new to this study.
Given the discovery of novel murine classes, it was of great interest to determine the degree to which this ex-panded murine dataset might better encompass the molecular diversity of the human subtypes. To directly compare tumors across species, this mouse and the pre-viously published UNC308 human datasets were nor-malized into a single expression dataset and hierarchical clustered using a combined mouse and human [41] in-trinsic gene list (Figure 4). While technical differences between the two datasets (for example, different micro-array platforms, different common references) may limit
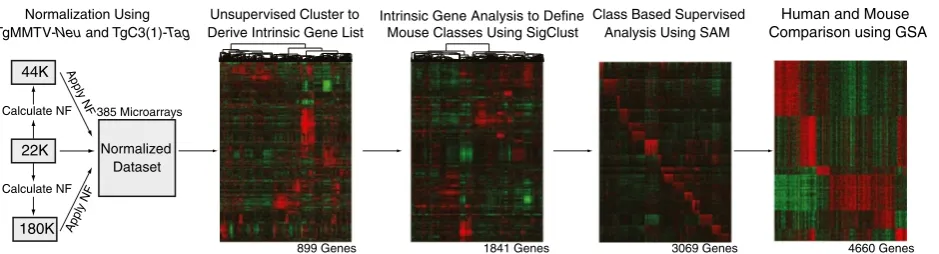
Normalization Using TgMMTV-Neu and TgC3(1)-Tag
Unsupervised Cluster to
Derive Intrinsic Gene List Mouse Classes Using SigClust
Intrinsic Gene Analysis to Define Class Based Supervised Analysis Using SAM
3069 Genes 1841 Genes
899 Genes 4660 Genes
Human and Mouse Comparison using GSA
22K 44K
180K Calculate NF
Calculate NF
Normalized Dataset 385 Microarrays
Apply NF
[image:4.595.67.537.537.664.2]Apply NF
Figure 1Flowchart of murine expression data analysis.Agilent microarrays from three different platforms were normalized and combined together to create a single murine expression dataset. Next, an unsupervised cluster analysis using variably expressed genes was performed to define a murine‘intrinsic gene list’. Third, this intrinsic list was used as part of a supervised cluster analysis to objectively define murine subtypes/ classes. Fourth, class based supervised analyses were used to define murine class specific lists (genes and pathways). Finally, supervised comparative analysis between human subtypes and mouse classes was used to identify and characterize human-mouse counterparts. NF, normalization factor. GSA, gene set analysis; SAM, Significance Analysis of Microarrays.
Pfefferleet al. Genome Biology2013,14:R125 Page 4 of 16
interspecies clustering, several across species dendrogram nodes were observed (Figure 4A). Interestingly, all major nodes contained a combination of human and mouse sub-types (Figure 4B), indicating a degree of similarity not only between specific corresponding tumor subtypes, but also globally across species. Most of the major intrin-sic gene sets driving the nodes are highlighted below
the dendrogram, including the basal (Figure 4C), pro-liferation (Figure 4D), normal breast (Figure 4E), claudin-low subtype high expression (Figure 4F), and luminal (Figure 4G) signatures. These clusters highlight the broad conserved intrinsic features between mouse and human tumors. For instance, most C3TagExtumors cluster with the basal-like subtype, an association that is driven in part
(See figure on previous page.)
[image:6.595.56.542.272.685.2]Figure 2Murine intrinsic class analysis. (A)Supervised cluster using the newly derived murine intrinsic gene list and all murine arrays in the dataset. Roman numerals next to the gray bars correspond to the enlarged regions in parts (i) to (v).(B)Dendrogram of the cluster from part(A) with the murine classes identified by SigClust highlighted. Classes with colored boxes have been determined to be human expression-based subtype counterparts.(C)Breast cancer genes and individual cell lineage marker expression profiles.(i)Claudin-low gene cluster.(ii)Luminal gene cluster.(iii)Basal gene cluster.(iv)Proliferation gene cluster.(v)Lactating gene cluster.
Figure 3Murine intrinsic cluster signatures according to tumor subtype.Standardized, average expression values for the dominant individual gene clusters from Figure 2i-v are shown according to the murine classes (left panels) and the human subtypes (right panels) using the human UNC308 human breast cancer dataset.(A)Murine claudin-low subtype defining gene set.(B)Murine luminal subtype gene set. (C)Murine basal-like subtype gene set.(D)Murine proliferation-associated gene set.(E)Murine lactation associated gene set.
Pfefferleet al. Genome Biology2013,14:R125 Page 6 of 16
by the high expression of the proliferation gene set [31], which is known to contain many E2F-regualted genes.
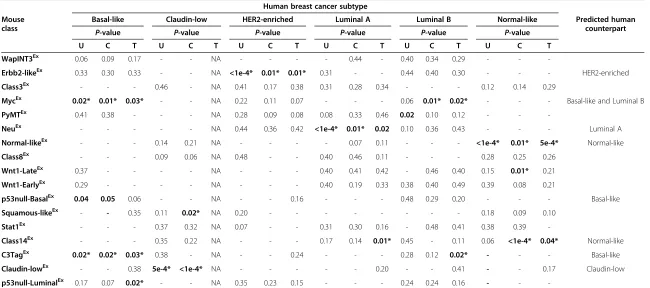
To more objectively validate thetrans-species associa-tions observed in Figure 4, similarity between specific human and mouse subtypes was measured using gene set analysis (GSA) (Table 2) [42]. Using this approach, a murine class was judged to be a strong human subtype counterpart if the human-to-mouse comparison was sta-tistically significant (P≤0.05) in at least two of the three human datasets analyzed (UNC308 [34], Combined855 [43], and TCGA547 [39]). As previously observed [31], the murine Normal-likeEx, C3TagEx, and Claudin-lowEx classes associate with the human normal-like, basal-like, and claudin-low subtypes, respectively. The new murine class, Erbb2-likeEx, was associated with the human HER2-enriched subtype across all three human data sets; this human breast cancer subtype did not associate with any previously characterized murine class [31], indicat-ing an increased ability for the current dataset to en-compass more of the major human intrinsic subtypes.
With this larger sample size, a link was also identified between the MycEx class and human basal-like breast cancer, which is consistent with multiple human studies linking basal-like breast cancers with cMYC amplifica-tion and expression signatures [39,44]. Interestingly, a connection between the MycExclass and human luminal B tumors was also identified, highlighting Myc activation as a potentially important etiological mechanism that is shared between these two aggressive human subtypes.
[image:7.595.60.539.346.687.2]Previously defined as a‘luminal’model [31], the NeuEx murine class associated with the human luminal A sub-type in this newest analysis; this correlation was some-what surprising given the lack of ERαand ERα-regulated gene expression in the murine NeuEx class, but does suggest that human luminal A tumors have many ERα -independent features. Although the murine p53null-BasalEx versus human comparisons were not significant after controlling for multiple comparisons, an almost consistent significant association was seen with human basal-like tumors (P-value = 0.04, 0.05, and 0.06) in all
Table 2 Gene set analysis of murine classes and human subtypes
Human breast cancer subtype
Mouse class
Basal-like Claudin-low HER2-enriched Luminal A Luminal B Normal-like Predicted human
counterpart
P-value P-value P-value P-value P-value P-value
U C T U C T U C T U C T U C T U C T
WapINT3Ex 0.06 0.09 0.17 - - NA - - - - 0.44 - 0.40 0.34 0.29 - -
-Erbb2-likeEx 0.33 0.30 0.33 - - NA <1e-4* 0.01* 0.01* 0.31 - - 0.44 0.40 0.30 - - - HER2-enriched
Class3Ex - - - 0.46 - NA 0.41 0.17 0.38 0.31 0.28 0.34 - - - 0.12 0.14 0.29
MycEx 0.02* 0.01* 0.03* - - NA 0.22 0.11 0.07 - - - 0.06 0.01* 0.02* - - - Basal-like and Luminal B
PyMTEx 0.41 0.38 - - - NA 0.28 0.09 0.08 0.08 0.33 0.46 0.02 0.10 0.12 - -
-NeuEx - - - NA 0.44 0.36 0.42 <1e-4* 0.01* 0.02 0.10 0.36 0.43 - - - Luminal A
Normal-likeEx - - - 0.14 0.21 NA - - - - 0.07 0.11 - - - <1e-4* 0.01* 5e-4* Normal-like
Class8Ex - - - 0.09 0.06 NA 0.48 - - 0.40 0.46 0.11 - - - 0.28 0.25 0.26
Wnt1-LateEx 0.37 - - - - NA - - - 0.40 0.41 0.42 - 0.46 0.40 0.15 0.01* 0.21
Wnt1-EarlyEx 0.29 - - - - NA - - - 0.40 0.19 0.33 0.38 0.40 0.49 0.39 0.08 0.21
p53null-BasalEx 0.04 0.05 0.06 - - NA - - 0.16 - - - 0.48 0.29 0.20 - - - Basal-like
Squamous-likeEx - - 0.35 0.11 0.02* NA 0.20 - - - 0.18 0.09 0.10
Stat1Ex - - - 0.37 0.32 NA 0.07 - - 0.31 0.30 0.16 - 0.48 0.41 0.38 0.39
-Class14Ex - - - 0.35 0.22 NA - - - 0.17 0.14 0.01* 0.45 - 0.11 0.06 <1e-4* 0.04* Normal-like
C3TagEx 0.02* 0.02* 0.03* 0.38 - NA - - 0.24 - - - 0.28 0.12 0.02* - - - Basal-like
Claudin-lowEx - - 0.38 5e-4* <1e-4* NA - - - 0.20 - - 0.41 - - 0.17 Claudin-low
p53null-LuminalEx 0.17 0.07 0.02* - - NA 0.35 0.23 0.15 - - - 0.24 0.24 0.16 - -
-A comparative analysis of each murine class versus each human subtype. Statistically significant observations are highlighted with an asterisk (P< 0.05, false discovery rate <0.1). Comparisons without aP-value were not found to have a positive association with each other. Abbreviation: U, UNC. C, Combined. T, TCGA. NA, not applicable.
Pfefferle
et
al.
Genome
Biology
2013,
14
:R125
Page
8
o
f
1
6
http://geno
mebiology
.com/2013/
three human datasets. Lastly, Class14Extumors were iden-tified as a counterpart for normal-like human tumors, and of the 13 murine tumors comprising this class, 38% (5/13) are from thePik3ca-H1047R model. This class clusters in-dependent of normal mammary tissue samples (which are all classified as Normal-likeEx), indicating that this associ-ation is possibly not driven by contaminassoci-ation of normal tissue in the tumor biopsies.
Conserved tumorigenic pathway signatures identified between human-mouse counterparts
Many researchers have hypothesized that gene expres-sion signatures may be a more robust means of utilizing gene expression data for discovery and pathway-based classification as they are composed of tens to hundreds of coordinately expressed genes. To take advantage of this approach, the median expression values for 963 publicly available pathway gene-signatures (Table S3 in Additional file 1) were calculated separately for the mouse and human datasets, and a two-class (class X versus all others) Significance Analysis of Microarrays (SAM) was used to identify pathways that were highly expressed by each class/subtype with a false discovery rate (FDR) of 0% (Tables S4-S26 in Additional file 1). To visualize pathway similarities across species, gene signa-tures highly expressed within each mouse class were first grouped into ‘pathway meta-signatures’, similar to the way coordinately expressed genes can be grouped into
‘gene signatures’. The average value of these ‘pathway meta-signatures’ was then calculated for each human tumor and displayed as standardized boxplots based on their human breast cancer subtype for the eight mouse classes with human counterparts (Figure 5). These box-plots allow for broad trends to be observed between the pathways highly expressed within each mouse class rela-tive to human tumors, and in all instances, identified tens of pathway signatures that were commonly expressed across species. For instance, the average ex-pression of the 135 pathway signatures highly expressed in C3-TagEx tumors were also very highly expressed in human basal-like tumors (Figure 5, top left panel), con-sistent with the gene level analysis. While these trends are informative, it was of most importance to identify the specific pathways that were highly expressed in both mouse and their human counterparts; it is likely that these shared pathways provide etiological insight and highlight potentially important cancer driving pathways. A subset of the pathways identified as highly expressed in both human and mouse counterparts are displayed below each graph, with all across-species conserved pathways presented in Table S3 in Additional file 1.
Three murine classes overlapped with human basal-like tumors (Figure 5). One common feature between these human and mouse tumors included Trp53 loss/
mutation, which in human basal-like tumors occurs in >85% of the samples [39]. This trait was most apparent in C3-TagExand p53null-BasalExmurine tumors on both the genetic and the expression level. The second cardinal feature of human basal-like tumors is high proliferation, primarily resulting from retinoblastoma protein loss [39,40]. Consistent with this finding, all three basal-like mouse classes highly expressed cell cycle and/or retino-blastoma pathway-related signatures. In addition, C3TagEx tumors were enriched for KRAS amplicon genes, b-MYB activation, mutant PIK3CA, and FAS signaling. Murine MycEx tumors were also enriched for b-MYB activation and mutant PIK3CA signaling, in addition to a HER1-pathway signature and E2F signaling. Lastly, the p53null-BasalExclass was enriched for a SRC activation signature, a HER1-pathway signature, and the KRAS amplicon. These findings are relevant since it has been shown that human basal-like tumors also highly express the b-MYB signature [45], are often KRAS [46] and cMYC amplified [39], and show a PIK3CA-activation signature [39,47]. Thus, for human and murine basal-like cancers, both the under-lying molecular genetics and their expression profiles are very similar across species.
Human and mouse claudin-low tumors also share many features, including high expression of immune cell associated genes/signatures (for example, B cell receptor, PD1, and T cell receptor signaling), which is likely due to consistently infiltrating immune cells. Both human HER2-enriched and murine Erbb2-likeEx tumors highly expressed the EIF2 pathway, GATA3 induced genes, and p53 independent DNA damage response genes. Human luminal A and murine NeuExtumors exhibited high ex-pression levels of several tyrosine kinase-associated path-way signatures, including EGF, HER2, PDGF, TGFβ, and PIK3CA signaling. In support of this EGF/HER2 path-way finding, it was recently shown that TgMMTV-Neu
tumors therapeutically respond to lapatinib (a dual EGFR and HER2 inhibitor) treatment [48], as would be predicted by the nature of this transgene. In addition to mimicking human basal-like tumors, the murine MycEx class was also a counterpart for the luminal B subtype. Interestingly, many of the same pathways that were common with basal-like tumors are also shared with luminal B tumors, highlighting potentially important etiological events that are shared between these two aggressive intrinsic subtypes; these features include proliferation/retinoblastoma related pathways, increased chromosome instability, and altered DNA damage repair mechanisms.
Discussion
to study human disease, but it is essential to ensure the chosen models accurately replicate genetic alterations and overall phenotypes observed in human tumors. Thus, a number of considerations must be kept in mind when designing and/or selecting GEMMs to mimic the human disease state; these features should include intra-model tumor diversity, the degree of genetic similarity, the degree of transcriptomic similarity, and histological similarity (a topic not addressed here). By consolidating mouse models of breast carcinoma into a single dataset, this study was able to investigate the first three of these issues, in which we identified murine models for all of the major human expression subtypes.
To address intramodel tumor diversity, three types of models were identified based on hierarchical clus-tering analysis: ‘homogeneous’,‘semi-homogeneous’, and
‘heterogeneous’.‘Homogeneous’GEMMs were associated
[image:10.595.57.540.90.452.2]with a single murine expression class and were generally created through the expression of oncogenes, possibly relying less on secondary or tertiary mutations that arise during tumor progression. These GEMMs make good ex-perimental models because the phenotypes of individual tumors are consistent and similar. ‘Semi-homogeneous’ models, such as TgMMTV-Wnt1, were associated with two murine classes. We hypothesize that unknown sec-ondary events after the initial transgene lesion determine the class fate of these developing tumors. These varying combinations of secondary lesions may cooperate with ab-errant Wnt1 signaling to target different mammary cell populations, contributing to model complexity. The last type of model comprises tumors with‘heterogeneous’gene expression patterns (that is, models showing three or more distinct phenotypes). In contrast to‘homogeneous’ models, the majority of the ‘heterogeneous’models were
Figure 5Conserved signaling pathways between human-mouse counterparts.A two-class SAM (class X versus all others) was used to iden-tify pathways highly expressed in each murine class. Pathways highly expressed with a FDR of 0% were grouped together to define a‘pathway meta-signature’for each murine class (with the total number of pathway signatures included shown on the left axis). The standardized, average expression values of each‘pathway meta-signature’were calculated in the UNC308, Combined855, and TCGA547 human datasets, which are dis-played as boxplots according to their intrinsic human subtype. A subset of the pathways independently identified to be highly expressed in both human-mouse counterparts (as indicated by the asterisk) for all three human datasets is displayed below each plot.
Pfefferleet al. Genome Biology2013,14:R125 Page 10 of 16
based on disrupting the function of tumor suppressor genes. Again, we hypothesize that secondary events after the initial transgene lesion are involved in the class fate determination of these tumors. For example, theTrp53−/−
model shows specific DNA copy number changes associ-ated with each expression class [32]. From an experimental perspective, special considerations (that is, phenotyping each individual tumor) must be made to account for this heterogeneity, especially when these models will be utilized for therapeutic efficacy testing.
Despite the diversity of the models tested here, we found that these mouse models collapse into distinct murine classes that recapitulate specific human subtypes on a gene expression-based level. These results are im-portant as they allow for the identification of shared characteristics/lesions between murine and human tu-mors, and they direct researchers toward appropriate
in vivomodels of specific human subtypes for future ex-perimental testing. Basal-like breast tumors are one the most aggressive subtypes of breast cancer. Herein, we find that three murine classes recapitulated human basal-like breast cancers: C3TagEx, MycEx, and p53null-BasalEx. The human basal-like subtype is characterized by high proliferation [49], genomic instability [46], and expression of a c-MYC signature [39,44]. These murine classes share these hallmarks as evident by high expres-sion of the proliferation gene cluster, cell cycle pathways, and chromosome instability gene-signatures; thus, there are clear GEMMs of human basal-like tumors that share both common genetic drivers and expression features.
Murine Claudin-lowEx tumors were identified that significantly mimic the human claudin-low subtype; however, no homogeneous murine model was specific to this class/subtype. Instead, rare tumors from mul-tiple heterogeneous models coalesced into the murine claudin-low group. As an experimental solution to this heterogeneous GEMM complication, the T11 orthotopic, transplantable syngeneic model was derived from a Claudin-lowEx BALB/c Trp53−/− tumor (753R), which maintains its claudin-low expression features even after multiple transplant passages [32]. This transplantable model has been used for extensive therapeutic testing [48], thus suggesting that one method of ‘capturing’ a heterogeneous model in a single state can be accom-plished via the serial transplantation of a phenotypically characterized individual tumor. As in the human claudin-low subtype,Trp53mutation/loss was a common genetic event in mouse Claudin-lowExtumors. Similarly, both spe-cies highly express epithelial-to-mesenchymal transition related genes and inflammatory gene signatures, and have low expression of many epithelial cell adhesion genes, in-cluding E-cadherin [34].
Discovered here was the Erbb2-likeEx murine class, which associated with human HER2-enriched tumors
even without highly expressing theErbb2gene; no mouse model from our previous studies mimicked this aggressive human tumor subtype. One homogeneous model was found within this class, namely TgWAPCre-Etv6. This model expresses the Etv6-Ntrk3 fusion gene product, a protein that has been associated with secretory breast can-cers [50]. Consistent with this, we observed that murine Erbb2-likeEx tumors highly express a gene signature in common with lactating normal mammary tissue.
For the human luminal breast cancer subtypes, our previous study identified that the TgMMTV-Neu model represents the luminal subtypes more than it resembles HER2-enriched tumors [31]. We provide further evi-dence here that the murine NeuExclass specifically asso-ciates with human luminal A tumors. Conserved with humans, murine NeuEx tumors highly express several tyrosine kinase pathway-related gene-signatures, namely EGFR and HER2, which would be expected based upon the nature of the Neu/ERBB2 transgene. It has been shown that TgMMTV-Neutumors regress with lapatinib treatment [48], giving credence to our approach for identifying drug targetable driver/maintenance pathways in these tumors using a computational pathway-based approach. Interestingly, only the murine MycExclass was shown to consistently associate with luminal B tumors. Since the MycExclass was also identified as a basal-like model, aberrant Myc activation may be a common hall-mark of these two aggressive subtypes.
While our main focus was to identify human-to-mouse disease counterparts, about half of the human-to-mouse classes did not statistically associate with specific human subtypes by our broad analysis. Several of these mouse-specific classes, however, had clear basal-like tumor ex-pression features, including WapINT3Ex, Wnt1-LateEx, Wnt1-EarlyEx, and Squamous-likeEx. Unlike the other three, the Squamous-likeExclass consisted of a variety of models (for example, Pik3ca-H1047R, Brg1+/−, and DMBA-induced) and trended toward an association with human claudin-low tumors. Similarly, several classes had luminal expression features, highlighted by PyMTExand Stat1Ex. Although the PyMTEx class had a relatively small number of samples, these tumors trended toward an association with the luminal B subtype. The Stat1Ex class also had several strong luminal features, consistent with prior characterization of this model [11]. Given the expression of ERαin theseSTAT1-defecient tumors [11], the lack of an association with either the luminal A or luminal B human subtypes was unexpected.
ESR1in the case of NeuEx). Three hypotheses that could explain this finding are: 1) the cell type of origin of the tumor (but not a genetic driver) is the same across species and this is the major linking phenotype; 2) additional unknown genetic driver(s) are responsible for the common phenotype across species; or 3) some combination of hypothesis 1 and 2. We favor the common cell type of origin hypothesis, but additional experiments like lineage tracing will be required to unequivocally de-termine this.
Related to this, there are at least two confounding fea-tures within our dataset that should also be considered when interpreting these results. First, most of the oncogene-driven mouse models analyzed here used either the MMTV or WAP promoter in their design. If the activ-ity of these promoters varies as a function of specific mam-mary cell types, such as luminal versus myoepithelial cells, then only those cells that naturally use these promoters would ever give rise to a tumor in these models; we note that most of the MMTV or WAP driven tumors were lu-minal. Second, similar complications potentially exist with regards to mouse strain. Varying the background genetics in which a model is designed can influence tumor pheno-type, and thus classification. Unfortunately, our dataset is underpowered to adequately address these two confound-ing features, but future experiments/models could be de-signed to address these questions.
While some of the mouse classes were identified as good counterparts for specific human subtypes, many were not. There are several possibilities to explain this lack of association. The first is that these classes are spe-cific to murine mammary carcinomas and do not have a matching counterpart in humans. The second might be that these murine classes model rare phenotypes that exist in only a small subset of human breast cancer pa-tients, and that these rare human subtypes were not present in the datasets used here. Similarly, more mouse tumors for classes with small numbers may be required to increase statistical power to detect an association; for example, we hypothesize this to be the case for the PyM-TExclass. The third possibility is that these novel murine classes share phenotypes with multiple human subtypes, and thus may never be classified as being similar to a single human subtype. Some murine tumor features were shared across multiple human subtypes (for ex-ample, MycEx with human basal-like and luminal B), which our presented analysis is more likely to under-value. While this study provides a framework for identify-ing GEMMs that could be useful for preclinical drug testing, the simultaneous analysis of 27 mouse models re-stricted ourtrans-species comparisons to only expression-based analyses. The scope of our future work will focus on using models selected based upon these data for preclin-ical therapeutic testing to better determine the
translational utility of these GEMMs. These experiments are already underway and producing promising results using the TgMMTV-Neu, TgC3(1)-Tag, and claudin-low T11 models [48,51-53]. For example, in Robertset al.[51], we showed that the CyclinD1 dependent TgMMTV-Neu tumors are sensitive to a CDK4/6 inhibitor, while the basal-like TgC3(1)-Tagtumors were not; these studies are consistent with findings coming from human clinical trials of luminal/ER + breast cancers, which were generally noted to be sensitive to a CDK4/6 inhibitor [54]. Similarly, atrans-species genetic screen by Bennettet al.[53] identi-fied two ribonucleotide reductase genes (RRM1 and
RRM2) and a checkpoint kinase (CHK1) as potential tar-gets for triple-negative breast cancer patients, which they validated in both species with drug treatment experiments using TgC3(1)-Tagand human xenograft tumors.
Lastly, the data presented in this study may provide an explanation for a recent paper that concluded that mur-ine models are not helpful for studying acute human inflammatory disease [55]. Their conclusion was drawn from a comparison using a single mouse strain/model (that is, C57BL6) versus a large number of humans. Based on the data presented here, we predict that mul-tiple mouse strains/models would need to be tested be-fore such a conclusion could be made. To improve preclinical study designs using mouse models for any dis-ease, it is our recommendation that the following steps be used as guidelines: 1) select/create multiple mouse models for comparative analysis to humans; 2) classify the pheno-type(s) of each model with a specific focus on the degree of intramodel ‘heterogeneity’; and 3) objectively compare each model to the human disease state to identify the pos-sibletrans-species counterparts. With this approach, it is likely that some strains/models might be rejected as not mimicking the human disease state, while others may, and it is those that do that are the most valuable for preclinical testing. We suggest that the use of this approach will in-crease the predictive nature of preclinical studies in mice.
Conclusion
We consolidate 27 murine models of breast carcinoma into the largest comprehensive genomic dataset to date, and we provide a detailed characterization of each to better understand how these GEMMs recapitulate phe-notypes of the human subtypes. The data presented here provide insight into the molecular pathways involved in specific breast cancer subtypes and should serve as a useful resource when designing preclinical studies and interpreting their results.
Materials and methods Gene expression microarrays
A murine tumor dataset of 385 DNA gene expression microarrays from 27 GEMMs of mammary carcinoma
Pfefferleet al. Genome Biology2013,14:R125 Page 12 of 16
was compiled (Table 1A; Table S1 in Additional file 1). Of these, 275 samples were obtained from multiple pre-vious publications (Gene Expression Omnibus accession numbers GSE3165, GSE8516, GSE9343, GSE14457, GSE15263, GSE17916, and GSE27101). The other 110 microarray samples (GSE42640) represent newly ob-tained tumor samples from multiple participating inves-tigators using methods approved by international animal husbandry guidelines. Total RNA was purified from 20 to 30 mg of mouse mammary tumor using Qiagen’s (Valencia, CA USA) RNeasy Mini Kit following the man-ufacture’s protocols. RNA quantity and quality were de-termined using the Nanodrop spectrophotometer and Agilent Bioanalyzer, respectively. Total RNA was reverse transcribed and labeled with cyanine-5 (Cy5) dye for ex-perimental samples and cyanine-3 (Cy3) dye for mouse reference samples [31] using the Agilent Low RNA Input Fluorescent Linear Amplification Kit. Equal quantities of labeled mouse reference RNA and tumor RNA were co-hybridized overnight to Agilent microarrays, washed, scanned and signal intensities were determined.
All tumor samples were co-hybridized to one of three Agilent Technology gene expression microarray types: 22 K, 4X44K, or 4X180K (Figure 1). Two‘homogeneous expression’ murine models [31], namely TgMMTV-Neu
and TgC3(I)-Tag, were analyzed on all three array types. Therefore, we used both of these models to normalize expression between microarray types [32]. Ten microar-rays (five TgMMTV-Neu and five TgC3(I)-Tag) from each array type were used for normalization (30 micro-arrays total). All microarray data were independently ex-tracted from the UNC Microarray Database for each array type as log2 Cy5/Cy3 ratios, filtering for probes with Lowess normalized intensity values greater than 10 in both channels and for probes with data on greater than 70% of the microarrays [31,34]. Before normalization, each data set was imputed (via the 10 nearest neighbor gene values) and then reduced to the probes that were present on all three array type datasets (11,690 probes, 11,167 genes). Using the 10 normalization arrays per 3 array platforms, the median expression value was calcu-lated for each probe, on each array type, and a normalization factor was applied independently to each probe so the median was the same for each array type. Probe expression values were‘median centered’to obtain the final normalized dataset. A principle component ana-lysis was performed to verify the normalization.
Murine intrinsic genes and subtypes
After removing technical replicates, the dataset was fil-tered to probes with at least three observations with an absolute log2expression value >3 using Gene Cluster 3.0 [56], which included 908 probes (899 genes). Hierarch-ical clustering was performed with this unsupervised
probe list using centroid linkage and was viewed with Java Treeview v1.1.5r2 [57]. Potential‘intrinsic groups’of murine samples were defined as any set of samples/ arrays within this hierarchical cluster that had a Pearson correlation value of 0.65 or greater [31]. Using these de-fined groups (42 total), an ‘intrinsic gene list’ of 1,855 probes (1,841 genes) was identified with Intrinsic Gene Identifier v1.0 (Max Diehn/Stanford University) by using a cutoff of one standard deviation below the mean in-trinsic gene value [31] (Table S2 in Additional file 1).
To identify significant murine ‘intrinsic subtypes’, the 385 sample dataset was clustered again using the 1,855 intrinsic probe list and SigClust [37] was used to identify groups of samples with a significant association to one another (P< 0.01) [32]. GEMM classes were defined as having at least five tumors and a SigClustP-value≤0.01, yielding 17 classes. Class-specific probes/genes were de-termined using a two class (class X versus all other sam-ples) SAM analysis (v3.11) [34,58] (Tables S4 to S20 in Additional file 1).
Human and mouse intrinsic gene co-cluster
Prior to combining the two datasets, probes correspond-ing to orthologous gene IDs (as determined by the Mouse Genome Informatics of the Jackson Laboratory) were averaged for both the mouse and UNC308 human datasets. Using only orthologous genes found in both datasets (8,034 genes), each tumor and gene was stan-dardized to have an average expression of zero and a standard deviation of one (N(0,1)) separately for each species. Then, the datasets were merged and each gene was median centered to obtain the final, normalized combined dataset. A merged intrinsic gene list was cre-ated by combining the 1,841 mouse intrinsic genes de-fined here and the 1,918 human intrinsic genes from Parker et al. [41] (3,310 unique genes in the combined gene set). An intrinsic gene set hierarchical co-cluster was performed using centroid linkage in Gene Cluster 3.0.
Comparison of murine and human expression subtypes
subtype-specific gene sets using GSA. Significant overlap was defined as having P≤0.05 and FDR ≤0.1 to control for multiple comparisons [42]. These same methods were used to identify significant overlap between our 17 newly derived murine classes and the 10 previously defined GEMM classes from Herschkowitzet al.[31], noting that all 122 arrays used for the Herschkowitzet al.study were also present within the 385 sample dataset used here (Figure S3 in Additional file 2).
Conserved pathway gene signatures
Only genes that were found in both the human and murine datasets were considered for gene-signature ana-lysis in order to eliminate the influence of genes found in only one dataset. Prior to calculating gene-signature values, the human and murine datasets were separately collapsed by averaging rows corresponding to the same gene symbol. Median expression values were calculated for 963 publicly available pathway-based gene signatures using methods described in Fanet al. [59,60] (Table S3 in Additional file 1). A two class SAM (class or subtype X versus all other samples) was used to identify path-way signatures enriched in murine and human classes/ subtypes, which were defined as being upregulated with a FDR of 0% (Tables S4 to S26 in Additional file 1).
Additional files
Additional file 1: Tables S1 to S26.A table of contents is listed on the first worksheet that describes the information presented in Tables S1 to S26.
Additional file 2: Figures S1 to S3.Figure S1: enlarges the cluster dendrogram from Figure 2B, showing the clustering location and expression class for each individual tumor in the mouse dataset. Figure S2: clustering location for tumors of a given model from Figure 2B. Figure S3: gene set analysis results comparing the 10 murine classes from Herschkowitzet al.[31] and the 17 murine classes defined here.
Abbreviations
Cy3:Cyanine-3; Cy5: Cyanine-5; ER: Estrogen receptor; FDR: False discovery rate; GEMM: Genetically engineered mouse model; GSA: Gene set analysis; SAM: Significance Analysis of Microarrays.
Competing interests
CMP is an equity stock holder of BioClassifier LLC and University Genomics, and has filed a patent on the PAM50 subtyping assay.
Authors’contributions
Conception and design: ADP and CMP. Tumor collection: JIH, JU, JRA, MIT, MB, and SEE. Acquisition of data: ADP, JIH, JU, and JCH. Analysis and interpretation of data: ADP, JIH, JU, JCH, BTS, GMW, JMR, and CMP. Writing of manuscript: ADP and CMP. All authors read and approved the final manuscript.
Acknowledgements
We would like to thank the following labs for generously donating tumor samples for this project: Pamela Cowin (New York University), Yi Li (Baylor), Stuart Orkin (Harvard), Robert Schreiber (Washington University), Harold Varmus (NIH), and Yue Xiong (UNC). We would also like to thank the Perou lab and LW Pfefferle for helpful suggestions and review of the manuscript. This study was supported by funds from the following sources: NCI
P50-CA58223 Breast SPORE program (CMP), RO1-CA138255 (CMP), RO1-CA148761 (CMP), Department of Defense W81XWH-12-1-0107 (CMP and GMW), NIEHS T32-ES07017 (ADP), NCI P01 CA080111 (MB), the Canadian Breast Cancer Research Foundation (SEE), and the Breast Cancer Research Foundation (CMP).
Data access
Microarray data have been deposited in the Gene Expression Omnibus (GEO) under accession number GSE42640.
Author details
1Department of Pathology and Laboratory Medicine, University of North
Carolina, Chapel Hill, NC 27599, USA.2Lineberger Comprehensive Cancer Center, University of North Carolina, Chapel Hill, NC 27599, USA. 3
Department of Biomedical Sciences, University at Albany, Rensselaer, NY 12144, USA.4Department of Genetics, University of North Carolina, Chapel Hill, NC 27599, USA.5Gene Expression Laboratory, Salk Institute for Biological Studies, La Jolla, CA 92130, USA.6Program in Developmental and Stem Cell Biology, Peter Gilgan Center for Research and Learning, The Hospital for Sick Children, Toronto, ON M5G 1X8, Canada.7Division of Molecular and Cellular Oncology, Department of Medical Oncology, Dana-Farber Cancer Institute and Harvard Medical School, Boston, MA 02115, USA.8Department of Molecular Genetics, The University of Toronto, Toronto, ON M5R 0A3, Canada.9Department of Molecular and Cellular Biology, Baylor College of Medicine, Houston, TX 77030, USA.
Received: 6 June 2013 Accepted: 12 November 2013 Published: 12 November 2013
References
1. Society AC:Cancer facts & figures 2011.Cancer Facts and Figures2011,1:1–60. 2. Toft DJ, Cryns VL:Minireview: basal-like breast cancer: from molecular
profiles to targeted therapies.Mol Endocrinol2011,25:199–211. 3. Schlotter CM, Vogt U, Allgayer H, Brandt B:Molecular targeted therapies
for breast cancer treatment.Breast Cancer Res2008,10:211.
4. Kola I, Landis J:Can the pharmaceutical industry reduce attrition rates? Nat Rev Drug Discov2004,3:711–715.
5. Begley CG, Ellis LM:Drug development: raise standards for preclinical cancer research.Nature2012,483:531–533.
6. Hutchinson L, Kirk R:High drug attrition rates–where are we going wrong?Nat Rev Clin Oncol2011,8:189–190.
7. Bultman SJ, Herschkowitz JI, Godfrey V, Gebuhr TC, Yaniv M, Perou CM, Magnuson T:Characterization of mammary tumors from Brg1 heterozygous mice.Oncogene2008,27:460–468.
8. Pei XH, Bai F, Smith MD, Usary J, Fan C, Pai SY, Ho IC, Perou CM, Xiong Y: CDK inhibitor p18(INK4c) is a downstream target of GATA3 and restrains mammary luminal progenitor cell proliferation and tumorigenesis. Cancer Cell2009,15:389–401.
9. Adams JR, Xu K, Liu JC, Agamez NM, Loch AJ, Wong RG, Wang W, Wright KL, Lane TF, Zacksenhaus E, Egan SE:Cooperation between Pik3ca and p53 mutations in mouse mammary tumor formation.Cancer Res2011, 71:2706–2717.
10. Jiang Z, Deng T, Jones R, Li H, Herschkowitz JI, Liu JC, Weigman VJ, Tsao MS, Lane TF, Perou CM, Zacksenhaus E:Rb deletion in mouse mammary progenitors induces luminal-B or basal-like/EMT tumor subtypes de-pending on p53 status.J Clin Invest2010,120:3296–3309.
11. Chan SR, Vermi W, Luo J, Lucini L, Rickert C, Fowler AM, Lonardi S, Arthur C, Young LJ, Levy DE, Welch MJ, Cardiff RD, Schreiber RD:STAT1-deficient mice spontaneously develop estrogen receptor alpha-positive luminal mammary carcinomas.Breast Cancer Res2012,14:R16.
12. Torres-Arzayus MI, Font de Mora J, Yuan J, Vazquez F, Bronson R, Rue M, Sellers WR, Brown M:High tumor incidence and activation of the PI3K/ AKT pathway in transgenic mice define AIB1 as an oncogene.Cancer Cell 2004,6:263–274.
13. Liu S, Umezu-Goto M, Murph M, Lu Y, Liu W, Zhang F, Yu S, Stephens LC, Cui X, Murrow G, Coombes K, Muller W, Hung MC, Perou CM, Lee AV, Fang X, Mills GB:Expression of autotaxin and lysophosphatidic acid receptors increases mammary tumorigenesis, invasion, and metastases.Cancer Cell 2009,15:539–550.
Pfefferleet al. Genome Biology2013,14:R125 Page 14 of 16
14. Muller WJ, Lee FS, Dickson C, Peters G, Pattengale P, Leder P:The int-2 gene product acts as an epithelial growth factor in transgenic mice. EMBO J1990,9:907–913.
15. Sinn E, Muller W, Pattengale P, Tepler I, Wallace R, Leder P:Coexpression of MMTV/v-Ha-ras and MMTV/c-myc genes in transgenic mice: synergistic action of oncogenes in vivo.Cell1987,49:465–475.
16. Pond AC, Herschkowitz JI, Schwertfeger KL, Welm B, Zhang Y, York B, Cardiff RD, Hilsenbeck S, Perou CM, Creighton CJ, Lloyd RE, Rosen JM:Fibroblast growth factor receptor signaling dramatically accelerates tumorigenesis and enhances oncoprotein translation in the mouse mammary tumor virus-Wnt-1 mouse model of breast cancer.Cancer Res2010, 70:4868–4879.
17. Li Z, Tognon CE, Godinho FJ, Yasaitis L, Hock H, Herschkowitz JI, Lannon CL, Cho E, Kim SJ, Bronson RT, Perou CM, Sorensen PH, Orkin SH:ETV6-NTRK3 fusion oncogene initiates breast cancer from committed mammary progenitors via activation of AP1 complex.Cancer Cell2007,12:542–558. 18. Cressman VL, Backlund DC, Hicks EM, Gowen LC, Godfrey V, Koller BH:
Mammary tumor formation in p53- and BRCA1-deficient mice.Cell Growth Differ1999,10:1–10.
19. Yin Y, Bai R, Russell RG, Beildeck ME, Xie Z, Kopelovich L, Glazer RI: Characterization of medroxyprogesterone and DMBA-induced multilineage mammary tumors by gene expression profiling.Mol Carcinog2005, 44:42–50.
20. Maroulakou IG, Anver M, Garrett L, Green JE:Prostate and mammary adenocarcinoma in transgenic mice carrying a rat C3(1) simian virus 40 large tumor antigen fusion gene.Proc Natl Acad Sci U S A1994, 91:11236–11240.
21. Xu X, Wagner KU, Larson D, Weaver Z, Li C, Ried T, Hennighausen L, Wynshaw-Boris A, Deng CX:Conditional mutation of Brca1 in mammary epithelial cells results in blunted ductal morphogenesis and tumour formation.Nat Genet1999,22:37–43.
22. Guy CT, Webster MA, Schaller M, Parsons TJ, Cardiff RD, Muller WJ: Expression of the neu protooncogene in the mammary epithelium of transgenic mice induces metastatic disease.Proc Natl Acad Sci U S A1992, 89:10578–10582.
23. Guy CT, Cardiff RD, Muller WJ:Induction of mammary tumors by expression of polyomavirus middle T oncogene: a transgenic mouse model for metastatic disease.Mol Cell Biol1992,12:954–961.
24. Tsukamoto AS, Grosschedl R, Guzman RC, Parslow T, Varmus HE:Expression of the int-1 gene in transgenic mice is associated with mammary gland hyperplasia and adenocarcinomas in male and female mice.Cell1988, 55:619–625.
25. Gallahan D, Jhappan C, Robinson G, Hennighausen L, Sharp R, Kordon E, Callahan R, Merlino G, Smith GH:Expression of a truncated Int3 gene in developing secretory mammary epithelium specifically retards lobular differentiation resulting in tumorigenesis.Cancer Res1996,56:1775–1785. 26. Sandgren EP, Schroeder JA, Qui TH, Palmiter RD, Brinster RL, Lee DC:
Inhibition of mammary gland involution is associated with transforming growth factor alpha but not c-myc-induced tumorigenesis in transgenic mice.Cancer Res1995,55:3915–3927.
27. Simin K, Wu H, Lu L, Pinkel D, Albertson D, Cardiff RD, Van Dyke T:pRb inactivation in mammary cells reveals common mechanisms for tumor initiation and progression in divergent epithelia.PLoS Biol2004,2:E22. 28. Husler MR, Kotopoulis KA, Sundberg JP, Tennent BJ, Kunig SV, Knowles BB:
Lactation-induced WAP-SV40 Tag transgene expression in C57BL/6 J mice leads to mammary carcinoma.Transgenic Res1998,7:253–263. 29. Jerry DJ, Kittrell FS, Kuperwasser C, Laucirica R, Dickinson ES, Bonilla PJ, Butel
JS, Medina D:A mammary-specific model demonstrates the role of the p53 tumor suppressor gene in tumor development.Oncogene2000, 19:1052–1058.
30. Backlund MG, Trasti SL, Backlund DC, Cressman VL, Godfrey V, Koller BH:Impact of ionizing radiation and genetic background on mammary tumorigenesis in p53-deficient mice.Cancer Res2001, 61:6577–6582.
31. Herschkowitz JI, Simin K, Weigman VJ, Mikaelian I, Usary J, Hu Z, Rasmussen KE, Jones LP, Assefnia S, Chandrasekharan S, Backlund MG, Yin Y, Khramtsov AI, Bastein R, Quackenbush J, Glazer RI, Brown PH, Green JE, Kopelovich L, Furth PA, Palazzo JP, Olopade OI, Bernard PS, Churchill GA, Van Dyke T, Perou CM:Identification of conserved gene expression features between murine mammary carcinoma models and human breast tumors.Genome Biol2007,8:R76.
32. Herschkowitz JI, Zhao W, Zhang M, Usary J, Murrow G, Edwards D, Knezevic J, Greene SB, Darr D, Troester MA, Hilsenbeck SG, Medina D, Perou CM, Rosen JM:Comparative oncogenomics identifies breast tumors enriched in functional tumor-initiating cells.Proc Natl Acad Sci U S A2011, 109:2778–2783.
33. Perou CM, Sorlie T, Eisen MB, van de Rijn M, Jeffrey SS, Rees CA, Pollack JR, Ross DT, Johnsen H, Akslen LA, Fluge O, Pergamenschikov A, Williams C, Zhu SX, Lonning PE, Borresen-Dale AL, Brown PO, Botstein D:Molecular portraits of human breast tumours.Nature2000,406:747–752. 34. Prat A, Parker JS, Karginova O, Fan C, Livasy C, Herschkowitz JI, He X, Perou
CM:Phenotypic and molecular characterization of the claudin-low intrinsic subtype of breast cancer.Breast Cancer Res2010,12:R68. 35. Prat A, Perou CM:Deconstructing the molecular portraits of breast
cancer.Mol Oncol2010,5:5–23.
36. Sharpless NE, Depinho RA:The mighty mouse: genetically engineered mouse models in cancer drug development.Nat Rev Drug Discov2006, 5:741–754.
37. Liu Y, Hayes D, Nobel A, Moarron J:Statistical significance of clustering for high-dimension, low-sample size data.Am Stat Assoc2008,103:1281–1293. 38. Shackleford GM, MacArthur CA, Kwan HC, Varmus HE:Mouse mammary
tumor virus infection accelerates mammary carcinogenesis in Wnt-1 transgenic mice by insertional activation of int-2/Fgf-3 and hst/Fgf-4. Proc Natl Acad Sci U S A1993,90:740–744.
39. Network TCGA:Comprehensive molecular portraits of human breast tumors.Nature2012,490:61–70.
40. Herschkowitz JI, He X, Fan C, Perou CM:The functional loss of the retinoblastoma tumour suppressor is a common event in basal-like and luminal B breast carcinomas.Breast Cancer Res2008,10:R75.
41. Parker JS, Mullins M, Cheang MC, Leung S, Voduc D, Vickery T, Davies S, Fauron C, He X, Hu Z, Quackenbush JF, Stijleman IJ, Palazzo J, Marron JS, Nobel AB, Mardis E, Nielsen TO, Ellis MJ, Perou CM, Bernard PS:Supervised risk predictor of breast cancer based on intrinsic subtypes.J Clin Oncol 2009,27:1160–1167.
42. Efron B, Tibshirani R:On testing the significance of sets of genes.Ann Appl Stat2007,1:107–129.
43. Harrell JC, Prat A, Parker JS, Fan C, He X, Carey L, Anders C, Ewend M, Perou CM:Genomic analysis identifies unique signatures predictive of brain, lung, and liver relapse.Breast Cancer Res Treat2011,132:523–535. 44. Chandriani S, Frengen E, Cowling VH, Pendergrass SA, Perou CM, Whitfield
ML, Cole MD:A core MYC gene expression signature is prominent in basal-like breast cancer but only partially overlaps the core serum response.PLoS One2009,4:e6693.
45. Thorner AR, Hoadley KA, Parker JS, Winkel S, Millikan RC, Perou CM:In vitro and in vivo analysis of B-Myb in basal-like breast cancer.Oncogene2009, 28:742–751.
46. Weigman VJ, Chao HH, Shabalin AA, He X, Parker JS, Nordgard SH, Grushko T, Huo D, Nwachukwu C, Nobel A, Kristensen VN, Borresen-Dale AL, Olopade OI, Perou CM:Basal-like breast cancer DNA copy number losses identify genes involved in genomic instability, response to therapy, and patient survival.Breast Cancer Res Treat2011,133:865–880.
47. Hutti JE, Pfefferle AD, Russell SC, Sircar M, Perou CM, Baldwin AS: Oncogenic PI3K mutations lead to NF-kappaB-dependent cytokine expression following growth factor deprivation.Cancer Res2012, 72:3260–3269.
48. Roberts PJ, Usary JE, Darr DB, Dillon PM, Pfefferle AD, Whittle MC, Duncan JS, Johnson SM, Combest AJ, Jin J, Zamboni WC, Johnson GL, Perou CM, Sharpless NE:Combined PI3K/mTOR and MEK inhibition provides broad antitumor activity in faithful murine cancer models.Clin Cancer Res2012, 18:5290–5303.
49. Rakha EA, Reis-Filho JS, Ellis IO:Basal-like breast cancer: a critical review. J Clin Oncol2008,26:2568–2581.
50. Tognon C, Knezevich SR, Huntsman D, Roskelley CD, Melnyk N, Mathers JA, Becker L, Carneiro F, MacPherson N, Horsman D, Poremba C, Sorensen PH: Expression of the ETV6-NTRK3 gene fusion as a primary event in human secretory breast carcinoma.Cancer Cell2002,2:367–376.
51. Roberts PJ, Bisi JE, Strum JC, Combest AJ, Darr DB, Usary JE, Zamboni WC, Wong KK, Perou CM, Sharpless NE:Multiple roles of cyclin-dependent kinase 4/6 inhibitors in cancer therapy.J Natl Cancer Inst2012, 104:476–487.
Zamboni W, Sharpless NE, Perou CM:Predicting drug responsiveness in humans cancers using genetically engineered mice.Clin Cancer Res2013, 19:4889–4899.
53. Bennett CN, Tomlinson CC, Michalowski AM, Chu IM, Luger D, Mittereder LR, Aprelikova O, Shou J, Piwinica-Worms H, Caplen NJ, Hollingshead MG, Green JE:Cross-species genomic and functional analyses identify a combination therapy using a CHK1 inhibitor and a ribonucleotide reductase inhibitor to treat triple-negative breast cancer.Breast Cancer Res2012,14:R109.
54. Finn RS, Crown JP, Lang I, Boer K, Bondarenko IM, Kulyk SO, Ettl J, Patel R, Pinter T, Schmidt M, Shparyk Y, Thummala AR, Voytko NL, Breazna A, Kim ST, Randolph S, Slamon DJ:Results of a randomized phase 2 study of PD 0332991, a cyclin-dependent kinase (CDK) 4/6 inhibitor, in combination with letrozole vs letrozole alone for first-line treatment of ER+/HER2– advanced breast cancer (BC).Cancer Res2012,72:Abstract nr S1–6. 55. Seok J, Warren HS, Cuenca AG, Mindrinos MN, Baker HV, Xu W, Richards DR,
McDonald-Smith GP, Gao H, Hennessy L, Finnerty CC, Lopez CM, Honari S, Moore EE, Minei JP, Cuschieri J, Bankey PE, Johnson JL, Sperry J, Nathens AB, Billiar TR, West MA, Jeschke MG, Klein MB, Gamelli RL, Gibran NS, Brownstein BH, Graziano CM, Calvano SE, Mason PH,et al:Genomic responses in mouse models poorly mimic human inflammatory diseases.Proc Natl Acad Sci U S A2013,110:3507–3512.
56. de Hoon MJ, Imoto S, Nolan J, Miyano S:Open source clustering software. Bioinformatics2004,20:1453–1454.
57. Saldanha AJ:Java Treeview–extensible visualization of microarray data. Bioinformatics2004,20:3246–3248.
58. Tusher VG, Tibshirani R, Chu G:Significance analysis of microarrays applied to the ionizing radiation response.Proc Natl Acad Sci U S A2001, 98:5116–5121.
59. Fan C, Prat A, Parker JS, Liu Y, Carey LA, Troester MA, Perou CM:Building prognostic models for breast cancer patients using clinical variables and hundreds of gene expression signatures.BMC Med Genomics2011,4:3. 60. Subramanian A, Tamayo P, Mootha VK, Mukherjee S, Ebert BL, Gillette MA,
Paulovich A, Pomeroy SL, Golub TR, Lander ES, Mesirov JP:Gene set enrichment analysis: a knowledge-based approach for interpreting genome-wide expression profiles.Proc Natl Acad Sci U S A2005, 102:15545–15550.
doi:10.1186/gb-2013-14-11-r125
Cite this article as:Pfefferleet al.:Transcriptomic classification of genetically engineered mouse models of breast cancer identifies human subtype counterparts.Genome Biology201314:R125.
Submit your next manuscript to BioMed Central and take full advantage of:
• Convenient online submission
• Thorough peer review
• No space constraints or color figure charges
• Immediate publication on acceptance
• Inclusion in PubMed, CAS, Scopus and Google Scholar
• Research which is freely available for redistribution
Submit your manuscript at www.biomedcentral.com/submit
Pfefferleet al. Genome Biology2013,14:R125 Page 16 of 16