R E S E A R C H
Open Access
Temporal dynamics and transcriptional control
using single-cell gene expression analysis
Tsukasa Kouno
1,2, Michiel de Hoon
1,2, Jessica C Mar
3, Yasuhiro Tomaru
2, Mitsuoki Kawano
2, Piero Carninci
1,2,
Harukazu Suzuki
1,2, Yoshihide Hayashizaki
2,4and Jay W Shin
1,2*Abstract
Background:Changes in environmental conditions lead to expression variation that manifest at the level of gene
regulatory networks. Despite a strong understanding of the role noise plays in synthetic biological systems, it remains unclear how propagation of expression heterogeneity in an endogenous regulatory network is distributed and utilized by cells transitioning through a key developmental event.
Results:Here we investigate the temporal dynamics of a single-cell transcriptional network of 45 transcription factors
in THP-1 human myeloid monocytic leukemia cells undergoing differentiation to macrophages. We systematically measure temporal regulation of expression and variation by profiling 120 single cells at eight distinct time points, and infer highly controlled regulatory modules through which signaling operates with stochastic effects. This reveals dynamic and specific rewiring as a cellular strategy for differentiation. The integration of both positive and
negative co-expression networks further identifies the proto-oncogeneMYBas a network hinge to modulate both
the pro- and anti-differentiation pathways.
Conclusions:Compared to averaged cell populations, temporal single-cell expression profiling provides a much
more powerful technique to probe for mechanistic insights underlying cellular differentiation. We believe that our approach will form the basis of novel strategies to study the regulation of transcription at a single-cell level.
Background
Genetically identical cells exposed to the same environ-mental factors can elicit significant variation in gene expression and phenotype [1]. This variability is sourced to stochasticity in transcription where noise in the expression of one gene is propagated to affect the noisiness of expres-sion in a downstream gene. Noise propagation has been studied extensively where the authors examined sources of noise in a synthetic transcription cascade [2-5]. Such findings provide a solid understanding of noise in an artificially simple setting; however, there is clearly a need to develop experimental and data analysis techniques that permit the study of stochasticity in more complex regula-tory systems, particular in endogenous gene networks.
Recently, the transcriptional regulatory network (TRN) of differentiating THP-1 cells has been characterized by
integration of motif activity profiling, chromatin immuno-precipiation (ChIP) experiments, and by means of a RNAi perturbation matrix [6-8]. These studies demonstrated how the TRN is controlled by multiple regulators that exert their effects through the coordinated action of combinatorial transcription factors to elicit gene expres-sion and cellular differentiation [9,10]. The architecture of the THP-1 regulatory network therefore allows cells to deal with the proper transmission of expression signals or take advantage of noise to modulate expression and thus function. However, these approaches revealed a snapshot of the THP-1 regulatory network while the endogenous gene networks are highly dynamic [1,11]. Therefore, expression profiling of single cells as they undergo cellular differentiation may provide clearer insights into the intri-cate dynamics of expression noise and its transmission to modulate gene expression.
During stem cell differentiation, the dynamic expression in space and time of key regulatory genes govern lineage specification of progenitor cells [11]. In this context, expression noise in transcription factors (TFs) might play * Correspondence:[email protected]
1RIKEN Center for Life Science Technologies, Division of Genomic Technologies, 1-7-22 Suehiro-cho, Tsurumi-Ku, Yokohama 230-0045, Japan 2RIKEN Omics Science Center, Yokohama 230-0045, Japan
Full list of author information is available at the end of the article
an important role in regulating genes involved in develop-ment, stem cell maintenance and differentiation, and cell reprogramming [12-15]. The recent advancements in single-cell polymerase chain reaction (PCR) technology allow one to profile and analyze multiple genes in single cells and thereby provide the means to dissect cellular heterogeneity in various cellular systems. For instance, the multiplex single-cell expression analysis was used to measure cellular heterogeneity in rare populations isolated from different developmental stages [16-18], in cancer tissues [19,20], and cell reprogramming [15,21,22]. With these technical challenges surrounding multiplexed single-cell assays largely resolved, what remains to be explored is how gene expression noise is propagated and used within a defined network.
Therefore, this study describes the temporal dynamics of the THP-1 network in the context of single cells under-going cellular differentiation. Key emphasis is given to stochastic effects of gene expression that can contribute to the regulation of cellular differentiation. Furthermore we establish modular structures of the THP-1 co-expression network and describe the dynamics of regulatory pathways in the context of RNAi-perturbations and transcription factor binding site predictions. The analysis identifies novel inter-dependent regulatory pathways between the transcriptional modules and further identifies a pivotal gene that modulates the maintenance and the differentiation of THP-1 cells.
Results
Single-cell profiling of THP-1 differentiation
Since our aim was to observe temporal variation of the THP-1 network during the differentiation process, we stimulated the THP-1 cells with phorbol 12-myristate 13-acetate (PMA) and manually picked 40 individual cells at eight distinct time points (0 h, 1 h, 6 h, 12 h, 24 h, 48 h, 72 h, and 96 h). This experiment was performed three independent times, resulting in a total of 120 single-cell expression profiles for each time point (Figure 1A). The endogenous control expressions in three experiments were validated and normalized for subsequent analyses (Additional file 1: Figures S1 and S2, Materials and Methods).
The human THP-1 myeloid monocytic leukemia cell line is an ideal model to study the temporal dynamics of single-cells because: (1) the cells in suspension undergo differentiation into a mature monocyte/macrophage-like phenotype upon simulation with PMA [6,23-25]; (2) the gene regulatory networks of differentiating THP-1 cells have been previously established (Additional file 1: Figure S3) [6,8]; and (3) the cells were sub-cloned for their ability to differentiate relatively homogeneously in response to PMA (Figure 1B) [6]. Thus applying micropipette technique together with microfluidic technologies we
performed multiplexed PCR from single cells, allowing the simultaneous profiling 45 TFs represented in the THP-1 network (Additional file 2: Table S1).
THP-1 cells are dynamically regulated during differentiation
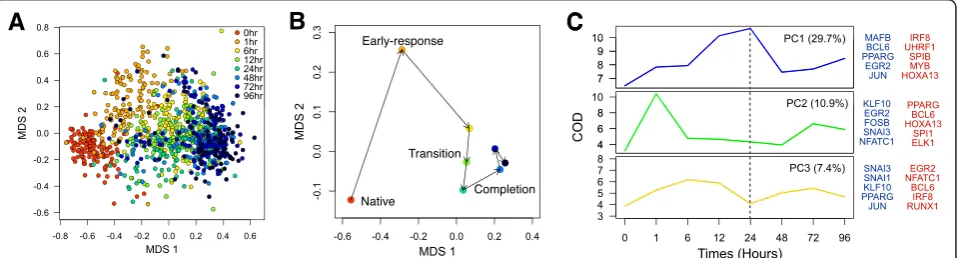
In order to obtain a global perspective on noise in the cell population, single-cell expression profiles for all 45 TFs were reduced to a visualizable space using multiple dimension scaling (MDS) (Figure 2A). In inspecting the structure of MDS-reduced expression data, several important features that correlate with physiological characteristics of the cells can readily be discerned. The spatial progression throughout the differentiation, largely explained by the first axis, is a reflection of post-PMA stimulation in THP-1 cells. The MDS plot revealed wide scattering of individual cells that orderly shifted with time, suggesting that cellular heterogeneity is not random but tightly controlled. To further support this notion, the centroid projection of each time point revealed four distinct stages of the monocyte/macro-phage differentiation: native, early-response, transition, and completion (Figure 2B). The early-response stage is clearly separated from the rest of the centroids, largely explained by the second MDS axis. Interestingly, the cell population coherently transits from 6 h to 24 h and suddenly shifts into a steady (that is, less variable) state, a period when the cells adhere to the dish and completes differentiation [6].
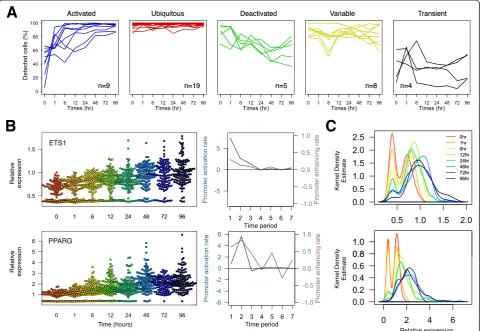
Expression variability during THP-1 differentiation In order to gain greater insights into the contribution towards cellular variation from individual TFs, we analyzed temporal changes in: (1) the number of cells expressing the transcripts; (2) differential TF expression; and (3) noise strength. We observed dramatic changes in the proportion of single cells expressing the transcript throughout the time course (Figure 3A). While 16 out of 45 TFs revealed ubiquitous transcript detection, 11 TFs exhibited‘promoter activation’where the sparsely expressed population ei-ther gradually or rapidly increased the percentage of positive cells throughout differentiation. Conversely, seven TFs showed reduction in the percentage of cells during differentiation.
[image:3.595.57.540.89.295.2]While the proportions of detected cells were temporally changing, the mean expressions of detected cells were also changing, but at a different rate. To explore such differen-tial modes of transcription, we analyzed the changes in cell numbers and their mean expressions between adjacent time points. Two distinct rates for transcript control were identified: (1) differential mean expression of detected cells across two time points, which describes the rate of promoter enhancement per hour; and (2) differential cell numbers across two time points, which describes the rate of promoter activation per hour, where the inducing signal enforced nothing-to-all response on the promoter. Based on this analysis, the PPARG-promoter was enhanced prior to the activation (Figure 3B). The changes in cell
[image:3.595.60.541.544.673.2]Figure 2Temporal dynamics of THP-1 differentiation. (A)The multi-dimensional scaling (MDS) analysis reveals heterogeneous but population shifts in a time-dependent manner throughout the differentiation.(B)The centroids of each time point reveal temporal dynamics of cell populations throughout the time course, shifting from native, early-response, transition, to completion.(C)The coefficient of dispersion (COD) of three principal components (PC) and their variations shows distinct expression variation patterns throughout the time course and the associated TFs (blue TFs = positive contribution, red TFs = negative contribution).
numbers between 0 h and 1 h was small in comparison to the difference in the mean expression in the same time period, which was >1.8-fold per h. This phenomenon suggests that PPARG was readily transcribed from already activated promoters upon PMA induction. However in the subsequent time frame (1 h and 6 h), we observed a significant increase in promoter activation (+5.8% per h) while the difference in expression only increased slightly when compared to the previous period. This suggests a prolonged delay in promoter activation possibly via epi-genetic modification or essential expression of co-factors. In case of ETS1, the overall augmentation in gene expres-sion was largely contributed by promoter activation from the onset of differentiation. These dynamic effects based on single-cell analysis indicate differential regulation of TF activation and TF enhancement on the promoter itself and explain the precise transcriptional regulation throughout the differentiation (Figure 3C).
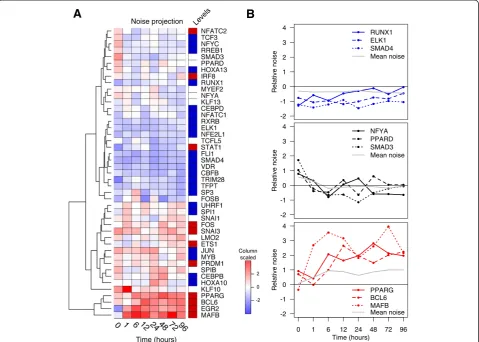
[image:4.595.58.541.90.421.2]with no upstream genes or edge ratio >4 were classified as ‘upstream’, and nodes with edge ratio <0.5, or has twice as many upstream genes as downstream genes, were classified as ‘downstream’. Any nodes falling in between these two ratios were classified as‘midstream’ TFs (Additional file 1: Figure S3). Remarkably, downstream TFs revealed greater temporal noise throughout the differentiation whereas upstream TFs exhibited relatively low noise changes (P value <0.001). PPARG, MAFB, and BCL6, which belonged to the downstream layer, were among the top TFs with the increasing noise over time (Figure 4B). On the other hand, RUNX1, EKL1, and SMAD4, the upstream regulators of the THP-1 network, revealed relatively low variation throughout the differenti-ation. Interestingly, the midstream TFs revealed sporadic noise patterns where the average noise remained relatively still, possibly permitting the buffering of gene expression noise during the differentiation. This suggests that minor variations at the top of the network can propagate
downwards to induce exponential variation to affect the TFs at the bottom of the network in the process of cellular differentiation.
Dynamic rewiring of co-expression network during differentiation
We then asked whether transcriptional relationships could be inferred from TFs with similar variation or noise patterns. At each time point, pairwise correlations were computed for 45 THP-1 TFs across 120 single cells from which we identified co-expressed modules of genes that were likely to be functionally co-regulated. Heat map representations of the topological overlap matrix for time point 0 h, 1 h, 24 h, and 96 h post-PMA induction demonstrate how these modules adopt different expression states during the time course (Figure 5A). The quantifica-tion of correlative edges revealed the highest number of interactions at time point 24 h post induction while the negatively correlated edges were greatest at time point
Time (hours)
Levels
Noise projection
A
B
-2 -1 0 1 2 3 4
Relative noise
RUNX1 ELK1 SMAD4 Mean noise
-2 -1 0 1 2 3 4
Relative noise
NFYA PPARD SMAD3 Mean noise
-2 -1 0 1 2 3 4
0 1 6 12 24 48 72 96 Time (hours)
Relative noise PPARG
[image:5.595.59.539.90.432.2]BCL6 MAFB Mean noise
0 h (Pvalue <0.05, Figure 5B). The differential numbers of regulatory edges indicate dynamic interplay of transcription factors to modulate differentiation, especially at time points 1 h and 24 h post PMA induction, whereas, the negative regulators of differentiation maintained the THP-1
steady state prior to differentiation (0 h). Moreover, the gene-network representations across the time series illustrate dynamic rewiring of transcription factors to establish time-specific network modules (Figure 5C, Additional file 1: Figure S4 for all time points).
EGR2 CBFB FOSB MYB TCF3 TCFL5 MAFB NFYA KLF13 NFATC1 SP3 SNAI3TRIM28 PPARG PRDM1 BCL6 IRF8 KLF10 SPI1 HOXA10 STAT1 ETS1 UHRF1 EGR2 CBFB FOSB MYB TCF3 TCFL5 MAFB NFYA KLF13 NFATC1 SP3 SNAI3 TRIM28 PPARG PRDM1 BCL6 IRF8 KLF10 SPI1 HOXA10 STAT1 ETS1 UHRF1 EGR2 CBFB FOSB MYB TCF3 TCFL5 MAFB NFYA KLF13 NFATC1 SP3 SNAI3 TRIM28 PPARG PRDM1 BCL6 IRF8 KLF10 SPI1 HOXA10 STAT1 ETS1 UHRF1 EGR2 CBFB FOSB MYB TCF3 TCFL5 MAFB NFYA KLF13 NFATC1 SP3 SNAI3 TRIM28 PPARG PRDM1 BCL6 IRF8 KLF10 SPI1 HOXA10 STAT1 ETS1 UHRF1
B
C
0 2 4 6 8 10 12 140 1 6 12 24 48 72 96 0 5 10 15 20 25
0 1 6 12 24 48 72 96
Positive correlation p-value < 0.05
negative correlation p-value < 0.05
Edges
Edges
Time (hours) Time (hours)
0hr 1hr 24hr 96hr
Positive
Negative
0hr 1hr 24hr
SNAI1 TFPTSPI1PRDM1MAFB CD14 ETS1PPARGBCL6 MYBHOXA10RREB1 STAT1 SMAD4 CEBPD SMAD3
IRF8
HOXA13
CD45 VDR UHRF1 TRIM28 TCFL5 CEBPBELK1 FOS FOSB SPIBMYEF2CBFB LMO2RUNX1
FLI1NFYC
NFATC1
TCF3
NFATC2
SP3
KLF13 NFYA SNAI3 EGR2PPARD
JUN RXRB NFE2L1KLF10 SNAI1 TFPT SPI1 PRDM1 MAFB CD14 ETS1 PPARG BCL6 MYB HOXA10 RREB1 STAT1 SMAD4 CEBPD SMAD3 IRF8 HOXA13 CD45 VDR UHRF1 TRIM28 TCFL5 CEBPB ELK1 FOS FOSB SPIB MYEF2 CBFB LMO2 RUNX1 FLI1 NFYC NFATC1 TCF3 NFATC2 SP3 KLF13 NFYA SNAI3 EGR2 PPARD JUN RXRB NFE2L1 KLF10
CD45 TFPTFOSLMO2SPI1 PPARGBCL6 MAFB SNAI3 EGR2 KLF10 NFYC ETS1PPARD
IRF8
UHRF1
VDR MYB
HOXA13
TCF3
TCFL5 SMAD3 RREB1 STAT1 MYEF2 RUNX1 SNAI1SPIBNFATC2 FOSB ELK1
NFATC1
NFYA
SMAD4 CEBPD SP3 FLI1
CD14 KLF13JUNPRDM1 NFE2L1CBFBTRIM28RXRB HOXA10CEBPB CD45 TFPT FOS LMO2 SPI1 PPARG BCL6 MAFB SNAI3 EGR2 KLF10 NFYC ETS1 PPARD IRF8 UHRF1 VDR MYB HOXA13 TCF3 TCFL5 SMAD3 RREB1 STAT1 MYEF2 RUNX1 SNAI1 SPIB NFATC2 FOSB ELK1 NFATC1 NFYA SMAD4 CEBPD SP3 FLI1 CD14 KLF13 JUN PRDM1 NFE2L1 CBFB TRIM28 RXRB HOXA10 CEBPB FOSB
NFATC1MAFB EGR2 KLF10
JUN
PRDM1CD14 SNAI3 SNAI1 KLF13
MYB
CEBPD STAT1 MYEF2 SMAD3NFYCPPARDTCF3 VDR RXRBNFE2L1 SMAD4 HOXA13TCFL5TRIM28 NFATC2 SP3 SPI1
UHRF1SPIBHOXA10 ELK1 BCL6 ETS1
PPARGTFPTRREB1LMO2RUNX1NFYA CD45CEBPB FOSCBFBIRF8 FLI1
FOSB NFATC1 MAFB EGR2 KLF10 JUN PRDM1 CD14 SNAI3 SNAI1 KLF13 MYB CEBPD STAT1 MYEF2 SMAD3 NFYC PPARD TCF3 VDR RXRB NFE2L1 SMAD4 HOXA13 TCFL5 TRIM28 NFATC2 SP3 SPI1 UHRF1 SPIB HOXA10 ELK1 BCL6 ETS1 PPARG TFPT RREB1 LMO2 RUNX1 NFYA CD45 CEBPB FOS CBFB IRF8 FLI1
UHRF1HOXA13MAFB FOSB CD14 EGR2 IRF8NFYC NFYA TCF3 TCFL5SP3
NFE2L1
MYBCBFBVDR CEBPD MYEF2 RREB1
FOS
HOXA10SNAI1PRDM1CD45 LMO2JUN SPI1 ETS1RXRBSPIB TFPT TRIM28 PPARGKLF10 SNAI3 RUNX1 STAT1BCL6 KLF13
SMAD4 SMAD3 NFATC2ELK1NFATC1CEBPB PPARD
FLI1 UHRF1 HOXA13 MAFB FOSB CD14 EGR2 IRF8 NFYC NFYA TCF3 TCFL5 SP3 NFE2L1 MYB CBFB VDR CEBPD MYEF2 RREB1 FOS HOXA10 SNAI1 PRDM1 CD45 LMO2 JUN SPI1 ETS1 RXRB SPIB TFPT TRIM28 PPARG KLF10 SNAI3 RUNX1 STAT1 BCL6 KLF13 SMAD4 SMAD3 NFATC2 ELK1 NFATC1 CEBPB PPARD FLI1
-0.5 0 0.5 1 Correlation coefficient
A
96hr MYB CBFB FOSB EGR2 PPARD FLI1 KLF10 NFATC1 SNAI1 SNAI3 KLF13 SP3 NFYA SPI1 TRIM28 PPARG MAFB BCL6 FOS NFYC CEBPD CEBPB HOXA10 JUN PRDM1 RXRB ETS1 SPIB HOXA13 LMO2 RUNX1 IRF8 STAT1 MYB CBFB FOSB EGR2 PPARD FLI1 KLF10 NFATC1 SNAI1 SNAI3 KLF13 SP3 NFYA SPI1 TRIM28 PPARG MAFB BCL6 FOS NFYC CEBPD CEBPB HOXA10 JUN PRDM1 RXRB ETS1 SPIB HOXA13 LMO2 RUNX1 IRF8 STAT1 MYB CBFB FOSB EGR2 PPARD FLI1 KLF10 NFATC1 SNAI1 SNAI3 KLF13 SP3 NFYA SPI1 TRIM28 PPARG MAFB BCL6 FOS NFYC CEBPD CEBPB HOXA10 JUN PRDM1 RXRB ETS1 SPIB HOXA13 LMO2 RUNX1 IRF8 STAT1 MYB CBFB FOSB EGR2 PPARD FLI1 KLF10 NFATC1 SNAI1 SNAI3 KLF13 SP3 NFYA SPI1 TRIM28 PPARG MAFB BCL6 FOS NFYC CEBPD CEBPB HOXA10 JUN PRDM1 RXRB ETS1 SPIB HOXA13 LMO2 RUNX1 IRF8 STAT1 -1.00 Node color (scaled mean expression)-0.75 -0.50 -0.250.00 0.000.25 0.50 0.751.00
0.18
Node size (noise strength)
[image:6.595.58.540.90.578.2]0.94 1.50 1.83 2.67 6.07
Exploration of gene co-expression network modules Expression noise is mediated by factors that bind at upstream promoter elements or influence the binding of other molecules to cis-regulatory elements within or near the promoter [11]. To describe the impact of expres-sion noise at distinct levels of network organization and their temporal regulation, we analyzed: (1) differential expression analysis; (2) RNAi-perturbation matrix [7,8]; and (3) the transcription factor binding motif analysis [6]. Transcriptional modules are defined by a set of transcrip-tion factors that are strongly correlated with one another [30,31]. Based on this notion, the co-expression network analysis at 24 h revealed two transcriptional modules (Figure 6A). The averaged expression and variation of TFs depicted in each module revealed that module 2 remained steadily low while the variation increased time-dependently. Interestingly, the averaged expression of module 1 collectively increased >2-fold during the differentiation while the variation was vacillating through-out the time series (Figure 6B). It is a commonly held idea that negative-feedback provides a noise-reduction mechanism [1,11,32,33]. This seems to suggest that TFs in module 1 are likely to be involved in negative feedback which has a destabilizing effect, and result in dampened or enhanced expression patterns during the monocyte differentiation.
To better understand the inter-dependencies between the two network modules, we integrated the previously reported RNAi-based perturbation matrix [8]. The same 45 TFs described in this study were systematically knocked down in THP-1 cells and the differential expressions of the same 45 genes were quantified. The integration allowed us to enumerate the number of regulatory edges that were either upstream or downstream for each transcription factor (Additional file 1: Figure S3B). By directly incorp-orating this information, we revealed that the total number of target genes were significantly larger than the total number of targeting genes for module 1, whereas the opposite was true for module 2 (Figure 6C). This difference in the edge ratios further supports the notion that module 1 is regulated by external factors to illicit differentiation. The higher number oftarget genes in respect totargeted genes in module 2 suggests that TFs depicted in module 2 lie higher in the hierarchical structure of the monocyte transcriptional regulatory network and may act as a master modulator of monocyte/macrophage maintenance [11].
The level of noise might also be directly impacted by other factors such as the sequences of the promoter itself. To further exploit the regulatory promoter elements of the modules, we analyzed the over-representation of predicted transcription factor binding sites occurring in the proximal promoter regions of module 1 factors. Considering all
MYB
CBFB
FOSB EGR2
PPARD FLI1 KLF10
NFATC1 SNAI1
SNAI3
KLF13
SP3 NFYA SPI1
TRIM28 PPARG
MAFB
BCL6 FOS
NFYC
CEBPD CEBPB
HOXA10 JUN PRDM1
RXRB
ETS1
SPIB
HOXA13
LMO2
RUNX1
IRF8
STAT1
Module 1
Module 2
A
B
D
AP1 (JUN) KLF family SP3 CEBP family MYB PRDM1 RXRB HOXA family
0 0.5 1.0 1.5 2.0
Module 2 motifs
#
In module 1
-log(p-value)
C
Relative expression
0 1 6 12 24 48 72 96
5 10 15 20 25
30 Module1
Module2
Time (hours)
Module 1 Module 2
Total edges
0 20 40 60 80
100 Out-degree
[image:7.595.59.538.417.672.2]In-degree
potential binding sites for module 2, the motif analysis revealed a significant enrichment of AP1 (JUN) bind-ing sites in the proximal promoter regions of module 1 (P value = 0.017; Figure 6D). Indeed almost all but KLF10 in module 1 exhibited AP1 binding site in the proximal promoter. No significant motifs were found when the analysis was reversed to predict binding sites in module 2.
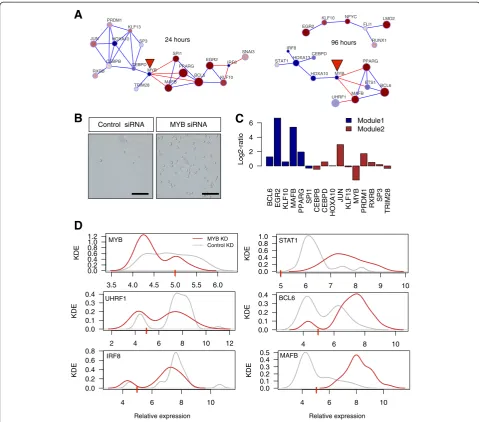
Functional characterization of MYB as a network hinge Stochastiticity in gene expression was originally hypothe-sized to be harmful to cells as it represents an irregularity or lack of stability of gene expression levels [1]. More recently, however, there has been speculation that stochasticity has a constructive role in development and cellular differentiation in higher organisms [34,35]. To uncover the modular basis for stochasticity during THP-1 differentiation, we aggregated both the positive and negative networks at 24 h and also at 96 h post induction (Figure 7A). Prominently at 24 h, the same two modules observed in Figure 6 were separated by negatively corre-lated edges anchored by a key inhibitor of cellular differ-entiation, MYB. MYB is a proto-oncogene protein which consists of a central transcriptional activation domain and a C-terminal domain involved in transcriptional repression [36]. The combined co-expression network demonstrates both active and suppressive role of MYB and suggests the gene as a regulatory hinge that is essential to both monocyte maintenance and differentiation. To confirm this, we suppressed the MYB transcript in THP-1 cells in the absence of PMA. Notably within the first 48 h, siRNA transfected THP-1 cells adhered to the dish, indicative of monocyte/macrophage differentiation (Figure 7B). Moreover, the conventional qRT-PCR expression analysis using bulk mRNA of MYB suppressed THP-1 cells revealed increased expression of pro-differentiation genes such as MAFB, EGR2, and PPARG as compared to control siRNA (Figure 7C).
To further elucidate the transcriptional control of MYB, we performed MYB siRNA transfection followed by single-cell gene expression analysis. As expected, MYB expression was downregulated, but interestingly, the broad MYB expression in the control group was lost in the MYB siRNA transfected group (that is, high noise to less noise) (Figure 7D). In contrast, STAT1 shifted from low noise strength to high noise strength upon MYB suppression, revealing dynamic regulation of MYB, not only in the gene expression but also in the expression heterogeneity required for cellular differentiation. Additional transcription factors such as BCL6 revealed a shift in expression modality (from bi-modal to uni-modal), while MAFB revealed a population shift in expression distribution (uni-modal to uni-modal) upon MYB suppression. Taken together, oligo transfections followed by single-cell gene expression
profiling revealed, for the first time, a highly dynamic regulation of transcription expression and noise patterns, which would not have been possible with bulk culture mRNA expression profiling.
Discussion
Here we applied single-cell expression analysis to investi-gate the population heterogeneity of THP-1 cells undergo-ing differentiation. We characterized 45 previously defined TFs associated with the THP-1 network in terms of their cooperative relationships formed after application of a differentiating agent. We showed that single-cell expressions are noisy but are tightly controlled during the differentiation, leading to both‘noisy’and‘stable’phases based on the single-cell dispersion analysis. Moreover, we revealed time specific co-expression modules that are dynamic and cooperatively regulated by nearby modules and confirmed MYB as a key modulator of THP1 main-tenance and differentiation.
Coordinated and complex transcriptional responses gen-erally involve multiple regulatory interactions organized into gene circuits [1,6,11]. In such an organization, the information sensed by upstream layer of circuits is relayed to activate downstream layer [37]. Here, we revealed that not only do these circuits modulate expression but also noise may be transmitted through the network where the midstream components buffer the noise to elicit gene-specific activation in the network. Interestingly, we revealed that suppression of MYB transcript in THP-1 not only led to cellular differentiation but also induced a substantial increase in expression heterogeneity of STAT1, a downstream transcription factor. Essentially, the inter-connected gene circuits, or network modules, seems to influence the sensitivity to noise. Furthermore, a DNA motif with affinity for the TATA-box binding protein (TBP) has been shown to contribute significantly to high noise [38]. In this respect, the DNA motif with affinity for AP1 was significantly enriched in network modules demonstrating the temporal variations are not contributed individually but via modules in a circuit.
cells respond in proportion to the inducing signal or changes the probability of a stochastic all-or-nothing response in an individual cell.
The intrinsic stochasticity that regulates the biochemical process of producing a single transcript is not the only source of variability in gene expression. Factors such as gene regulatory signals, the abundance of polymerases and ribosomes, and the strength of their binding, availability of TFs, and cell cycle can inevitably change cell size and activity [41,42]. In the present study, extrinsic noise
from transcript abundance was normalized by means of GAPDH expression (Additional file 1: Figure S2) where ubiquitous myeloid-lineage specific TFs such as SPI1 and GAPDH were highly correlated. Moreover, it is understood that before initiating cell differentiation, PMA treatment first induce inhibition of cell growth at G1-phase of the cell cycle [43]. Therefore, the increased fluctuations in gene expression during differentiation provide a mechanism for distinct physiological states, and could therefore increase the precision that is necessary for single-cell analysis.
KLF10 EGR2 PPARG
MAFB TRIM28
MYB
BCL6 SPI1 CEBPD
CEBPB HOXA10 JUN
KLF13 PRDM1
RXRB
IRF8 SNAI3 SP3
A
B
Control siRNA MYB siRNA
C
24 hours
BCL6 EGR2 KLF10 MAFB
PPARG
SPI1
CEBPB CEBPD
HOXA10
JUN
KLF13 MYB PRDM1 RXRB
SP3
TRIM28
0 2 4 6
Log2-ratio
Module1 Module2
4 6 8 10 0.0
0.1 0.2 0.3 0.4
KDE
BCL6
3.5 4.0 4.5 5.0 5.5 6.0 0.0
0.2 0.4 0.6 0.8 1.0 1.2
KDE
MYB
D
2 4 6 8 10 12 0.0
0.1 0.2 0.3 0.4
KDE
UHRF1
4 6 8 10 0.0
0.2 0.4 0.6 0.8
KDE
IRF8
4 6 8 10 0.0
0.1 0.2 0.3 0.4 0.5
KDE
MAFB
Relative expression
5 6 7 8 9 10 0.0
0.2 0.4 0.6 0.8 1.0
KDE
STAT1
MYB KD Control KD
KLF10 EGR2
PPARG
MAFB BCL6 ETS1 CEBPD
LMO2 FLI1 NFYC
RUNX1
HOXA10 MYB IRF8
STAT1
UHRF1 HOXA13
96 hours
[image:9.595.57.537.88.510.2]Relative expression
Conclusion
Taken together, the insights we have obtained in this study are a consequence of analyzing a defined set of transcription factors in parallel at the single-cell level over the time series. It will also be of great interest to integrate the information from correlated expressions with other types of networks (for example, protein-protein interactions). Our high throughput single-cell analysis offers intriguing new insights into the mammalian gene regulatory interaction, and the application of these methods to other biological systems will further clarify the under-lying molecular mechanism controlling cellular main-tenance and differentiation.
Materials and methods
Cell culture and PMA stimulation
THP-1 cell line was sub-cloned by limiting dilution and one clone was selected for ability to differentiated relatively homogenously in response to PMA [6]. THP-1 cells were cultured in RPMI1640 (Invitrogen), 10% FBS, penicillin/ streptomycin (Invitrogen), 10 mM HEPES, 1 mM Sodium Pyruvate and 50 μM 2-mercaptoethanol at 37°C, and 5% CO2. One day prior to PMA stimulation, fresh cultured
medium was replaced. THP-1 cells (2 × 10⁵) were treated with 30 ng/mL PMA (Sigma) over a time course of 96 h. To demonstrate that cells are differentiated into monocytes, flow cytometric analysis with anti-human CD14, CD45, and CD11B antibodies (all Biolegend) were performed at eight time points post PMA induction (Additional file 1: Figure S5).
Single-cell isolation and pre-amplification
Each single cell was isolated by hand-pipetting using micro-dispenser (Drummond) under the phase contrast microscope. Cells after 48 h PMA stimulation were treated with 0.05% Trypsin/EDTA (Wako) for 20 min at 37°C to detach the cells from the dish. All cells were washed with PBS to remove any trace of medium or trypsin/ EDTA. Individually picked single cells were subjected to pre-amplification mixture containing 0.2 mM dNTP, 1.6 mM MgSO4, 0.5μM gene-specific primers, RNase
Free Water (Ambion), 0.6 U RNaseOUT (Invitrogen), and SuperScript III RT/Platinum TaqMix. Pre-amplification was performed at 55°C for 25 min and 95°C for 2 min followed by 18 cycles of 95°C for 15 s and 60°C for 4 min. After pre-amplification, cDNA was diluted 1:4 with RNase Free Water and stored in−80°C until needed.
Real-Time PCR
Real-Time PCR was carried out by the BioMark™Dynamic Arrays of Fluidigm. 1× FastStart Universal Probe Master (ROX), 1× GE Sample Loading Reagent, and each of diluted pre-amplified cDNA was prepared. And 5μL assay mix containing 2.5 μM primer mix, 1.3 μM UPL probe,
1× Assay Loading Reagent, and RNase Free Water was prepared. An IFC controller was used to prime the fluidics array with control line and then with samples and assay mixes. After loading, the array was placed in the BioMark Instrument for PCR at 95°C for 10 min, followed by 40 cycles at 95°C for 15 s, 70°C for 5 s, and 60°C for 1 min.
Single-cell gene expression analysis
Amplification curves derived from the Fluidigm Data Collection Software were filtered using a threshold of 0.65 and Ct threshold mode was set to global. From the initial 1,041 single cells profiled, single cells expressing >2 standard deviations from mean GAPDH expression and mean SPI1 expression were deemed unviable and thus omitted from further downstream analyses. Thereafter, 120 single cells from each time point were randomly selected and fixed for the analyses (120 single cells × 8 time points = 960 single cells). Expression Ct values >36 were set to 40. Then, the relative gene expression was calculated by subtracting Ctgeneby CtGADPHfollowed by
inverse to make the data more intuitive. The inverse-normalized value of 36 is 0.5 (or 5), a cutoff used to determined transcript-positive and -negative single cells (Additional file 1: Figure S1). All of the normalized Ct values are available in Additional file 3.
Multiple dimension scaling (MDS; Pearson correlated) and principal component analysis (PCA) were performed in R [44]. COD was calculated by median absolute variation divided by median. Hierarchical clustering and co-expres-sion matrix between pairs of TFs were tested with Spear-man rank correlation (false discovery rate <0.05). Gene regulatory circuits were illustrated using the RedeR [45] package in R Bioconductor.
For DNA motif analysis, we downloaded the transcrip-tion factor binding site predictranscrip-tions previously calculated as part of the FANTOM4 project [6] using motifs stored in the SwissRegulon database [46,47]. For each promoter, we summed the posterior probabilities of the binding sites predicted for each motif to obtain, for each promoter, its a posteriori number of binding sites of the given motif. Assuming that for a given number of motif across promoters follows a Poisson distribution, we calculated the tail probability of thea posteriorinumber of binding sites for the promoters located at the 5′end of the genes of interest. In practice, we found that the variance of the distribution was slightly lower than its mean, implying that the true distribution is under-dispersed compared to the Poisson distribution, and hence the P values we calculated are conservative.
siRNA transfection and RT-PCR analysis
CAGAGACACUAUA) in Opti-MEM and Lipofectamine 2000 (Invitrogen), according to the manufacturer’s instruc-tions. Forty-eight hours post transfection, either single cells or total RNA from bulk culture were extracted. Oligo-transfected single cells were profiled using the aforementioned methods. As regards to bulk samples, total RNA was isolated using miRNAeasy kit (Qiagen) according to manufacturer’s instructions. Reverse transcription of total RNA was achieved with PrimeScript™ reserve transcriptase (Takara) and random hexamers in according with the manufacturer’s protocol GAPDH mRNA was used as a control for data normalization. PCR amplification was performed on ABI PRISM® 7500 (Applied Biosystems). For amplification, SYBR Premix EX Taq™II (Takara) was used as instructed in the manual. Changes of gene expression were determined using the 2-ΔΔCtmethod [48].
Additional files
Additional file 1:Supplementary information of Figures S1-S5.
Additional file 2: Table S1.List of THP1 network genes and primers sequences with associated UPL probes for specificity.
Additional file 3:Normalized single-cell gene expression dataset (120 single cells × 8 time points).
Abbreviations
ChIP:Chromatin immunoprecipitation; COD: Coefficient of dispersion; DNA: Deoxyribonucleic acid; FANTOM: The functional annotation of the mammalian genome; KDE: Kernel density estimate; MDS: Multiple dimensional scaling; PCA: Principal component analysis; PCR: Polymerase chain reaction; PMA: Phorbol 12-myristate 13-acetate; qRT-PCR: Quantitative reverse transcription polymerase chain reaction; RNA: Ribonucleic acid; RNAi: Ribonucleic acid interference; siRNA: Small interfering ribonucleic acid; TBP: TATA-box binding protein; TF: Transcription factor; TFBS: Transcription factor binding site; THP-1: Human monocytic cell line from an acute monocytic leukemia patient; TRN: Transcriptional regulatory network.
Competing interests
The authors declare no competing financial interests.
Authors’contributions
JWS, MK, and TK designed and performed single-cell experiments. JWS, MdH, and JCM performed bioinformatics analysis. JWS, TK, JCM, and MdH wrote the paper. YT and MK performed perturbation experiments. HS, PC, YH, and JWS conceived the study and oversaw the project. All authors read and approved the final manuscript.
Acknowledgements
This research was supported by research grant for RIKEN Omics Science Center from the Ministry of Education, Science and Technology (MEXT) of Japan to YH and Grant for innovative cell biology by innovative technology from MEXT to YH. Part of this research was supported by research grant for RIKEN Center for Life Science Technologies from MEXT.
RIKEN Omics Science Center ceased to exist as of 1 April 2013, due to RIKEN reorganization.
Author details
1
RIKEN Center for Life Science Technologies, Division of Genomic Technologies, 1-7-22 Suehiro-cho, Tsurumi-Ku, Yokohama 230-0045, Japan. 2
RIKEN Omics Science Center, Yokohama 230-0045, Japan.3Department of Systems & Computational Biology, Albert Einstein College of Medicine, Bronx, NY 10461, USA.4RIKEN Preventive Medicine and Diagnosis Innovation Program, Wako, Saitama 351-0198, Japan.
Received: 29 May 2013 Accepted: 24 October 2013 Published: 24 October 2013
References
1. Kaern M, Elston TC, Blake WJ, Collins JJ:Stochasticity in gene expression: from theories to phenotypes.Nat Rev Genet2005,6:451–464.
2. Blake WJ KAM, Cantor CR, Collins JJ:Noise in eukaryotic gene expression. Nature2003,422:633–637.
3. Ozbudak EM, Thattai M, Kurtser I, Grossman AD, van Oudenaarden A:
Regulation of noise in the expression of a single gene.Nat Genet2002,
31:69–73.
4. Gonze D, Halloy J, Goldbeter A:Robustness of circadian rhythms with respect to molecular noise.Proc Natl Acad Sci U S A2002,99:673–678. 5. Ideker T, Krogan NJ:Differential network biology.Mol Syst Biol2012,8:565. 6. FANTOM Consortium, Suzuki H, Forrest AR, van Nimwegen E, Daub CO,
Balwierz PJ, Irvine KM, Lassmann T, Ravasi T, Hasegawa Y, de Hoon MJ, Katayama S, Schroder K, Carninci P, Tomaru Y, Kanamori-Kayatama M, Kubosaki A, Akalin A, Ando Y, Arner E, Asada M, Asahara H, Bailey T, Bajic VB, Bauer D, Beckhouse AG, Bertin N, Bjorkegren J, Brombacher F, Bulger E,et al:The transcriptional network that controls growth arrest and differentiation in a human myeloid leukemia cell line.Nat Genet2009,41:553–562. 7. Tomaru Y, Nakanishi M, Miura H, Kimura Y, Ohkawa H, Ohta Y, Hayashizaki Y,
Suzuki M:Identification of an inter-transcription factor regulatory network in human hepatoma cells by Matrix RNAi.Nucleic Acids Res 2009,37:1049–1060.
8. Tomaru Y, Simon C, Forrest AR, Miura H, Kubosaki A, Hayashizaki Y, Suzuki M:Regulatory interdependence of myeloid transcription factors revealed by Matrix RNAi analysis.Genome Biol2009,10:R121.
9. Luscombe NM, Babu MM, Yu H, Snyder M, Teichmann SA, Gerstein M:
Genomic analysis of regulatory network dynamics reveals large topological changes.Nature2004,431:308–312.
10. De Smet R, Marchal K:Advantages and limitations of current network inference methods.Nat Rev Microbiol2010,8:717–729.
11. Chalancon G, Ravarani CN, Balaji S, Martinez-Arias A, Aravind L, Jothi R, Babu MM:Interplay between gene expression noise and regulatory network architecture.Trends Genet2012,28:221–232.
12. Swiers G, Patient R, Loose M:Genetic regulatory networks programming hematopoietic stem cells and erythroid lineage specification. Dev Biol2006,294:525–540.
13. Kim J, Chu J, Shen X, Wang J, Orkin SH:An extended transcriptional network for pluripotency of embryonic stem cells.Cell2008,
132:1049–1061.
14. Macarthur BD, Ma’ayan A, Lemischka IR:Systems biology of stem cell fate and cellular reprogramming.Nat Rev Mol Cell Biol2009,10:672–681. 15. Shin JW, Suzuki T, Ninomiya N, Kishima M, Hasegawa Y, Kubosaki A,
Yabukami H, Hayashizaki Y, Suzuki H:Establishment of single-cell screening system for the rapid identification of transcriptional modulators involved in direct cell reprogramming.Nucleic Acids Res2012,40:e165.
16. Guo G, Huss M, Tong GQ, Wang C, Li Sun L, Clarke ND, Robson P:
Resolution of cell fate decisions revealed by single-cell gene expression analysis from zygote to blastocyst.Dev Cell2010,18:675–685.
17. Spike BT, Engle DD, Lin JC, Cheung SK, La J, Wahl GM:A mammary stem cell population identified and characterized in late embryogenesis reveals similarities to human breast cancer.Cell Stem Cell2012,
10:183–197.
18. Moignard V, Macaulay IC, Swiers G, Buettner F, Schutte J, Calero-Nieto FJ, Kinston S, Joshi A, Hannah R, Theis FJ, Jacobsen SE, de Bruijn MF, Gottgens B:Characterization of transcriptional networks in blood stem and progenitor cells using high-throughput single-cell gene expression analysis.Nat Cell Biol2013,15:363–372.
19. Dalerba P, Kalisky T, Sahoo D, Rajendran PS, Rothenberg ME, Leyrat AA, Sim S, Okamoto J, Johnston DM, Qian D, Zabala M, Bueno J, Neff NF, Wang J, Shelton AA, Visser B, Hisamori S, Shimono Y, van de Wetering M, Clevers H, Clarke MF, Quake SR:Single-cell dissection of transcriptional
heterogeneity in human colon tumors.Nat Biotechnol2011,29:1120–1127. 20. Diehn M, Cho RW, Lobo NA, Kalisky T, Dorie MJ, Kulp AN, Qian D, Lam JS,
21. Yoo AS, Sun AX, Li L, Shcheglovitov A, Portmann T, Li Y, Lee-Messer C, Dolmetsch RE, Tsien RW, Crabtree GR:MicroRNA-mediated conversion of human fibroblasts to neurons.Nature2011,476:228–231.
22. Narsinh KH, Sun N, Sanchez-Freire V, Lee AS, Almeida P, Hu S, Jan T, Wilson KD, Leong D, Rosenberg J, Yao M, Robbins RC, Wu JC:Single cell transcriptional profiling reveals heterogeneity of human induced pluripotent stem cells.J Clin Invest2011,121:1217–1221.
23. Abrink M, Gobl AE, Huang R, Nilsson K, Hellman L:Human cell lines U-937, THP-1 and Mono Mac 6 represent relatively immature cells of the monocyte-macrophage cell lineage.Leukemia1994,8:1579–1584. 24. Tsuchiya S, Kobayashi Y, Goto Y, Okumura H, Nakae S, Konno T, Tada K:
Induction of maturation in cultured human monocytic leukemia cells by a phorbol diester.Cancer Res1982,42:1530–1536.
25. Auwerx J:The human leukemia cell line, THP-1: a multifacetted model for the study of monocyte-macrophage differentiation.Experientia1991,
47:22–31.
26. Thiery JP, Sleeman JP:Complex networks orchestrate epithelial-mesenchymal transitions.Nat Rev Mol Cell Biol2006,7:131–142.
27. Suel GM, Kulkarni RP, Dworkin J, Garcia-Ojalvo J, Elowitz MB:Tunability and noise dependence in differentiation dynamics.Science2007,
315:1716–1719.
28. Kittisopikul M, Suel GM:Biological role of noise encoded in a genetic network motif.Proc Natl Acad Sci U S A2010,107:13300–13305. 29. Hornung G, Barkai N:Noise propagation and signaling sensitivity in
biological networks: a role for positive feedback.PLoS Comput Biol2008,
4:e8.
30. Carter SL, Brechbuhler CM, Griffin M, Bond AT:Gene co-expression network topology provides a framework for molecular characterization of cellular state.Bioinformatics2004,20:2242–2250.
31. Segal E, Shapira M, Regev A, Pe’er D, Botstein D, Koller D, Friedman N:
Module networks: identifying regulatory modules and their condition-specific regulators from gene expression data. Nat Genet2003,34:166–176.
32. Becskei A, Serrano L:Engineering stability in gene networks by autoregulation.Nature2000,405:590–593.
33. Paulsson J:Summing up the noise in gene networks.Nature2004,
427:415–418.
34. Hume DA:Probability in transcriptional regulation and its implications for leukocyte differentiation and inducible gene expression.Blood2000,
96:2323–2328.
35. Paldi A:Stochastic gene expression during cell differentiation: order from disorder?Cell Mol Life Sci2003,60:1775–1778.
36. Oh IH, Reddy EP:The myb gene family in cell growth, differentiation and apoptosis.Oncogene1999,18:3017–3033.
37. Raj A, Rifkin SA, Andersen E, van Oudenaarden A:Variability in gene expression underlies incomplete penetrance.Nature2010,463:913–918. 38. Lam FH, Steger DJ, O’Shea EK:Chromatin decouples promoter threshold
from dynamic range.Nature2008,453:246–250.
39. Lim HN, van Oudenaarden A:A multistep epigenetic switch enables the stable inheritance of DNA methylation states.Nat Genet2007,
39:269–275.
40. Sabatino L, Fucci A, Pancione M, Carafa V, Nebbioso A, Pistore C, Babbio F, Votino C, Laudanna C, Ceccarelli M, Altucci L, Bonapace IM, Colantuoni V:
UHRF1 coordinates peroxisome proliferator activated receptor gamma (PPARG) epigenetic silencing and mediates colorectal cancer progression.Oncogene2012,31:5061–5072.
41. Raj A, van Oudenaarden A:Nature, nurture, or chance: stochastic gene expression and its consequences.Cell2008,135:216–226.
42. Huh D, Paulsson J:Non-genetic heterogeneity from stochastic partitioning at cell division.Nat Genet2011,43:95–100.
43. Traore K, Trush MA, George M Jr, Spannhake EW, Anderson W, Asseffa A:
Signal transduction of phorbol 12-myristate 13-acetate (PMA)-induced growth inhibition of human monocytic leukemia THP-1 cells is reactive oxygen dependent.Leuk Res2005,29:863–879.
44. R Development Core Team:R: A language and environment for statistical computing.Vienna, Austria: R Foundation for Statistical Computing; 2008. http://www.R-project.org.
45. Castro MA, Wang X, Fletcher MN, Meyer KB, Markowetz F:RedeR: R/Bioconductor package for representing modular structures, nested networks and multiple levels of hierarchical associations.Genome Biol 2012,13:R29.
46. Pachkov M, Erb I, Molina N, van Nimwegen E:SwissRegulon: a database of genome-wide annotations of regulatory sites.Nucleic Acids Res2007,
35:D127–D131.
47. Pachkov M, Balwierz PJ, Arnold P, Ozonov E, van Nimwegen E:
SwissRegulon, a database of genome-wide annotations of regulatory sites: recent updates.Nucleic Acids Res2013,41:D214–D220.
48. Livak KJ, Schmittgen TD:Analysis of relative gene expression data using real-time quantitative PCR and the 2(−Delta Delta C(T)) Method. Methods2001,25:402–408.
doi:10.1186/gb-2013-14-10-r118
Cite this article as:Kounoet al.:Temporal dynamics and transcriptional control using single-cell gene expression analysis.Genome Biology
201314:R118.
Submit your next manuscript to BioMed Central and take full advantage of:
• Convenient online submission
• Thorough peer review
• No space constraints or color figure charges
• Immediate publication on acceptance
• Inclusion in PubMed, CAS, Scopus and Google Scholar
• Research which is freely available for redistribution