International Journal of Emerging Technology and Advanced Engineering
Website: www.ijetae.com (ISSN 2250-2459,ISO 9001:2008 Certified Journal, Volume 5, Issue 11, November 2015)
8
Defining the Parameters of the Models Depending on the
Temperature of the Vapor Pressure in the Mathematical
Modeling and Calculation of Vapor-Liquid Equilibrium
Algorithmization Multicomponent Mixtures
Yu. Sh. Avazov
1, Yo. B. Kadirov
2, D. P. Mukhitdinov
31,2,3Department of Electronic and Automatic, Tashkent State Technical University, University st.2, 100095, Tashkent city,
Republic of Uzbekistan.
Abstract – In the present study we carried out a comparative analysis of common expressions interconnectedness vapor pressure of pure substances on the temperature and we developed approaches to the identification of the vapor-liquid equilibrium models; It proposed and substantiated the universal characteristics of the corresponding empirical data and models as calculated in terms of line integrals geometric mean of the probability density.
Keywords – vapor-liquid equilibrium, parametric identification, mathematical expression, algorithmization multicomponent mixtures, identification and optimization of polynomial systems.
I. INTRODUCTION
Theoretical and experimental study of the conditions of equilibrium between liquid and vapor in a large number of papers [1 -7].
Methods of calculation of phase equilibria has evolved from graphic and formal mathematical way to represent the data to analytical and numerical methods, using the results of modern molecular theory of solutions.
However, the literature is not enough appreciated the possibility of estimation of parameters of phase equilibrium models in the «liquid-vapor» with regard to the total error in the experimentally determined data, there are no specific instructions for any class of multicomponent mixtures the most effective use of an equation.
II. MATHEMATICAL MODELING
The specifics of the main events (vapor-liquid equilibrium, kinetics, depending on factors, and others). Related to the process of rectification is that the measurement error variables are comparable with each other, and the neglect of some of them resulting in significantly different estimates of parameters of empirical models.
The equilibrium equation for any i - th first component of the mixture has the form [3,4]:
OL i i i i i x f y
where:
i - the activity coefficient, which characterizes the degree of deviation from the ideal real solution; xi- concentration i of the ith component in the liquid phase;
i concentration i- th component in the vapor phase; OLi f - fugacity i- th component in the standard state, or a pure component;
i - coefficient of volatility; P - pressure system.Taking into account that the components of the mixture are in equilibrium under normal conditions, the equation (1) can be rewritten as
0 i i i i
i xP
Py
where: 0 i
P the vapor pressure of the i-th component at equilibrium.
According to the phase rule, the vapor pressure of the pure liquid is an unambiguous function of the boiling temperature, so almost all of the vapor pressure data are in the form of relation
) (T f Pi i
Any correlation between the vapor pressure of the pure substance must take into account the curvilinear TDR depending on I/T, but the most successful correlations are complex algebraic form. Most of the equations for the calculation and correlation of vapor pressure are obtained by integration of the Clausius-Clapeyron
. )
/ 1 (
ln
Z R
H T
d P d
v v vp
International Journal of Emerging Technology and Advanced Engineering
Website: www.ijetae.com (ISSN 2250-2459,ISO 9001:2008 Certified Journal, Volume 5, Issue 11, November 2015)
9
After integration must be selected form the group, depending on the temperature, and the constant of integration is determined by a single point «vapor pressure is the temperature».The number of integration options limited. Nevertheless, the results published in the literature differ sufficiently great diversity. The reason is that in order to achieve greater accuracy every author usually introduces its correction factors.
For the approximation of the experimental data used PT equations of varying complexity and theoretical reasoning. Some of them operate at temperatures well below the normal boiling point of the other - at higher temperatures. Correlations, taking into account the S-shaped, depending on are usually very complicated algebraic form. Universal approaches to describe it is found.
Select the type of the equation depends on the volume and quality of experimental data, as well as the commitment of the author to the different approaches. All correlations proposed in the present time one data PT may be grouped into various groups with their capabilities very similar in each group P-T description data may be grouped into various groups with their capabilities very similar in each group.
Until now widely practiced methods of calculation, which does not take into account the measurement errors in the variables, besides using Riedel equation with known strong correlation between the parameters, in fact reducible to a one-parameter equation Riedel mind.
We estimate refinement, based on the concepts introduced by EIV (errors-in-variables) - models, compared with the method of least squares (MLS).
OLS estimates, orthogonal and the integral method were obtained by standard procedures of optimization.
III. RESULTS OF CALCULATIONS
[image:2.612.48.296.543.718.2]The calculation results are presented in Table I, Table II. TABLE I.
The values of the errors of estimated parameters (sigx=sigy=0.05)
Types of Method errors
MLS Orthogonal method
Integral Method
The average relative error in the parameters
0.2722 -0.1872 0.0279
The average relative error for the module parameters
1.3619 0.6150 0.1216
TABLE II.
The values of the errors of estimated parameters (sigx=sigy=0.5)
Types of errors
Method MLS
Orthogonal method
Integral Method
The average relative error in the parameters
-1.2129 -4.5763 0.3821
The average relative error for the module parameters
14.8895 10.5525 0.4447
Homogenization was carried out both on a vector of parameters and the computation of repeated (number of repetitions is 10).
Numerical experiments demonstrate significant opportunities approaches based on integrated accounting errors (in terms of accuracy of the estimates of the model parameters of balance in comparison with traditional regression methods). As can be seen from the results, the average rate of error of the parameter vector of the orthogonal method is 1.5-2 times lower compared to MNCs and the integral method to order more accurate method of orthogonal regression.
In the present study we carried out a comparative analysis of common expressions interconnectedness vapor pressure of pure substances on the temperature and we developed approaches to the identification of the vapor-liquid equilibrium models; It proposed and substantiated the universal characteristics of the corresponding empirical data and models as calculated in terms of line integrals geometric mean of the probability density.
The purpose of the analysis is to confirm the theoretical calculations designed to assess the likelihood, rationale for choice of equilibrium models and methods for determining their parameters to approximate the amount of available experimental data on the balance of a substance, which is usually known for about ten points with different measurement errors pair of variables.
For a comparative analysis of the models for the approximation of the experimental data, the criteria for their proximity with the experimental data and the methods of parametric identification of selected:
International Journal of Emerging Technology and Advanced Engineering
Website: www.ijetae.com (ISSN 2250-2459,ISO 9001:2008 Certified Journal, Volume 5, Issue 11, November 2015)
10
• as a proximity criteria used regression analysis, themethod of orthogonal regression [8,9], approaches that combine intimacy with the smoothness and the proposed integrated approach to assessing the likelihood [9-11];
• minimizing the corresponding numerical algorithms; • as a real experimental data used thermodynamic
properties of water and separate the organic substances;
• first, the study compiled three programs calculate the parameters correlated Riedel:
using critical pressure Pcand temperature Tc, and a boiling point at atmospheric pressure, bp;
using the critical pressure and temperature, and determines the ratio of θ for all (except critical) experimental points over priced α method of least squares (MLS);
using the critical pressure and temperature, and θ as the three independent parameters of the model on MLS.
[image:3.612.324.568.380.525.2]Verification is carried out according to acetaldehyde (Table III):
TABLE III.
Experimental data for acetaldehyde
№ 1 2 3 4 5 6 7 8
T, oC -56.8 -47.8 -37.8 -31.4
-22.6 -10 4.9 20.2
P,
mm.hg 10 20 40 60 100 200 400 760
In a first embodiment of calculations using the known critical values:
;
15
,
273
2
,
20
bp
T
T
c
188
273
,
15
;
. 760 48004 c
P
Next is the valuation:
c b p T T Tb r
6 ln
42 36
35 b r b r
c
T T
T
)
0838
,
0
ln
(
)
758
,
3
0838
,
0
ln
(
P
cT
br
Where
= Riedel factor at the critical point The parameters of the equation Riedel), ln exp(ln 6 4 3 2
1 Cl T CT
T C C P
P c
Calculated by the empirical relations:
). 758 , 3 ( 0838 , 0 ; 4 ; 758 , 3 067 , 30 3 ; 36 2 ; 35 1 C C C С
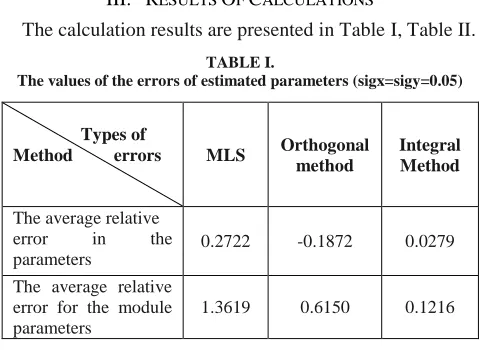
In the second embodiment, the approach is carried out on all points, and the third - the approach is carried out on all the points, only performed three-dimensional minimization. Results of deviations presented in Figure 1, shown in Table 4 below their average, the mean absolute deviation, as well as their rates.
As expected, the effectiveness of the third embodiment in the order of more accurate, however it should be noted that in the first embodiment can be limited only to critical experimental values. It also shows that the normalizing critical values lie on the desired curve - it is put through the appropriate selection of known correlated relationship between the parameters of the equation Riedel, assess critical values less true critical, and the best approximation is achieved at a certain pair of critical pressure and temperature.
Figure1. Deviations from the experimental results, the approximation equation Rigel correlated with parameters depending on the temperature (in degrees. Kelvin): 1 variant - triangles; 2 variant -
[image:3.612.330.559.591.666.2]squares; 3 option - circles.
TABLE IV
The results of the deviations from the experimental data
Options
approximation 1 2 3
The average deviation -6.8587
-3.7790 -0.0541
Mean absolute
deviation 6.8587
6.3098
0.5570
Rate of deviation 23,6 19,96 2,118
International Journal of Emerging Technology and Advanced Engineering
Website: www.ijetae.com (ISSN 2250-2459,ISO 9001:2008 Certified Journal, Volume 5, Issue 11, November 2015)
11
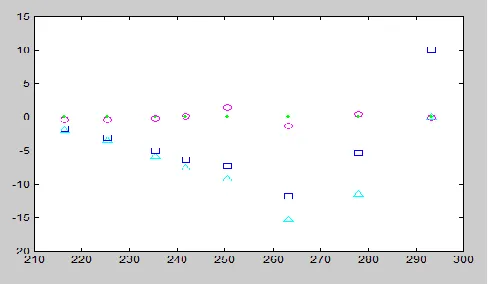
Experimental data on the vapor pressure of the water in this sense the most comprehensive. Data on the vapor pressure of water in the range of from -20ºC to 100ºC at intervals of one degree divided into said parts in a proportion of 1 to 10 at an interval of ten degrees.In fig. 2-4 summarizes the results of variations on the total sample of models tuned to the tutorial sample. In all of them: (1) - the point of examining a sample (2) - in terms of training sample, (3) - equation Riedel using OLS, (4) - equation Riedel using orthogonal method (5) - equation Riedel using integral method, (6) - spline interpolation, (7) - prepared by the interpolation model (8) - dispersion measurement errors T (9) - the variance of measurement error R.
The abscissa shows the conditional number of cases reviewed, and in Figure 3 and Figure 4 on the ordinates reflected logarithms of all the considered parameters.
[image:4.612.330.560.126.278.2]Figure 2. The average deviation between the calculated and experimental data.
[image:4.612.54.283.353.683.2]Figure 3. The average absolute deviation of the calculated and experimental data.
Figure 4. Geometric mean probability density integrated set of experimental points accessories chosen model.
Analyzing the data we can conclude the following. Linear interpolation gives the worst results in all parameters, with a bias toward overstatement. Interpolation by cubic spline function shows good values in the sense of the minimum mean absolute deviation, and in terms of the lack of systematic deviations of forecasts. In addition, there are good values of the geometric mean of the integral probability densities accessories set of experimental points of the selected model. What spline interpolation without leveling better describes the data in the exam means, on the one hand, the high precision measurement of temperature and pressure, on the other hand the lack of compliance with the nature of the empirical relation considered a four parameter equation Riedel, identified by minimizing the sum of squared deviations. Using spline approximation with the selection ratio of PP, reflecting the close relationship with the smoothness by minimizing the integral criterion of proximity has not produced positive results in the overall sample. Geometric mean probability density integrated accessories common set of data points Riedel equation in almost all cases the best.
Now let's analyze Investigated tared on the reference material, which is selected as the equation in the form of Chebyshev polynomials of the number of international systems of equations for the exact description of the thermodynamic properties of water and steam [11]. The calculated value of its thermodynamic quantities agree within specified tolerances, with the data of the International Skeletal table adopted in 1963 (IDC-63).
International Journal of Emerging Technology and Advanced Engineering
Website: www.ijetae.com (ISSN 2250-2459,ISO 9001:2008 Certified Journal, Volume 5, Issue 11, November 2015)
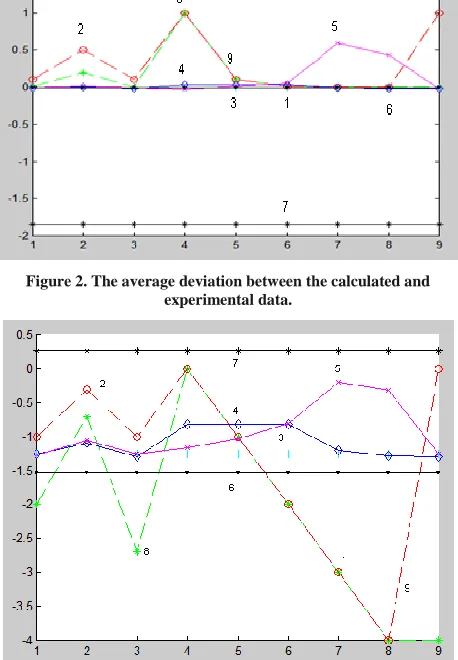
[image:5.612.327.560.119.450.2]12
In the first three charts tabulating the number of pixels is equal to 11 and 21 in the next three (every 5°C). [image:5.612.50.286.158.522.2]Figure 5. The average deviation between the calculated and experimental data.
Figure 6. The average absolute deviation of the calculated and experimental data.
Figure 7. Geometric mean probability density integrated set of experimental points accessories chosen model.
Figure 8. The average deviation between the calculated and experimental data.
Figure 9. The average absolute deviation of the calculated and experimental data.
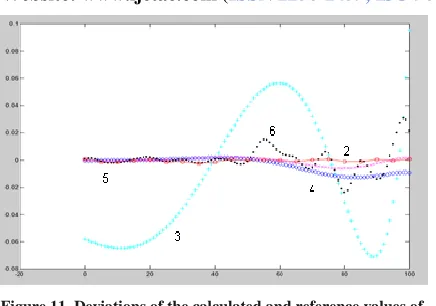
[image:5.612.57.285.450.687.2]The graphs abscissa express logarithms simulated measurement error variances. It is clearly seen that the average deviation between the calculated and reference data, and normal MNC includes a systematic component associated with the failure of methods [12]. Possible deviations of the various models and methods shown in Fig.10 and 11.
Figure 10. Deviations of the calculated and reference values of pressure in mm.Hg versus temperature (grad. ºC) at the error
[image:5.612.329.553.559.680.2]International Journal of Emerging Technology and Advanced Engineering
Website: www.ijetae.com (ISSN 2250-2459,ISO 9001:2008 Certified Journal, Volume 5, Issue 11, November 2015)
[image:6.612.62.280.126.279.2]13
Figure 11. Deviations of the calculated and reference values ofpressure in mm.Hg versus temperature (grad. ºC) at the error variance 0.001.
IV. CONCLUSION
Comparative analysis allows the basis of the resources of empirical data (the amount of experimental data, the accuracy of the instrument and measurement methods), computing resources (technical means, the availability of applications and system software) and target calculation reasonably choose the model of balance and methods for determining their parameters to approximate the existing volume experimental data on the equilibrium of a substance, which is usually known for about ten different points with a pair of variable measurement errors.
REFERENCES
[1] Knapp H., Oellrich L., Plcker U.J, Prausnitz J.M., 1992. Vapor-Liquid Equilibria for Mixtures of Low-Boiling Substances. Berlin: DECHEMA.
[2] Gibbs D.V., 1982. Thermodynamics. Statistical mechanics. Moscow: Nauka.
[3] Wilson J.M., 1985. Fluid Phase Equil. New Jersey: A.I.Ch.E. Volume 24, № 1-2.. - PP. 77-85.
[4] Hirata M., Ohe S., Nagahama K., 1995. Computer Aided Data Book of Vapor - Liquid Equilibria. Amsterdam: Etc.-Elsevier.
[5] Kvasnikov I.A., 2002. The theory of equilibrium systems. Moscow: Thermodynamics, Volume 1.
[6] Hartmann T.N., Kalinkin V.N., Shumakova O.P., 2002. The solution of inverse problems in the identification of empirical models predict the saturated vapor pressure of individual substances (deterministic approach). Moscow: High School.
[7] Hartmann T.N., Kalinkin V.N., Shumakova O.P., 2002. The solution of inverse problems in the identification of empirical models predict the saturated vapor pressure of individual substances (deterministic approach). Moscow: High School.
[8] Yusupbekov N.R., Mukhitdinov D.P., Sadykov F.W., Nuritdinov Sh.N., 1982. Estimation of the model parameters with random dependent and independent variables. Tashkent: Fan. № 10. -PP.12-14.
[9] Nuritdinov Sh., Mukhitdinov D.P., Odilov A.S., Tursunov N., Shaumarov B.M., 2009. Parameter estimation of linear models based on cumulative error method «NORMAL». Tashkent: Chemical technology. Control and management.
[10] Yusupbekov N.R., Mukhitdinov D.P., Nuritdinov Sh., Shaumarov B.M., 2010. Calculation of interphase balance on the basis of models with errors in variables. Tashkent: Procedings of Sixth World Conference on Intelligent Systems for Industrial Automation, WCIS - 2010. -PP.145-149.
[11] Rivkin S.L., Alexandrov A.A., 1980. Thermal properties of water and steam. - Moscow: Energy.