Munich Personal RePEc Archive
The Occupations and Human Capital of
U.S. Immigrants
Schoellman, Todd
Clemson University
23 March 2009
Online at
https://mpra.ub.uni-muenchen.de/14236/
The Occupations and Human Capital of U.S.
Immigrants
∗
Todd Schoellman
†March 23, 2009
Abstract
This paper estimates the multi-dimensional human capital endowments of im-migrants by characterizing their occupational decisions. This approach allows for estimation of physical skill and cognitive ability endowments, which are difficult to measure directly. Estimation implies that immigrants as a whole are abundant in cognitive ability and scarce in experience/training and communication skills. Coun-terfactual estimates of the wage impacts of immigration are skewed: the largest gain from preventing immigration is 3.2% higher wages, but the largest loss is 0.3% lower wages. Crowding of immigrants into select occupations plays a minor role in explain-ing these impacts; occupations’ skill attributes explain the bulk.
∗Thanks to Curtis Simon, Kevin Murphy, Lutz Hendricks and seminar participants at the Clemson Bag
Lunch, UNC - Chapel Hill, and the 2009 Econometric Society Winter Meetings for helpful comments on early work. Also, thanks to Sherry Meador for research assistance and to Tom Mroz for generous advice and use of computational resources. The usual disclaimer applies.
†Address: John E. Walker Department of Economics, Clemson University, Clemson, SC 29642. E-mail:
1
Introduction
After reaching an historic low in 1970, the immigrant share of the U.S. population has risen steadily. Today there are four times as many immigrants as 1970, comprising 12.6% of the population.1 The boom and bust cycle of immigration has led to renewed interest in its
effects on the United States, particularly its effects on labor market outcomes for native workers.
A major focus of the existing research is on the skills of these immigrants. If workers with different skill sets are imperfect substitutes in production, and immigration changes the aggregate supply of workers with different skill sets, then immigrants affect relative wages in the economy. Card (2001) looks at how immigrants affect the relative supply of six broad occupation groups and estimates an upper bound for wage losses of 1-3%; Borjas (2003) looks at how immigrants affect the relative supply of forty experience-schooling categories and estimates an upper bound wage loss of 8.9%. In both cases, losses are concentrated among the low-skilled workers and less prevalent among the high-skilled workers.
In this paper I estimate the multi-dimensional human capital endowment of immigrants from different countries using their observed occupational choices. An individual’s occupa-tion reveals a great deal of informaoccupa-tion about their likely skills: their educaoccupa-tion, cognitive ability, training, physical strength, coordination, and so on. By observing the occupational choices of many immigrants from a single country, it is possible to quantify this informa-tion. The primary advantage of inferring skills is that I can estimate endowments of skills that are difficult to measure directly: here, cognitive ability and physical skills. It is then possible to estimate the importance of immigration to the aggregate supplies of these skills, and evaluate the wage effects of immigration in a more multidimensional skill space.
To quantify the information available in occupational choices, I present a model of labor markets similar to Lazear (2003). Human capital is a vector of different attributes such as physical skills, education, or cognitive ability. Workers have heterogeneous endowments of human capital drawn from distributions that vary by their country of birth. Occupations are differentiated by how intensively they use each of the available skills. Markets are competitive, so occupations offer higher wages to workers with higher endowments of the skills they use intensively. Workers respond to these wages by sorting into occupations that use their abundant skills intensively.
I estimate workers’ propensity to choose occupations as a function of the skill intensity characteristics of the occupations. Data on adult immigrants and their occupational choices
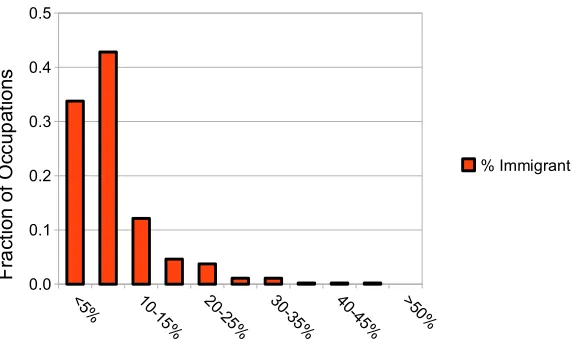
is drawn from the 2000 U.S. Census, which offers a large, representative sample. Figure 1 is a histogram showing that immigrants’ occupational choices are likely to be informative. It groups occupations into bins by the fraction of their workforce that is foreign-born. Immigrants are 8.6% of the sample, but the fraction foreign-born in a given occupation ranges from 0.6% to 46%.
<5% 10-1 5% 20-2 5% 30-3 5%
40-45% >50%
[image:4.612.159.445.195.373.2]0.0 0.1 0.2 0.3 0.4 0.5 % Immigrant F ra c ti o n o f O c c u p a ti o n s
Figure 1: Fraction of Workers Foreign Born, by Occupation
Data on the skill characteristics of occupations is drawn from the O*NET 12.0 database, the successor to the older Dictionary of Occupational Titles (DOT).2 From the over 250
occupation attributes I construct skill intensity measures for five dimensions of skills: ed-ucation, training and experience, cognitive ability, physical skills, and language and com-muncation skills. Using different assumptions on the underlying distribution of skills for immigrants I show that they are broadly abundant in cognitive ability and scarce in com-munications skills and training and experience. There are interesting composition effects underlying these aggregate measures: immigrants from developing countries tend to have more physical skills, and unauthorized immigrants have much lower cognitive ability, for instance.
The worker’s occupational decision is embedded into a tractable general equilibrium model, allowing for counterfactual experiments simulating the outcomes that would have
prevailed in the absence of the large increase in immigration. The model allows for full adjustment of American workers across occupations to the extent that their skills and tastes make a change desirable in the counterfactual experiment. The model also accounts for the impact of immigration on the prices of various goods and how that impacts the cost of workers’ consumption bundles.
The estimated wages are centered on a median outcome of slightly lower real wages in the absence of immigration, but the distribution is highly skewed. The median occupation would offer 0.1% lower wages in the absence of immigration. However, the largest loss from immigration, 0.3%, is an order of magnitude smaller than the largest gain of 3.2%. Occupations intensive in cognitive ability and occupations that are unintensive in every skill would generally have seen higher wages, while those intensive in communications would have seen lower wages. The number of immigrants in the occupation’s workforce has a very small effect once the potential reallocation of American workers is considered. Broadly, the results are consistent with the idea immigration generally has small effects except for certain skill groups. The skewed distribution suggests political economy stories for opposition to immigration.
A recent related literature has used O*NET data to study the differences in the interac-tivity and communications intensity of the chosen occupations of Americans and immigrants (Peri and Sparber Forthcoming, Peri and Sparber 2008). Borjas (2005) showed that foreign students entering U.S. PhD programs tend to specialize in less communicative fields and have subsequent effects on wages for graduates of those fields. This paper finds similar results for the impact of communications intensity, but also estimates the impact along other skill dimensions, finding that cognitive ability is quite important, for instance.
The paper proceeds as follows. Section 2 presents the model. Section 3 illustrates the main properties of the model and the assumptions under which it is estimable. Section 4 introduces the data and estimates the human capital endowments of immigrants. Section 5 conducts the experiments using measured skills. Section 6 concludes.
2
A Model of Labor Markets with Many Skills
2.1
Workers and Human Capital
The model is a static representation of the U.S. labor market. There is a unit continuum of workers born in one of I different countries, with mass ηi born in country i. One of these
Workers have two sources of heterogeneity. First, they have idiosyncratic tastes for each of the J different occupations in which they can work; denote their tastes by ε = (εj)J
j=1.
Tastes are assumed to be draws from a common distribution with cdf G(ε), defined on (0,∞)J. Second, they have idiosyncratic skill endowments, H. H is an S-dimensional
vector rather than a scalar, H = (h1, h2, ..hS). Each s denotes a specific type of human
capital, which I call a skill, although it may also include abilities, training, or any of the other common notions of human capital. Human capital endowments are drawn from a distribution that varies by country of birth, with conditional cdf F(H|i). This distribution is the object of interest. Skills may vary by country of birth due to differences in early lifetime environments or due the effects of self-selection and U.S. policy selection acting on the pool of foreign-born workers. Let F(H) denote the unconditional distribution in the population. Both the conditional and unconditional distributions are defined on (0,∞)S.
In choosing their occupation, workers take into account both the wages they will earn and their tastes for the work they will be asked to perform. Taste draws are normalized to represent compensating wage differentials, and workers maximize the weighted product of wages and tastes,
φlog(Wj(H)) + log(εj) (1)
As long asF andGare both continuous, this problem will generally have a unique solution. Let the indicator dj(H, ε) be a dummy variable taking a value of 1 if j is the solution to
this problem and a value of 0 otherwise. Workers inelastically supply a single unit of labor to their chosen profession. They spend their wages on consumption C(H, ε).
2.2
Occupations and Firms
Each of the J occupations in the economy uses all the available skills of workers, but occupations vary in how intensively they use the skills. Occupation j has skill intensity parameters (ωj
s)Ss=1. A worker employed in this occupation produces output:
AjΠSs=1(hs)ω
j s
where Aj is occupation j’s general productivity which affects all workers equally.3 ωjs is
occupation j’ss-intensity, the rate at which it uses a worker’s endowment of skill s.
The output of each occupation is a differentiated intermediate commodity used in pro-ducing the aggregate final goods bundle. The economy has a large number of price-taking firms. Firms specialize in hiring workers in a single occupation and producing the differen-tiated output specific to that occupation. For example, law firms hire lawyers and produce legal services. Firms hire Lj(H) workers of type H at the prevailing wage Wj(H). They
sell the output in a competitive market at price Pj. Their hiring and production decisions
maximize profits for each possible type of labor they can hire:
PjAjLj(H)ΠSs=1(hs)ω
j
s −Lj(H)W(H) (2)
Yj =R
Yj(H)dF(H) is the total production of occupational output j.
Finally, there exists a single price-taking final goods producer. The producer faces prices
Pj and purchases quantities of occupational outputs Xj. It aggregates the occupational
outputs using a CES production function with elasticity of substitution ψ. It sells its output Y to consumers. The price of the final good is normalized to be the numeraire of the economy. Then the final goods producer maximizes profits:
" J X
j=1
(Xj)1−1/ψ
#ψ/(ψ−1)
−
J
X
j=1
XjPj (3)
2.3
Equilibrium
For the purposes of conducting counterfactual experiments, it is necessary to define the equilibrium conditions of the economy. There are three sets of market clearing conditions for this economy: one condition for output, one condition for each of the occupational goods markets, and one condition for each type of human capital. They are given by:
Y =
Z Z
c(H, ε)dF(H)dG(ε) (4)
Xj =
Z
Yj(H)dF(H) ∀j (5)
Lj(H) =
Z
dj(H, ε)dF(H)dG(ε) ∀j, H (6)
An equilibrium in this economy is a set of prices (Pj, R, W(H)), allocations for the
workers, (c(H), dj(H, ε)), allocations for intermediate goods firms, (Lj(H), Yj(H)), and
allocations for the final goods producer (Y, Xj) that satisfy the following conditions:
2. Taking prices as given, intermediate firms maximize profits, (2).
3. Taking prices as given, the final goods producer maximizes profits, (3)
4. Markets clear, (4) - (6).
3
Equilibrium Predictions
The equilibrium has two main predictions which are useful for the results that follow. First, labor market outcomes are characterized by specialization driven by endowments, similar to the Heckscher-Ohlin theory of trade. Workers who are more skill s-abundant are more likely to choose occupations that are s-intensive. The random draws of preferences make the results easier to characterize by changing binary outcomes to continuous probabilities of choosing occupations. Further, the random draws suggest a way to estimate the human capital endowments using logits. The second prediction is that aggregate prices and wages are affected by the aggregate supply of different combinations of human capital. This result gives the counterfactual experiments their interest, by linking the wage effects of immigrants to their impact on the aggregate skill distribution.
3.1
Allocation of Workers to Occupations
In equilibrium, the wage offered to worker H if she chooses occupation j is given by:
Wj(H) =PjAjΠS
s=1(hs)ω
j
s (7)
Workers choose the occupationj that maximizes the product of wages and the idiosyn-cratic preference for occupation j. I rewrite this as maximization in logs:
φlog(Aj) +φlog(Pj) +
S
X
s=1
φωsjlog(hs) + log(εj)
This discrete choice equation can be estimated under a variety of assumption on the cdf’s F and G. However, throughout this paper I specialize to a particular choice for G, given in Assumption 1.
Assumption 1 – Distribution of Preferences
The extreme value distribution means that the problem fits in the probabilistic choice framework or random utility model of McFadden (1974). It allows for clean propositions about the behavior of the model to motivate the estimation. However, the driving consid-eration here is computational burden. Logit models are well-known to be more practical than alternatives such as multinomial probits for estimation with large sample sizes or large number of choices; I have both. Additionally, since I consider mixed as well as conditional logits in Section 4, I can test whether the usual restrictions of the conditional logit (includ-ing IIA) bind here. Given a worker’s human capital H, the likelihood that worker chooses occupation j′ is given by:
q(j′|H) =
h Pj′
Aj′
ΠS s=1hω
j′ s s iφ PJ j=1 h
PjAjΠS s=1hω
j s
s
iφ (8)
Alternatively, the probability that a worker with human capital H chooses j over j′ is given by [Wj(H)/Wj′
(H)]φ. Hence, φ indexes the relative importance of pecuniary and
non-pecuniary factors for occupational choices. For φ = 1, workers are twice as likely to choose a job that pays twice as well. Asφ becomes larger, a given wage difference becomes more important and the higher-paying occupation is increasingly likely to be chosen. One convenient result of using the logit framework is that it is straightforward to give the comparative statics results. For this model the key comparative static is how changes in a worker’s skill abundance affects her probability of matching in each of theJ occupations.
Proposition 1 – Abundance-Intensity Matching
A marginal increase in log(hs) makes a worker more likely to work in occupations that are
more s-intensive than the expected local alternative and less likely to work in occupations
that are less s-intensive than the expected local alternative.
The proposition comes directly from the usual marginal effects equation in a conditional logit model.4 It is the analogue to a comparative advantage in trade: an increase in s
-abundance makes a worker more likely to choose s-intensive occupations. With multiple choices and idiosyncratic preferences, an occupation iss-intensive if its intensity parameter
ωj
s is higher than the probability-weighted local alternative for a given worker.
For a marginal change it is possible to hold prices and wages constant. An important and related question is what would happen to prices and wages if all workers became more
4The exact equation is ∂q(j′|H)
∂log(hs)=φq(j
′|H)hωj′
s − PJ
s-abundant. Proposition 1 is inherently partial equilibrium, so it offers little guidance to these questions. The next section provides a general equilibrium result.
3.2
Prices and Wages in General Equilibrium
The wages offered to workers who choose two different occupations will in general depend on the prices offered for the output of those occupations, as can be seen by equation (7). Prices are determined in general equilibrium to allocate labor across occupations in a way that is consistent with the final goods producer’s demand given his CES production function. The primary determinant of the prices is the abundance of different types of skills. One would expect that an abundance of skill type H would lower the prices and wages of occupations in which H-endowed workers have a comparative advantage. In the the case where all workers have the same human capital vectorH, this is easily shown. The relative prices of any two goods in this economy are given by:
Pj
Pj′ =
" AjΠS
s=1hω j s
s
Aj′
ΠS s=1hω
j′
s
s
#−(1+φ)/(ψ+φ)
(9)
Proposition 2 follows directly from equation (9).
Proposition 2 – Skill Abundance, Prices, and Wages
Suppose there are two economies: in the former, all workers have human capital H, while
in the latter, all workers have human capital H′. Let workers with human capitalH have a
comparative advantage in occupation j instead of j′, in the sense that ΠSs=1h ωsj s ΠS
s=1h ωsj′ s
> ΠSs=1(h′s)ω j s ΠS
s=1(h′s)ω j′
s
.
Then if technologies Aj are the same in the two economies, the relative prices and wages
of j will be lower in the economy with human capital H than in the economy with human
capital H′.
Aggregate skill abundance affects wages and prices. Since immigrants have different skills than the average American-born workers, they affect the aggregate skill abundance in the U.S. and hence wages and prices.
4
Empirical Strategy
estimate the impact of immigrants on wages. But for several measures, such as physical skills or cognitive ability, there is little or no information. Instead, I use the model to estimate the implied human capital endowments of workers. The U.S. Census gives occu-pational choices for large samples of immigrants from many countries. I combine this data with the O*NET database, which contains a wealth of information on the characteristics of occupations. It is possible to infer the skill endowments of workers from a given country by measuring the skill intensities of the occupations they do and do not choose. For measures of human capital where proxies are available, I use those proxies as an exogenous check on my constructed measures. I also show that the model-generated wages provide a reasonable match to the data, suggesting that the model is measuring the wage mechanism.
4.1
Data
The data for this project are taken from two sources. Data on the occupations and charac-teristics of immigrants come from the 5% sample of the 2000 U.S. Census, drawn from the IPUMS-USA system (Ruggles, Sobek, Alexander, Fitch, Goeken, Hall, King, and Ronnander 2004). The Census asks every respondent to list their country of birth. For privacy reasons, it aggregates this data so that no birthplace with fewer than 10,000 im-migrants is reported separately. After aggregation, there are observations for 131 different birthplaces, including the United States. Some of the birthplaces are nonstandard; for in-stance, there are response categories for Czechoslovakia, the Czech Republic, and Slovakia, since immigrants may have departed before or after the split. I preserve every statistical entity which is separately identified, and refer to them as countries as a shorthand.5
The reason for focusing on country of birth is to estimate the results of different environ-ments and sorting processes. To ensure that workers are exposed to their birth-country’s environment, I use only workers who immigrate at age 18 or later. Other immigrants have endowments that are plausibly a mixture of birth country and U.S. environments. I also include only those who worked in the previous year and are no older than 65. The re-sulting sample is quite large, with half a million immigrants and five million Americans; there at least 139 workers from every country. Finally, the Census provides information on the occupation of workers based on the Standard Occupation Classification (SOC) system, although they merge some occupations together. The Census version of the SOC includes 476 occupations.
Data on the underlying characteristics of occupations are derived from the O*NET database version 12.6 The O*NET database project is the continuation of occupational
characteristic descriptions that used to be provided in the Dictionary of Occupational Ti-tles (DOT), which was last updated in 1991.7 It is carried out in partnership with the
U.S. Department of Labor. The database includes information on six broad aspects of occupations: their worker characteristics, worker requirements, experience requirements, occupational requirements, workforce characteristics, and occupation-specific information. The O*NET database includes information on 812 SOC occupations. I use the provided crosswalk to merge O*NET information into Census occupation codes. When two or more occupations are merged I weight their underlying characteristics using the employment weights taken from the May 2004 Occupational Employment Statistics Survey from the BLS; earlier surveys did not measure employment for some of the necessary disaggregated statistics.8 There are 453 matched occupations with all the necessary information.
The O*NET database contains data on over 250 attributes for each occupation, rated either by professional analysts or current incumbents to the occupation. Some of these attributes are not useful for the task at hand (exposure to radiation in the job, or artistic interest of the workers). After removing these, there is still a large number of detailed, highly correlated attributes (including ability requirements for four different measures of vision: near, far, night, and peripheral). Rather than work with these many attributes from the bottom up, this paper takes a top-down approach. The goal is to measure broad dimen-sions of skill intensity and skill endowment. The previous literature has focused mostly on education, experience, and linguistic skills; the O*NET database provides sufficient infor-mation to pursue these dimensions here. To these, it adds enough attributes on cognitive ability and physical skill intensity to measure skills along these two new dimensions. There is not enough information to measure other potentially relevant dimensions, such as ability to speak multiple languages or internal motivation.
For each skill dimension I select between seven and twenty-eight attributes in the O*NET Database. I treat these attributes as proxies for the true underlying skill intensity. Education intensity is constructed using data on requirements for knowledge of subjects taught primarily in high school and college. Experience/training intensity is constructed using data on requirements for training done in different contexts and observed experi-ence levels. Cognitive ability intensity is constructed using measures of ability to reason
6Occupational Information Network (O*NET) and US Department of Labor/Employment and Training Administration (USDOL/ETA) (2007).
and think originally. Physical skill intensity is constructed using measures of strength, co-ordination, and dexterity; it measures physical skills rather than pure physical strength. Communication intensity is constructed using measures of frequency and types of commu-nication required. Appendix A provides further details. I use principal component analysis (PCA) to extract the first principal component, the one-dimensional variable that captures the highest fraction of the variation in the set of proxies. The first component normalized to lie on the [0,1] interval is used as ωsj for the rest of the paper.
I provide three checks on the constructed intensity measures. Tables 7 - 11 provide the comprehensive list of data used to construct each skill intensity, as well as the highest and lowest scoring occupations along each dimension. Visual inspection suggests the rankings of occupations are reasonable. Section 4.2 shows that workers’ observable proxies for skill endowment correlate well with the skill intensities of their chosen occupations, i.e., educated workers choose occupations identified by this process as education-intensive. Section 4.4 shows that the skill intensities lead to reasonable model-predicted wages, and that the main qualitative results are robust to many details of the construction of the ωj
s.
4.2
Checks on Intensity Measures
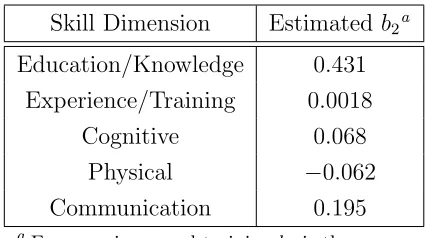
According to Proposition 1, workers who are more s-abundant should choose occupations that are s-intensive. Here, I test whether the prediction holds using the constructed mea-sures of skill intensity. The Census provides some proxies for the skill endowments of workers. I implement the test by regressing:
ωsj =b1+b2h˜s+e
where ωj
s is the constructed skill intensity of the worker’s chosen occupation and ˜hs is the
proxy for skill endowment. I then test whether b2 >0.
Table 1: Check on Measured Skill Inten-sity
Skill Dimension Estimated b2
a
Education/Knowledge 0.431
Experience/Training 0.0018
Cognitive 0.068
Physical −0.062
Communication 0.195
a
For experience and trainingb2 is the marginal effect of an additional year of potential experience. For all other variables it is the estimate of the highest category, with the lowest category omitted.
use only foreign-born workers.
Table 1 gives the results. With the large sample, every variable is statistically significant. For communication and education, the effect is also large: these are the two best proxy measures, used fruitfully in the literature. The other coefficients are smaller. All the coefficients have the right sign except for physical disability. This sign may be due to a reverse causality problem: workers with more physically demanding occupations may also be more likely to suffer disabilities from their work.
From these tests I conclude that the constructed measures of skill intensity are reason-able. However, the data limitations for information on the skills of workers is binding. In the next two sections, I use the theory to back out the implied skill endowments.
4.3
Estimation as a Conditional Logit
The main object of interest here is F(H|i), the conditional distribution of human capital given country of birth. To make progress, I have to make assumptions about the distribution ofF. The simplest assumption and estimation is that all workers from a given country have the same human capital endowment, with different occupations for workers from countryi
arising only because of taste differences. Under this assumption equation (10) simplifies to:
q(j′|i) = exp
h
φlog(Pj′
) +φlog(Aj′
) +φPS
s=1ωj
′
s log(¯his)
i PJ
j=1exp h
φlog(Pj) +φlog(Aj) +φPS
s=1ω
j
slog(¯his)
This function has the form of a conditional logit (McFadden 1974). As is standard for a con-ditional logit, it is not possible to estimate a full set of prices and skill endowments because of collinearity. However, I can identify a set of related parameters: φlog(Pj) +φlog(Aj) +
φPS
s=1ωsjlog(¯hU Ss ) for each occupation, and φlog(¯his)−φlog(¯hU Ss ) for every country and
skill. Note that the second set of estimated parameters is a constant times the log of the skill ratio between the average immigrant and the average American, which is exactly the object of interest. Additionally, I restrictφlog(P453)+φlog(A453)+φPS
s=1ωs453log(¯hU Ss ) = 0. The
choice of numeraire has already pinned down prices, so this normalization pins down the levels of the A through setting A453.
Estimation is performed via maximum likelihood. The likelihood ratio index for the test comparing the model to an alternative specification with only occupation-specific dummies is 0.00464. In the next section I show how to use the out of sample wage predictions to pin down φ and to test the fit of the model.
4.4
Estimates and Wage Comparisons
The model estimates the probability that workers born in country i choose occupation j
as a function of occupation j’s technological intensity characteristics, implicitly assuming that better matches PS
s=1ωsjlog(his) result in higher wage offers, leading to the observed
occupational choices. As a check on the fit of the model and the constructed measures of skill intensity, I compare actual wage differences to the normalized, model-predicted wage difference φlog(Wi,j)− φlog(WU S,j). For the data I use average log-wages for country
of birth-occupation cells with 30 or more workers, estimated from the 2000 U.S. Census; using cells with 5 or more workers yields similar but slightly noisier results. There are 3,483 remaining data points in the sample. φ is set to 6.04 for the rest of the paper so that the variance of within-occupation wage differences is the same in the model and the data. Recall that φ is the parameter governing the relative importance of pecuniary to non-pecuniary factors; this value implies that a worker is 99% likely to choose a job that pays twice as well.9
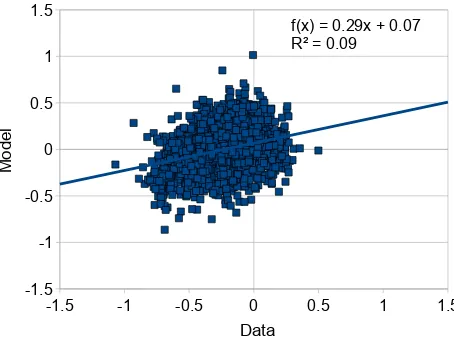
Figure 2 plots the model-implied versus data wage differences. The raw correlation is 0.30. Interpreted as a regression, the model-predicted wages are a statistically significant regressor accounting for 9% of the total variation. A useful comparison is the predictive
power of development status of the immigrant’s birth country. The log of GDP p.c. dif-ferences between the birth country and the U.S. predicts only 1.9% of the wage variation, consistent with Hendricks (2002). A regression with a full set of 130 country of origin dum-mies accounts for 26% of the variation, while a regression with a full set of 453 occupation dummies accounts for 33% of the variation.
-1.5 -1 -0.5 0 0.5 1 1.5 -1.5
-1 -0.5 0 0.5 1 1.5
f(x) = 0.29x + 0.07 R² = 0.09
Data
M
o
d
e
[image:16.612.184.411.194.366.2]l
Figure 2: Model-Predicted and Actual Wage Differences
That a univariate predicted wage derived from the model and constructed intensity scores predicts 9% of actual wage variation and outperforms GDP p.c. by a factor of almost 5 suggests the model is capturing information about the skills and wages of immigrants. Using wages as an out of sample check also provides a simple metric to compare alternative schemes for constructing the skill intensity measures that are used as data in the analysis. I experiment with using raw averages instead of PCA measures; using only four of the components of human capital; changing the underlying set of skills used in the PCA analysis; changing the shape of the PCA-derived measures; and using population percentiles rather than raw scores as inputs to the PCA analysis. These many changes yield similar results, typically accounting for 6-9% of the total wage variation.
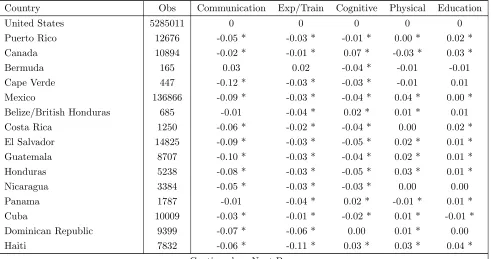
Individual estimates for each country-skill difference log(hi
s)−log(hU Ss ) are presented in
Table 6, along with their statistical significance and the number of observations per country. Theφterm has already been netted out of these coefficients. Rather than discussing each of the 650 relative skill endowments separately, I identify broad trends. Given the large sample most coefficients are precisely estimated and statistically different from 0 (i.e., foreign skill endowments are statistically different from U.S. skill endowments).
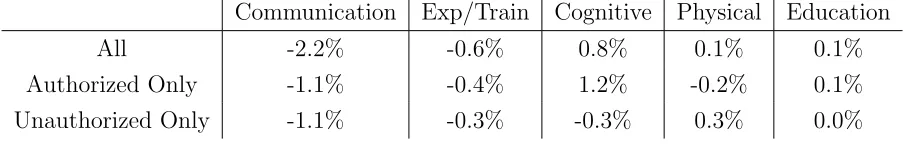
distri-bution, measured as the percentage change in the average of each skill per worker. These effects are dependent on the scale of the skill intensity characteristics; here, I measure them relative to the intensity of the median occupation, weighted by employment. Taken as a single group, immigrants increase the abundance of cognitive skills and increase the scarcity of communication and experience and training skills. These effects are large: immigrants represent just 8.6% of the sample, but lower the supply of communication skills by 2%. After controlling for cognitive ability, education seems to explain little of workers’ occupa-tional choices, leading the model to infer that immigrants and natives generally have similar education endowments. This is the case despite the fact that more educated Americans choose more education-intensive occupations (Table 1), suggesting that education-intensity is meaningfully measured.
Table 2: Contribution of Immigrants to Skill Distribution
Communication Exp/Train Cognitive Physical Education
All -2.2% -0.6% 0.8% 0.1% 0.1%
Authorized Only -1.1% -0.4% 1.2% -0.2% 0.1%
Unauthorized Only -1.1% -0.3% -0.3% 0.3% 0.0%
Aggregate numbers mask substantial heterogeneity, particularly for immigrants who did not enter the country through legal channels and for immigrants from countries of different development status. For the former, I face the difficulty that immigrants do not inten-tionally reveal themselves to be unauthorized. Instead, I break out results for immigrants from the fifteen countries with the highest estimated rates of unauthorized immigrant, as given by Office of Policy and Planning U.S. Immigration and Naturalization Service (2003). This indicator is imprecise, but covers most of the countries considered to be large sources of unauthorized immigrants.10 3.3% of the sample is categorized as unauthorized by this
definition. Unauthorized immigrants increase the abundance of physical skills but increase the scarcity of all other skills. Authorized immigrants are particularly abundant in cogni-tive skills, on the other hand. Both groups lack communication skills and experience and training.
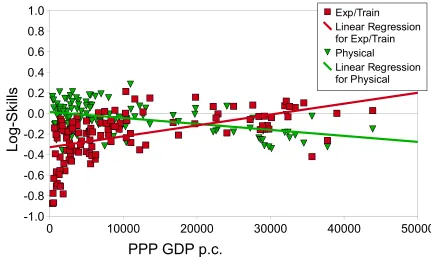
Countries with high fractions of unauthorized immigrants also tend to be less developed. Figures 5 and 6 plot skills against source country PPP GDP p.c. in 2000, taken from the World Development Indicators (World Bank 2006); income per capita is available for 117 of
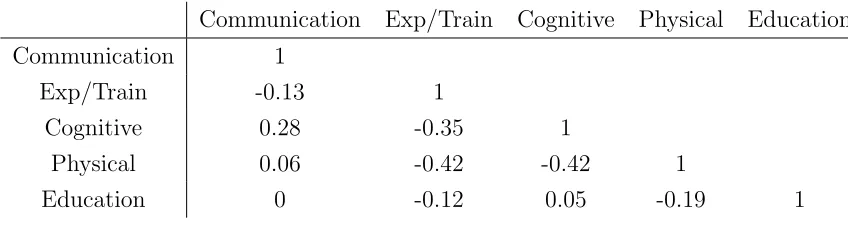
Table 3: Correlation of Skills for a Given Country of Origin
Communication Exp/Train Cognitive Physical Education
Communication 1
Exp/Train -0.13 1
Cognitive 0.28 -0.35 1
Physical 0.06 -0.42 -0.42 1
Education 0 -0.12 0.05 -0.19 1
the 131 countries. The plotted trend lines make a point similar to Table 2. Most countries’ immigrants are scarce in communication skills; there is little effect of education; and devel-oped country immigrants have more experience and training but less physical skills. Only for cognitive ability is there a difference. While developing country immigrants in general are abundant in cognitive ability, unauthorized country immigrants are not. This result is exactly what one would expect to hold in light of the formal selection mechanisms of U.S. policy.11 Otherwise, it is difficult to disentangle the effects of less developed and
unautho-rized. Table 3 shows how abundance of different types of skills are correlated for immigrants from different countries. Immigrants from countries with high measured cognitive ability tend to have more communication skills but less physical skills and experience/training.
These estimates are constructed assuming that all workers born in a given country are identical. The next section relaxes this assumption.
4.5
Estimation as a Mixed Logit
A more plausible alternative is to assume that immigrants from a country are drawn from a non-degenerate distribution F(H|i), which depends on (country-specific) parameters θi.
Since country of birth but not human capital is observed, the conditional probabilityq(j′|i) is now:
q(j′|i) =
Z
q(j′|H)dF(H|θi) (10)
This equation is a standard mixed logit estimation, as discussed in in Train (2003) and Hensher and Greene (2001).
To be more specific, assume that human capital is lognormally distributed with mean
µi and diagonal variance-covariance matrix Σi for all immigrants. This functional form
delivers that wages will be lognormal, roughly consistent with the data. Variation in skills by country of origin could be due to differences in endowments, or to different human capital accumulation decisions. I maintain the assumption that all American-born workers share a common human capital vector, so the estimated parameters represent the mean and variance of each country’s immigrants for each skill dimension, relative to the common American skill. In this case, different immigrants from the same country will choose different occupations because they vary in their tastes and in their human capital.
I use simulated maximum likelihood with 600 Halton draws to estimate; using 750 does not change the results appreciably. The mixed logit estimates for the means µi closely
agree with the conditional logit estimates based on the assumption that all workers share a common mean. The correlation between estimates is 0.96 for education, and nearly 1 for the other four factors. Hence, average estimates of skills are reasonably robust to accounting for heterogeneity. This fact motivates me to use the conditional logit estimates for the counterfactual analysis.
The estimates of theσi, the standard deviation of skills for a given source country, reveal
the amount of variability of skills by country. To control for scale, the results are given as the estimated coefficient of variation for the median country. The results are highest for education (1.55) and experience/training (0.9), and smaller for physical skills (0.63), communication skills (0.50), and cognitive ability (0.49). There is particular variability in the education of immigrants from less-skilled countries. These findings indicate that treating immigrants from a country as a single group may be less appropriate for education than for the emphasis areas of physical skills and cognitive ability, since for education within-country variability is often larger than the average native-immigrant difference.
5
Counterfactual Experiments Using Measured Skills
represent.
Both experiments account for the reallocation of native workers across occupations in the absence of some or all of the immigrants. For labor markets that experience employ-ment losses prices and wages tend to rise, attracting some native workers. The magnitude of the price and wage increase depends in part on the elasticity of substitutionψ: as goods become better substitutes, prices and wages change by less. The degree to which native inflows balance immigrant outflows is determined by the skill characteristics of the occupa-tion: natives are less likely to substitute into occupations with unusual skill characteristics because they would earn low wages. I report real wages, adjusted for changes in the cost of the consumption bundle. Both experiments use the results of the conditional logit estima-tion; the counterfactuals are easier with the point estimates rather than distributions, and the mean mixed logit estimates are highly correlated with the conditional logit estimates.
The last important question is how to determine ψ. The most relevant previous esti-mates are an elasticity of 2.5 between professionals and non-professionals (Chiswick 1978); an elasticity of substitution of 4.1 between blue and white collar workers (Dougherty 1972); and an elasticity of 5-10 between six broad occupation categories (Card 2001).12 Since
oc-cupations here are more finely coded than in Card’s work, the elasticity is likely be higher. Results are presented for a range of ψ from 2.5 - 40, with 10 taken to be an intermedi-ate baseline. The major qualitative features of interest do not vary within the range of reasonable ψ, although the exact quantitative magnitudes are sensitive to this parameter.
5.1
Distributional Implications
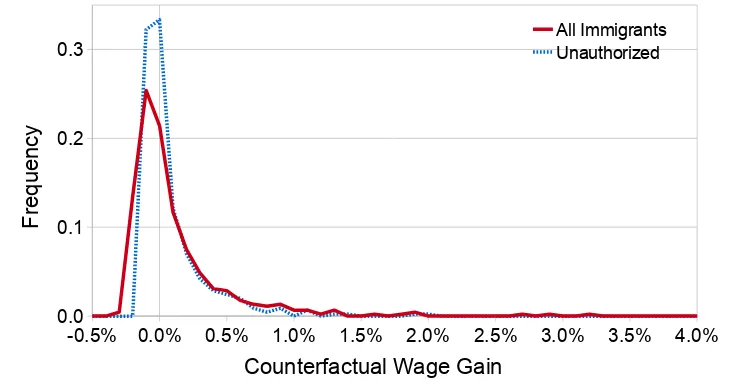
The distribution of real wage gains from preventing immigration is strongly skewed. This effect shows up most clearly in Figure 3, which plots the distribution of wage changes across occupations for the baseline case whereψ = 10. The median outcome for both experiments is a slight real wage loss, but the length of the right tail far outweighs the length of the left tail.
More precise figures are given in Table 4, for a wide range ofψ. Forψ = 10 the outcome for the median occupation is a slight wage decline of 0.1% in the absence of all immigration or unauthorized immigration. The largest wage decline is an order of magnitude smaller than the largest wage increase: 0.3% versus 3.2% for all immigrants, and 0.1% versus 2.0% for unauthorized immigrants. The shape is constant across both experiments and across a wide range of elasticities of substitution. The magnitudes, however, vary. Wage
changes in the absence of all immigration are larger than in the absence of unauthorized immigration, since unauthorized immigrants are a strict subset of the total (39%). As outputs of different occupations become better substitutes, prices and wages respond less to the experiments, leading to smaller magnitudes. The baseline estimate of 3.2% of the largest change agree with Card (2001), who finds estimates for unskilled workers of 2-3%. Even if the elasticity of substitution were implausibly low - as low as that between professionals and non-professionals - the largest wage change is still predicted to be just 6.1%.
-0.5% 0.0% 0.5% 1.0% 1.5% 2.0% 2.5% 3.0% 3.5% 4.0% 0.0
0.1 0.2 0.3
All Immigrants Unauthorized
Counterfactual Wage Gain
F
re
q
u
e
n
[image:21.612.118.487.247.443.2]cy
Figure 3: Distribution of Wage Changes
Figure 4 shows the full distribution for the highest and lowest values of ψ. Overall, the distributional effects suggest that immigration has very small positive effects for most workers, but large negative effects for workers in a few occupations or with certain types of skills. In the next section, I study the characteristics of those occupations with higher and lower wages.
5.2
Identifying Which Occupations Gain
Table 4: Wage Changes for Different Elasticities
ψ
2.5 5 10 20 40
Remove All Immigrants
Min -0.6% -0.4% -0.3% -0.2% -0.1%
Max 6.0% 4.7% 3.2% 1.9% 1.1%
Median -0.1% -0.1% -0.1% 0.0% 0.0%
Median Absolute 0.3% 0.2% 0.2% 0.1% 0.1%
Remove Unauthorized Immigrants
Min -0.3% -0.2% -0.1% -0.1% 0.0%
Max 4.1% 3.0% 2.0% 1.1% 0.4%
Median -0.1% -0.1% -0.1% 0.0% 0.0%
Median Absolute 0.2% 0.2% 0.1% 0.1% 0.0%
-1.0% 0.0% 1.0% 2.0% 3.0% 4.0% 5.0% 6.0% 7.0%
0.0 0.1 0.2 0.3 0.4 0.5 0.6 0.7
Elasticity = 2.5 Elasticity = 40
Counterfactual Wage Gain, Remove All Immigrants
F
re
q
u
e
n
c
[image:22.612.151.455.122.334.2]y
Figure 4: Distribution of Wage Changes, Elastic and Inelastic
ma-chine operators are among the ten occupations with the highest expected gains. A smaller group of occupations that gain is occupations with high cognitive ability intensity and low communications intensity, including aerospace engineering (largest gain), astronomers and physicists (21st) and dietitians (22nd). Workers in these occupations face pressure from high-ability immigrants from developed countries. The results for preventing only unautho-rized immigration is similar, except that cognitive ability-intensive occupations no longer gain. One striking fact stands out: the fraction of an occupation’s labor force that is foreign born is only weakly correlated with large wage gains, because of the potential for realloca-tion. Hence, some occupations with over a quarter of the work force foreign born still see wage effects of less than half a percent for ψ = 10, including diverse occupations such as taxi drivers, chefs, and economists.
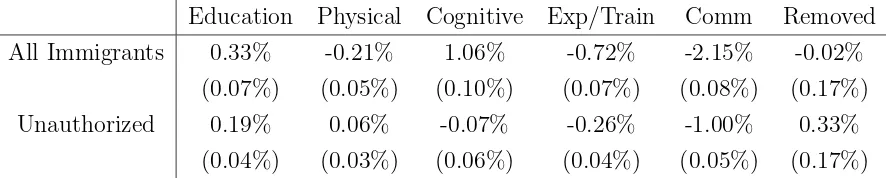
[image:23.612.82.525.579.668.2]Table 5 makes this information more systematic. The first row contains the results from regressing the counterfactual wage change from preventing immigration on the occupation’s skill intensity and the fraction of the workforce foreign-born, for each occupation. The third row contains the results from a similar regression using wage changes from preventing unauthorized immigration and the fraction of the workforce that is unauthorized foreign-born. There are sizeable effects for some of the skill attributes, particularly cognitive ability and communications. Recall that the skill intensity variables are scaled to lie on [0,1]. The difference between being the cognitively least and most intensive occupations is a 1.1% higher wage in the absence of immigration; for communications, the difference is a 2.2% lower wage in the absence of immigration. The results quickly summarize that immigration increases the average supply of communications and experience and training and decrease the average supply of communications skills. Note also that the fraction of the work force that is foreign-born plays only a minor role for all immigrants, although it does play a larger role for unauthorized immigration.
Table 5: Determinants of Wage Gains
Education Physical Cognitive Exp/Train Comm Removed
All Immigrants 0.33% -0.21% 1.06% -0.72% -2.15% -0.02%
(0.07%) (0.05%) (0.10%) (0.07%) (0.08%) (0.17%)
Unauthorized 0.19% 0.06% -0.07% -0.26% -1.00% 0.33%
(0.04%) (0.03%) (0.06%) (0.04%) (0.05%) (0.17%)
The identities of winners and losers from immigration fits well with recent research, although my results are at a more disaggregated level. Peri and Sparber (Forthcoming) find that immigration induces American workers to specialize in interactive occupations -similar to the communications-intensive occupations here. My findings are -similar, subject to the caveat that for some workers and occupations, there are no good substitutes available: the occupations similar to aerospace engineer are also not communications-intensive. They also find interesting results about how new cohorts of immigrants impact the wages of older cohorts, which I do not disentangle. Finally, Peri and Sparber (2008) and Borjas (2005) both show that high-skill immigration affects the wages and career decisions of high-skilled Americans: again, the theme is that it pushes them to study “soft” subjects in graduate school, which are more writing, language, and communications-intensive. My results add to this previous literature that occupations with formal experience and training requirements are also effective for avoiding competition from immigrants; and that the formal U.S. selection mechanism has resulted in a large net inflow of cognitive abilities.
6
Conclusion
This paper has proposed a theory of labor markets where workers vary in their endow-ment of a vector of skills, and occupations vary in their intensity over the vector of skills. Comparative advantage leads workers to match their endowments to occupations that are appropriately skill-intensive. I use the model to estimate the human capital endowments of workers born in 130 countries over 5 dimensions. Immigrants are net suppliers of cognitive ability, but are scarce in experience/training and particularly communications skills. They cause a highly skewed impact to the distribution of wages, reflecting their contributions to the skill distribution.
The wage effects of immigration are moderate, even though they miss several factors that may limit them further. They assume a conservatively low elasticity of substitution across occupations. They ignore, for instance, the ability of Americans to export excess goods as predicted in a Heckscher-Ohlin framework - not all aerospace engineering services are consumed in the United States. They also assume that the endowments of Americans are fixed, but as Peri and Sparber (2008) and Borjas (2005) have shown, Americans change their schooling and human capital accumulation decisions as well. However, it does rest on full adjustment of the capital stock, as opposed to Borjas (2003); if the capital stock does not adjust, the effects would be larger.
References
Autor, D. H., F. Levy, and R. J. Murnane (2003): “The Skill Content of Recent
Technological Change: An Empirical Exploration,”The Quarterly Journal of Economics, 118(4), 1279–1333.
Blinder, A. S. (2007): “How Many U.S. Jobs Might be Offshorable?,” CEPS Working
Paper No. 142.
Borjas, G. J. (1999): “The Economic Analysis of Immigration,” in Handbook of Labor
Economics, ed. by O. Ashenfelter, andD. Card, vol. 3A, pp. 1697–1760. Elsevier Science, North-Holland Publishers.
(2003): “The Labor Demand Curve Is Downward Sloping: Reexamining the
Impact of Immigration on the Labor Market,” Quarterly Journal of Economics, 118, 1335–1374.
(2005): “The Labor-Market Impact of High-Skill Immigration,” The American Economic Review, 95(2), 56–60.
Bureau of Labor Statistics(2004): “Occupational Employment Statistics,” Available
online at http://www.bls.gov/oes/oes_2004_m.htm.
Card, D. (2001): “Immigrant Inflows, Native Outflows, and the Local Labor Market
Impacts of Higher Immigration,”Journal of Labor Economics, 19(1), 22–64.
Chiswick, C. (1978): “The Growth of Professional Occupations in U.S. Manufacturing,
1900-73,” in Research in Human Capital and Development, ed. by I. Sirageldin. JAI Press, Greenwich, Conn.
Costinot, A., L. Oldenski, and J. E. Rauch(2009): “Adaptation and the Boundary
of Multinational Firms,” NBER Working Paper 14668.
Dougherty, C. R. S. (1972): “Estimates of Labor Aggregation Functions,” Journal of
Political Economy, 80, 1101–1119.
Gathmann, C., and U. Schonberg (2008): “How General is Human Capital? A
Task-Based Approach,” Working Paper, Stanford University.
Hendricks, L. (2002): “How Important Is Human Capital for Development? Evidence from Immigrant Earnings,”The American Economic Review, 92(1), 198–219.
Hensher, D. A., and W. H. Greene (2001): “The Mixed Logit Model: The State of
Practice and Warnings for the Unwary,” Mimeo, New York University.
Ingram, B. F., and G. R. Neumann(2006): “The returns to skill,” Labour Economics,
13, 35–59.
Jensen, J. B., and L. G. Kletzer (2007): “Measuring Tradable Services and the Task
Content of Offshorable Services Jobs,” Working Paper.
Lazear, E. P.(2003): “Firm-Specific Human Capital: A Skill-Weights Approach,” NBER
Working Paper No. w9679.
McFadden, D. (1974): “Conditional Logit Analysis of Qualitative Choice Analysis,” in
Frontiers in Econometrics, ed. by P. Zarembka, pp. 105–142. New York: Academic Press.
Migration Policy Institute (2009): “Foreign-Born Population and Foreign Born as
Percentage of the Total US Population, 1850 to 2007,” Available online athttp://www. migrationpolicy.org.
Occupational Information Network (O*NET) and US Department of
Labor/Employment and Training Administration (USDOL/ETA) (2007):
“Database 12.0,” Available online athttp://www.onetcenter.org/overview.html.
Office of Policy and Planning U.S. Immigration and Naturalization Service
(2003): “Estimates of the unauthorized immigrant population residing in the United
States: 1990 to 2000,” Available online at http://www.dhs.gov/xlibrary/assets/
statistics/publications/Ill\_Report\_1211.pdf.
Ottaviano, G. I., and G. Peri(2007): “The Effects of Immigration on U.S. Wages and
Rents: A General Equilibrium Approach,” Working Paper.
Peri, G., and C. Sparber (2008): “Highly-Educated Immigrants and Native
Occupa-tional Choice,” Working Paper.
Ritter, M. (2008): “Offshoring, Trade in Tasks and Occupational Specificity of Human Capital,” Working Paper, University of Toronto.
Ruggles, S., M. Sobek, T. Alexander, C. A. Fitch, R. Goeken, P. K. Hall,
M. King, and C. Ronnander(2004): “Integrated Public Use Microdata Series:
Ver-sion 3.0 [Machine-readable database],” Minneapolis, MN: Minnesota Population Center [producer and distributor], http://www.ipums.org.
Spitz-Oener, A. (2006): “Technical Change, Job Tasks, and Rising Educational
De-mands: Looking outside the Wage Structure,” Journal of Labor Economics, 24(2), 235– 270.
Train, K. (2003): Discrete Choice Models with Simulation. Cambridge University Press.
U.S. Department of Labor, Employment, and Training Administration(1991):
“Dictionary of Occupational Titles: Revised Fourth Edition,” Washington DC: 1991.
A
Measures of Skill Intensity
A.1
Information Used
The O*NET database is built on a content model that divides occupational information into six broad categories: worker characteristics, worker requirements, experience requirements, occupation-specific information, workforce characteristics, and occupational requirements. Within each of these six broad categories information is organized in a hierarchical format similar to the 1-digit, 2-digit, 3-digit format of industry and trade data. For instance, item 1.A.1.a.1 is a 5-digit characteristic of occupations, going from general to specific: Worker Characteristics.Ability.Cognitive Abilities.Verbal Abilities.Oral Comprehension. Through-out, I use the most disaggregated data possible, which can be 3 to 6-digit information.
Data are provided for each category and occupation, and is typically normalized to a 0-7 scale. O*NET provides anchors that represent typical characteristics associated with particular scores. For example, Oral Comprehension is computed on a scale of 0-7. The anchors given are that a score of 2 is equivalent to ability to understand a television com-mercial; a score of 4 is equivalent to ability to understand a coach’s oral instructions for a sport; and a score of 6 is equivalent to ability to understand a lecture on advanced physics. Scores for each occupation-attribute are gathered either from the average score given by occupational analysts or the average score given by survey responses from incumbent work-ers. For instance, all oral comprehension scores are the average rating of eight analysts, while the mathematics skills score for chief executives is the average of 23 survey responses by actual chief executives.
0 10000 20000 30000 40000 50000 -1.0
-0.8 -0.6 -0.4 -0.2 0.0 0.2 0.4 0.6 0.8
1.0 Exp/Train
Linear Regression for Exp/Train Physical
Linear Regression for Physical
PPP GDP p.c.
L
o
g
-S
ki
[image:31.612.79.510.95.352.2]lls
0 10000 20000 30000 40000 50000 -1.0
-0.8 -0.6 -0.4 -0.2 0.0 0.2 0.4 0.6 0.8 1.0
Communication Linear Regression for Communication Cognitive
Linear Regression for Cognitive Education
Linear Regression for Education
PPP GDP p.c.
L
o
g
-S
ki
[image:32.612.77.530.98.358.2]lls
Figure 6: Skills - GDP Relationship
Table 6: Estimated Human Capital, Conditional Logit
Country Obs Communication Exp/Train Cognitive Physical Education
United States 5285011 0 0 0 0 0
Puerto Rico 12676 -0.05 * -0.03 * -0.01 * 0.00 * 0.02 *
Canada 10894 -0.02 * -0.01 * 0.07 * -0.03 * 0.03 *
Bermuda 165 0.03 0.02 -0.04 * -0.01 -0.01
Cape Verde 447 -0.12 * -0.03 * -0.03 * -0.01 0.01
Mexico 136866 -0.09 * -0.03 * -0.04 * 0.04 * 0.00 *
Belize/British Honduras 685 -0.01 -0.04 * 0.02 * 0.01 * 0.01
Costa Rica 1250 -0.06 * -0.02 * -0.04 * 0.00 0.02 *
El Salvador 14825 -0.09 * -0.03 * -0.05 * 0.02 * 0.01 *
Guatemala 8707 -0.10 * -0.03 * -0.04 * 0.02 * 0.01 *
Honduras 5238 -0.08 * -0.03 * -0.05 * 0.03 * 0.01 *
Nicaragua 3384 -0.05 * -0.03 * -0.03 * 0.00 0.00
Panama 1787 -0.01 -0.04 * 0.02 * -0.01 * 0.01 *
Cuba 10009 -0.03 * -0.01 * -0.02 * 0.01 * -0.01 *
Dominican Republic 9399 -0.07 * -0.06 * 0.00 0.01 * 0.00
Haiti 7832 -0.06 * -0.11 * 0.03 * 0.03 * 0.04 *
[image:32.612.74.565.445.704.2]Table 6: Estimated Human Capital, Conditional Logit
Country Obs Communication Exp/Train Cognitive Physical Education
Jamaica 9882 -0.02 * -0.08 * 0.05 * 0.03 * 0.03 *
Antigua-Barbuda 355 -0.02 -0.05 * 0.03 * 0.01 0.02 *
Bahamas 336 -0.01 -0.04 * 0.02 0.00 0.02 *
Barbados 933 -0.03 * -0.06 * 0.01 0.01 * 0.04 *
Dominica 312 -0.06 * -0.05 * 0.03 * 0.01 0.04 *
Grenada 538 -0.03 * -0.07 * 0.05 * 0.03 * 0.05 *
St. Kitts-Nevis 224 -0.03 * -0.04 * 0.05 * 0.01 0.01
St. Lucia 259 -0.01 -0.03 * 0.00 0.02 * 0.01
St. Vincent 369 -0.02 * -0.06 * 0.03 * 0.03 * 0.03 *
Trinidad & Tobago 3542 -0.02 * -0.05 * 0.04 * 0.01 * 0.01 *
Argentina 2173 -0.03 * 0.00 0.02 * -0.02 * 0.02 *
Bolivia 994 -0.04 * -0.01 * -0.02 * -0.02 * 0.02 *
Brazil 4329 -0.07 * -0.02 * -0.02 * -0.02 * 0.03 *
Chile 1442 -0.04 * -0.01 * -0.01 -0.01 * 0.03 *
Colombia 8987 -0.06 * -0.03 * -0.01 * -0.01 * 0.01 *
Ecuador 4964 -0.07 * -0.03 * -0.02 * 0.01 * -0.01 *
Guyana/British Guiana 3838 -0.02 * -0.06 * 0.05 * 0.01 * 0.00
Paraguay 215 -0.10 * 0.00 -0.04 * -0.03 * 0.07 *
Peru 5495 -0.05 * -0.02 * -0.01 * -0.01 * 0.01 *
Uruguay 484 -0.03 * 0.00 -0.01 -0.01 0.00
Venezuela 1645 -0.02 * -0.01 * 0.03 * -0.02 * 0.00
Denmark 511 -0.01 0.01 0.07 * -0.03 * 0.00
Finland 364 -0.02 * -0.01 0.10 * -0.02 * 0.00
Norway 386 0.00 0.00 0.09 * -0.02 * 0.01
Sweden 879 -0.02 * -0.02 * 0.10 * -0.03 * 0.01
United Kingdom 11346 -0.01 * 0.00 * 0.08 * -0.04 * 0.00 *
Northern Ireland 2783 0.00 0.02 * 0.02 * 0.00 0.00
Belgium 399 -0.03 * -0.01 0.07 * -0.05 * 0.02 *
France 2477 -0.03 * 0.00 0.06 * -0.05 * 0.02 *
Netherlands 1159 -0.02 * 0.01 0.09 * -0.03 * 0.01 *
Switzerland 723 -0.04 * 0.02 * 0.09 * -0.05 * 0.01
Albania 660 -0.06 * -0.04 * -0.02 * 0.00 -0.02 *
Greece 2231 -0.02 * -0.03 * 0.05 * 0.01 * -0.01 *
Macedonia 329 -0.04 * -0.01 -0.02 * 0.03 * -0.03 *
Italy 4182 -0.05 * 0.01 * 0.01 * -0.01 * 0.00
Portugal 2638 -0.09 * 0.02 * -0.03 * 0.01 * -0.01 *
Azores 296 -0.09 * 0.01 -0.04 * 0.02 * -0.02
Spain 1453 -0.04 * 0.01 * 0.01 -0.03 * 0.04 *
Austria 533 -0.04 * 0.01 0.06 * -0.04 * 0.02 *
Table 6: Estimated Human Capital, Conditional Logit
Country Obs Communication Exp/Train Cognitive Physical Education
Bulgaria 721 -0.05 * -0.03 * 0.05 * -0.02 * 0.01 *
Czechoslovakia 506 -0.05 * 0.01 0.03 * -0.01 * 0.01
Slovakia 260 -0.04 * 0.00 0.01 0.00 0.01
Czech Republic 414 -0.04 * -0.01 0.03 * 0.00 0.02 *
Germany 9144 -0.02 * -0.02 * 0.05 * -0.02 * 0.00 *
Hungary 1016 -0.05 * 0.02 * 0.05 * -0.02 * 0.00
Poland 7841 -0.07 * 0.02 * 0.00 -0.01 * 0.00
Romania 2264 -0.06 * 0.00 0.07 * -0.01 * 0.01 *
Yugoslavia 1230 -0.06 * 0.01 -0.01 -0.01 * -0.01 *
Croatia 642 -0.05 * 0.03 * -0.01 0.00 0.00
Serbia 173 -0.06 * 0.00 -0.01 -0.02 * 0.00
Bosnia 1846 -0.09 * -0.01 * -0.01 * 0.00 -0.02 *
Kosovo 150 -0.05 * -0.03 * -0.05 * 0.01 -0.02
Latvia 204 -0.06 * -0.02 0.10 * -0.03 * 0.00
Lithuania 262 -0.04 * -0.02 * 0.09 * -0.01 0.00
Byelorussia 593 -0.05 * -0.03 * 0.10 * -0.01 -0.03 *
Moldovia 313 -0.04 * -0.01 0.06 * 0.00 -0.02 *
Ukraine 3915 -0.06 * -0.02 * 0.07 * -0.01 * -0.02 *
Armenia 821 0.00 -0.04 * 0.03 * 0.02 * -0.02 *
Azerbaijan 220 -0.05 * -0.03 * 0.05 * -0.02 * 0.01
Georgia 163 -0.05 * -0.06 * 0.08 * 0.00 0.03 *
Uzbekistan 299 -0.06 * -0.03 * 0.07 * -0.02 * 0.00
China 19090 -0.11 * -0.04 * 0.10 * -0.05 * 0.02 *
Hong Kong 3327 -0.05 * -0.02 * 0.08 * -0.05 * -0.02 *
Taiwan 6439 -0.05 * -0.01 * 0.12 * -0.06 * -0.01 *
Japan 5764 -0.02 * -0.02 * 0.08 * -0.04 * 0.00 *
South Korea 2000 -0.03 * -0.03 * 0.04 * -0.01 * -0.01 *
Cambodia 1911 -0.10 * -0.04 * 0.05 * 0.00 -0.05 *
Indonesia 1150 -0.05 * -0.06 * 0.09 * -0.02 * 0.00
Laos 2531 -0.14 * -0.02 * 0.04 * 0.00 -0.06 *
Malaysia 1048 -0.05 * -0.04 * 0.09 * -0.04 * 0.00
Philippines 29294 -0.05 * -0.07 * 0.07 * -0.01 * 0.03 *
Singapore 393 -0.03 * -0.04 * 0.12 * -0.05 * 0.01
Thailand 2355 -0.06 * -0.06 * 0.06 * -0.01 * 0.01 *
Vietnam 17344 -0.10 * -0.01 * 0.06 * -0.02 * -0.06 *
Afghanistan 631 0.01 -0.09 * 0.08 * 0.02 * -0.03 *
India 23130 -0.09 * -0.02 * 0.13 * -0.06 * 0.02 *
Bangladesh 1681 -0.02 * -0.11 * 0.10 * 0.01 -0.02 *
Burma (Myanmar) 718 -0.07 * -0.02 * 0.07 * -0.02 * -0.01
Table 6: Estimated Human Capital, Conditional Logit
Country Obs Communication Exp/Train Cognitive Physical Education
Pakistan 4114 -0.01 * -0.08 * 0.12 * 0.01 * -0.02 *
Sri Lanka (Ceylon) 642 -0.05 * -0.05 * 0.11 * -0.04 * 0.03 *
Iran 5388 0.00 -0.02 * 0.09 * -0.02 * -0.01 *
Nepal 258 -0.07 * -0.09 * 0.08 * -0.04 * 0.03 *
Cyprus 185 -0.06 * 0.00 0.08 * -0.02 * 0.01
Iraq 1381 -0.04 * -0.02 * 0.04 * 0.01 * -0.02 *
Israel/Palestine 1861 -0.01 -0.01 0.06 * -0.03 * 0.00
Jordan 787 0.03 * -0.06 * 0.10 * 0.02 * -0.04 *
Kuwait 248 0.00 -0.07 * 0.13 * 0.00 -0.01
Lebanon 1860 -0.01 -0.01 * 0.08 * -0.01 * -0.01 *
Saudi Arabia 139 -0.02 -0.02 0.07 * 0.00 -0.01
Syria 941 -0.01 -0.02 * 0.06 * 0.01 0.00
Turkey 1456 -0.04 * -0.02 * 0.07 * -0.02 * 0.01 *
Yemen Arab Republic (North) 253 -0.02 -0.09 * 0.05 * 0.02 * -0.07 *
Algeria 240 -0.02 -0.06 * 0.08 * -0.01 0.00
Egypt/United Arab Republic 2232 -0.02 * -0.05 * 0.09 * -0.01 * 0.01 *
Morocco 803 0.01 -0.07 * 0.05 * 0.01 -0.02 *
Sudan 324 -0.06 * -0.09 * 0.07 * 0.00 0.01
Ghana 1625 -0.04 * -0.11 * 0.09 * 0.01 * 0.03 *
Liberia 784 -0.03 * -0.12 * 0.08 * 0.02 * 0.04 *
Nigeria 3317 -0.01 * -0.11 * 0.13 * 0.01 * 0.04 *
Senegal 212 0.01 -0.07 * 0.03 0.01 -0.03 *
Sierra Leone 507 -0.02 -0.14 * 0.09 * 0.03 * 0.04 *
Ethiopia 1463 -0.01 -0.14 * 0.08 * 0.02 * -0.02 *
Kenya 863 -0.04 * -0.09 * 0.10 * -0.02 * 0.03 *
Somalia 452 -0.06 * -0.10 * 0.04 * 0.02 * -0.02 *
Tanzania 268 -0.05 * -0.03 * 0.09 * -0.03 * 0.02 *
Uganda 306 -0.04 * -0.06 * 0.10 * -0.02 * 0.02 *
Zimbabwe 247 -0.03 * -0.03 * 0.10 * -0.02 * 0.02 *
Eritrea 372 -0.04 * -0.10 * 0.07 * 0.01 -0.01
Cameroon 283 -0.01 -0.12 * 0.12 * 0.00 0.04 *
South Africa (Union of) 1308 0.00 0.00 0.08 * -0.05 * 0.02 *
Australia 1227 -0.02 * -0.02 * 0.09 * -0.04 * 0.02 *
New Zealand 560 -0.01 0.01 0.07 * -0.03 * 0.02 *
Fiji 593 -0.04 * -0.06 * 0.05 * 0.01 * -0.01 *
Tonga 288 -0.05 * -0.02 * -0.01 0.03 * 0.00
Table 7: Dimensions of Human Capital: Education and Knowledge
Measurea
Intensity Rankingb
Knowledge Category Most Intensive
Engineering and Technology 1. Physicians and Surgeons
Design 2. Miscellaneous Social Scientists
Mathematics 3. Psychologists
Physics
Chemistry Least Intensive
Biology* 1. Food and Tobacco Machine Operator/Tender
Psychology* 2. Taxi Driver and Chauffeur
Sociology* 3. Desktop Publishers
Geography
Medicine and Dentistry* Therapy and Counseling*
Foreign Language* Fine Arts
History and Archaelogy* Philosophy and Theology*
Law and Government*
Other Category Required Education Level* a
Name of measure in O*NET system. An asterisk indicates that the first principal component captures at least 1/3 of the variation in the measure.
b
Table 8: Dimensions of Human Capital: Training and Experience
Measurea
Intensity Rankingb
Training and Experience Required Most Intensive
On-the-Job Training* 1. Elevator Installers and Repairers
Required Work Experience* 2. Ship Engineers
On-Site/In-Plant Training* 3. Podiatrists
General Preparation
Least Intensive
Observed Job Experience 1. Ushers, Lobby Attendants, and Ticker Takers
< 1 Year* 2. Telemarketers
1-5 Years* 3. Dishwashers
6-9 Years 10+ Years* a
Name of measure in O*NET system. An asterisk indicates that the first principal component captures at least 1/3 of the variation in the measure.
b
[image:38.612.89.521.472.658.2]Three occupations that score highest and lowest for skill intensity.
Table 9: Dimensions of Human Capital: Cognitive Abilities
Measurea
Skill Intensityb
Worker Abilities Most Intensive
Fluency of Ideas* 1. Aerospace Engineers
Originality* 2. Astronomers and Physicists
Problem Sensitivity* 3. Mechanical Engineers
Deductive Reasoning*
Inductive Reasoning* Least Intensive
Information Ordering* 1. Miscellaneous Construction Equipment Operators Category Flexibility* 2. Laborers and Freight/Stock/Materials Movers, Hand
3. Grinding Tool Setters/Operators/Tenders a
Name of measure in O*NET system. An asterisk indicates that the first principal component captures at least 1/3 of the variation in the measure.
b
Table 10: Dimensions of Human Capital: Physical Abilities
Measurea
Intensity Rankingb
Ability Most Intensive
Arm-Hand Steadiness* 1. Fire Fighters
Manual Dexterity* 2. Electricians
Finger Dexterity* 3. Emergency Medical Technicians and Paramedics
Control Precision*
Multilimb Coordination* Least Intensive
Response Orientation* 1. Public Relations Specialist
Rate Control* 2. Actuaries
Reaction Time* 3. Loan Counselors and Officers
Wrist-Finger Speed* Speed of Limb Movement*
Static Strength Ability* Explosive Strength Dynamic Strength*
Trunk Strength* Stamina* Extent Flexibility* Dynamic Flexibility Gross Body Coordination*
Gross Body Equilibrium* Near Vision
Far Vision
Visual Color Discrimination* Night Vision*
Peripheral Vision* Depth Perception* Glare Sensitivity* Hearing Sensitivity* Auditory Attention* a
Name of measure in O*NET system. An asterisk indicates that the first principal component captures at least 1/3 of the variation in the measure.
b
Table 11: Dimensions of Human Capital: Language and Communication
Measurea
Intensity Rankingb
Frequency of Communication by Method Most Intensive
Public Speaking* 1. Gaming Managers
Telephone* 2. Postmasters and Mail Superintendents
Letters and Memos* 3. Public Relations Specialists
Face-to-Face Discussions*
Least Intensive
Frequency of Communication by Type 1. Pressers, Textile, Garment, and Related Materials
Contact with Others* 2. Tire Builders
Work with Group or Team* 3. Shoe Machine Operators and Tenders
Deal with External Customers* a
Name of measure in O*NET system. An asterisk indicates that the first principal component captures at least 1/3 of the variation in the measure.
b