Munich Personal RePEc Archive
(In)Efficiency of Matching - The Case of
A Post-transition Economy
Jeruzalski, Tomasz and Tyrowicz, Joanna
3 August 2009
(In)Efficiency of Matching
-- The Case of A Post--transition Economy
∗
Tomasz Jeruzalski
University of Warsaw
Joanna Tyrowicz
†University of Warsaw National Bank of Poland First version: November, 2007
This version: August, 2009
Abstract
This paper approaches the question of efficiency in job placement using regional data for Polish regions (policy relevant NUTS 4 level) over the time span of 2000-2008. Using a unique data set we estimate the matching function using stochastic frontier as well as difference-in-difference estimators. We use also managed to combine this unique data set with another unique source of data on the ALMPs coverage, unemployment structure across time and regions as well as the individual capacity of local labour offices. We use these data to explain the exceptional variation in estimated efficiency scores.
Our findings suggest that matching abilities are highly driven by demand fluctuations, while unemploy-ment structure, ALMPs and individual labour office capacities have little explanatory power. Although without individual data it is fairly impossible to provide a reliable counterfactual, we raise some arguments to support the claim of job placement inefficiency by public employment services in Poland.
JEL Codes: P3, J64, J69, C33
Key words: matching function, stochastic frontier, Poland
∗We are extremely grateful to Jan Svejnar, Francesco Pastore as well as participants of seminars at University of Warsaw and
National Bank of Poland for valuable comments. The remaining errors remain ours. Part of the research has been performed while Joanna Tyrowicz has been a visiting researcher at IZA, Bonn and Columbia University, New York whose support is gratefully acknowledged.
1
Introduction
When evaluating the effectiveness of differentiated active labour market policies (ALMPs), one typically resorts to two approaches. The first, basing on individual data, should allow to estimate the treatment effect of differ-entiated instruments, taking into account the developments in a control group (i.e. average treatment effect on treated). However, this approach requires not only relatively detailed micro-level data, but also observing individuals after the completion of activisation programmes. Therefore, the policy relevant conclusions can only be drawn some years after policy implementation.
The latter approach focuses on regional data instead. The obvious shortcoming is that either quite strong assumptions need to be made concerning the distribution of unemployed among regions (essentially imposing homogeneity during the estimation procedures), or one is left with much weaker underpinnings for policy implications of the findings. Furthermore, regional data rarely allow to measure the scale of some negative indirect effects like displacement, substitution or redistribution effects.
Among the strategies within the second approach the most frequent in the literature are the matching functions. An extensive theoretical framework for the effects of ALMPs on employment has been developed by Calmfors (1993)1, while the empirical applications were extensively evaluated by Petrongolo and Pissarides
(2001). As stated by Hagen (2003), raising the efficiency of matching process is usually regarded as the main aim of ALMPs, and can be reached by adjusting the human capital of job seekers to the requirements of the labour market (especially important in transition countries with large structural disparities) and by increasing the search intensity (as well as search capacity) of (former) participants.
In this paper we attempt to evaluate the changes in the matching efficiencies using local (NUTS 4 level) data for Polish regions. We resort to NUTS 4 regions for two main reasons. First of all, this is a policy relevant level, as all instruments are designed an implemented by local labour offices, subject to the financing algorithm, which gives a premium to regions with relatively higher unemployment rate, relatively higher number of unemployed and relatively higher job market turnover rates. Secondly, higher level of data aggregation is statistically meaningless in as far as properties of unemployment dynamics are concerned, Tyrowicz and W´ojcik (2009).
In order to approach the matching efficiency two main techniques of the are usually employed in the empirical literature: stochastic frontier estimation and panel data regressions. They both approach this problem basing on somewhat different theoretical premisses, thus performing both permits a comprehensive testing of the theories of the matching efficiency. We use administrative registry and ALMPs data, as well as a unique survey about the quality of matching procedures and IT tools applied in respective local labour offices. This allows to enrich the standard policy effectiveness analysis by enabling the analysis of ”production” conditions (individual capacity of the local labour offices).
The paper is organised as follows. The next section focuses on the brief description of the institutional environment of polish labour market in order to justify the use of multiple empirical strategies. These are outlaid in section 3, while results for respective analyses are presented in section 4. Conclusions focus on policy implications as well as some directions for future research.
2
Institutional context
For the two decades after the transition, Poland has belonged to a group of countries with by far highest and most persistent unemployment in the EU. Financing of active labour market policies has been intensified gradually as of 2004, reaching slightly more than 0.2% of GDP in 2006 and 0.33% in 2008. Although it is still
1
less than in any of EU25 Member States, these policies covered 20% of the unemployed, which is considerable if one takes into account that the pool of unemployed amounted at the time to approximately 1 500 000 people. Some qualitative research suggest anecdotic evidence in support of purposeful ”creaming” by public em-ployment services (PES), (Tyrowicz 2006). Incidental surveys among PES employees demonstrate that the odds for success individually perceived by the job counselors constitute the main criterion during the ALMPs recruitment process, cfr. ML&SA (2004). Consequently, despite general decrease in national unemployment rate over the second half of 2006 and throughout 2007, some regions still struggle with 35-40% unemployment rate thresholds.
2.1
Structural traits of unemployment
Some research suggest that approximately 80% of unemployment can be characterised as structural, (Sztanderska and Socha 2001). However, these findings comprise both frictional andstrictestructural unemployment, while geographical and targeted group issues are not explored, partly for the lack of adequate data. Currently, more than 85% of unemployed are no longer entitled to the unemployment benefit, thus suggesting that most of the unemployed are either long-term unemployed or have a long record of unstable employment2.
According to registry data, almost 70% of Polish unemployed have primary or vocational education only, frequently in outdated professions or with no longer applicable skills. Moreover, half of them expresses little or no willingness to upgrade their qualifications, cfr. ML&SA (2006). Professional and geographic mobility is very low, while transitory migration of almost 1 million Poles to Ireland, Sweden, Norway, Germany, UK and other EU countries concerns predominantly those aged under 30 years old3. Long term unemployment
rate is the highest in EU (currently app. 9%, EU average falls short of 4%). Employment in agriculture still exceeds 17%, which is extremely high by European standards, while half of the registered unemployed live in the rural areas. In addition, forecasts concerning the agricultural sector at large suggest that due to the increasing productivity, hidden over-employment in this sector will soon transform tode factounemployment4.
Thus, low skills, low mobility and excessive employment in the agriculture are the main structural traits of the labour market problems in Poland.
At the same time, as noted by Munich, Svejnar and Terrel (1998), Poland had one of the lowest among the CEECs outflow rates. Vacancies ratios are dramatically low throughout the whole transition period, with averages around a thousand job-seekers per one offer5. Finally, this is not high unemployment that creates the main labour market challenge, but low activity and employment rates (currently employment rate at 52%, the lowest in EU25). Not only does this phenomenon hinder the development process, but also social security imbalances are reinforced. Currently average exit age falls short of 58 years (with legal ages of 60 for women and 65 for men), while employment rate for 55+ age group amounts to only 28% (55 tillde iure retirement).
2.2
ALMPs and their financing
Public Employment Services (PES) are the main actor in ALMPs. They are subordinated to the public administration (separately at regional and local level), thus being only marginally responsive to central policies. They struggle with underinvestment both in terms of IT and in terms of HR (employment officers and managers
2
Under Polish legislation, unemployment benefit is only awarded for the first 12 months after registration, subsequently indi-viduals may be entitled to social assistance - which, unlike unemployment benefit, is means-tested.
3
Kaczmarczyk and Tyrowicz (2008) report the share of people under 30 years in the so-called ”new” wave of migration to approximately 80%.
4
The NUTS 2 level region of lowest agricultural productivity and lowest GDPper capita in EU25 is located in Poland, with 36% of active working age population employed in the agricultural sector.
5
constitute only 29% of the PES employees). On average, in 2007 there were 1600 unemployed per one job broker and over 4600 per one job counselor.
ALMPs are financed from the Employment Fund (and so are passive labour market policies), which orig-inates solely from employers contributions, currently at 0.22% of GDP6. As of 2004 ESF funds are used for employment policy as well, including the high risk groups as specified in Human Resources Development Sectoral Operational Programme 2004-2006 (HRD SOP) and subsequently Human Capital Operational Pro-gramme 2007-2013 (HC OP). This allows to increase PES spending by 30% annually, but only part of this additional funding will contribute directly to ALMPs.
ALMPs instruments are highly regulated. They comprise subsidised employment (public work schemes -despite their low efficiency, strongly preferred by local authorities - and public service employment), scholarships for youth, on-the-job training as well as specific and general training (including the ability to navigate on the labour market). Finally, there are also instruments supporting self-employment (micro-enterprise development) and a subsidies for creating a new position. In addition, there are some specific incentives for fostering employment among handicapped, among whom only 12% remain active on the labour market.
Financing of these policies is decided ex ante on an annual basis along the regulations allowing to treat this process as a form of a natural experiment. Namely, Ministry of Finance in January each year divides the Employment Fund financing among NUTS2 level representatives of the public employment services along an algorithm that provides a premium to regions with higher than average unemployment and higher than average number of unemployed. Interestingly, the unemployment rate differentials are relatively small on NUTS2 level in Poland (approximately 1:1.5). Afterwards, at NUTS2 level allocations to NUTS4 level are determined up front for the whole year, while different NUTS2 level authorities apply different mechanisms in an uncoordinated manner. NUTS4 level regional differentials amount to as much as 1:26, cfr. Tyrowicz and W´ojcik (2009). Finally, since these funds are treated as budgetary funds, whenever there seems to be a surplus at the end of the year, each NUTS2 level authority encourages NUTS4 labour offices to spend the reminder by the end of December.
For the ALMPs financing based on European Social Fund, for the programming period 2004-2006 all financing was allocated through competitions for all NUTS4 labour offices within a particular NUTS2 region. They were closed competitions (only PES could have applied), while in case of excessive or insufficient funding the financing agreements were annexed either extending the coverage of the programme or postponing the implementation to the next budgetary year, respectively. These funds need to be pre-financed by Polish government, which essentially meant that first government financing to ALMPs (i.e. Employment Fund) needed to be spent. Throughout 2005 and 2006 annual ALMPs within the HRD SOP exceeded annual Employment Fund allocation by approximately 20% (cfr. quarterly reports on ESF implementation by Ministry of Regional Development). Regardless of the financing source, it can cover only instruments specified above.
Consequently, the mechanism of ALMPs financing virtually excludes any possibility of endogeneity due to simultaneity suggested in the literature (cfr. Dmitrijeva and Hazans (2007)). Conversely, this financing suggests a natural experiment to which NUTS4 local labour markets were subjected in terms of ALMPs financing availability.
2.3
Regional differentiation
The component of natural experiment is especially interesting in the context of the regional determinants of unemployment in Poland. Basing on the findings of ? and? one can state that for the majority of NUTS2 regions no generalσ convergence can be traced, instead convergence of clubs finds support in data for some
6
regions. These results suggests that the NUTS4 regions follow different patterns of evolution despite belonging to the same NUTS2 region, while some clubs exist. The method of kernel density estimates does not allow to incorporate the spatial dimension and verify if the clubs are clustered in space and whether these clusters are confined by regional borders.
Consequently, one could ask if over the past seven years of locally conducted labour market policies, the algorithm discriminating among the NUTS2 levels on the basis of measured unemployment provides a mech-anisms and incentives sufficient to to alleviate the consequences asymmetric responses to external shocks on the local level. There is no data in support of the claim that offices who succeed in combating unemployment do so due to higher availability of ALMPs financing. On the contrary, apparent divergence of unemployment rates exhibiting in growing relative rates in high unemployment regions exists independently if the financing availability in general. In this paper we intend to inquire exactly the impact of the ALMPs on the matching efficiency.
3
Empirical strategies
In order to evaluate the effects of ALMPs on the matching efficiency, one typically resorts to the matching function, which explains the number of inflows to regular employment by the number of vacancies available and job seekers. This approach may be augmented to distinguish between the stocks and the flows (of both vacancies and unemployed), as advocated by Coles and Smith (1998), Greg and Petrongolo (2005) as well as Coles and Petrongolo (2002). Namely, newly arriving unemployed may match better the needs of employers (flow of job-seekers and stock of vacancies) or, alternatively, newly advertised job opportunities may fit better the competencies of existing unemployed (stock of unemployed and flow of vacancies). Using a neutral Cobb-Douglas matching function specification, this would imply:
Mi,t = m(Ui,t−1, Vi,t−1)ei,t (1)
= Ei,t·(Ui,tstock−1)αus ·(U
f low
i,t−1)αuf ·(Vi,tstock−1)αvs·(V
f low i,t−1)αvf,
withM denoting successful matches, andU and V corresponding to unemployed and vacancies, respectively. Establishing a log-linear version applicable in empirical studies with shorthand notationx=lnX, one obtains:
mi,t=αusustocki,t−1+αufuf lowi,t−1+αvsvstocki,t−1+αvfvi,tf low−1+logǫi,t, (2)
where logǫi,t can be assumed to comprise α0 (time and entity indifferent random component), γi (identity
characteristics) andδt (time trend), while constant returns to scale requireαus+αuf +αvs+αvf = 1.
This baseline model specification is neutral in terms of empirical strategy - any econometric technique validated by the data properties is suitable for estimation. However, this model does not allow to account for any effects of labour market policies - neither those addressing the flow dynamics, nor those enhancing the skills of the workers.
3.1
Incorporating the effects of ALMPs
approximately 3 to 4 months), this statement has also far more reaching consequences in terms of designing the empirical strategy. These are:
• Adverse selection problem. Unemployed are allocated to activisation programmes basing on some explicit
(like in the case of Germany after the Hartz Reform) or implicit criteria. Consequently, their ability to find employment is already partly incorporated in the allocation decision. Case workers may either facilitate the chances of ”better” job seekers or ameliorate the difficulties of ”worse” ones. In either case, individual search effectiveness varied already before the intervention, while basing on the fact that someone participated in the project, researchers can actually only reason about the actual motivation of the job seekers ex ante and thus not about the programme influence ex post. Econometrically, this leads to the sample selection bias (participants of activisation programmes are non-randomly drawn from the unemployed pool), which invalidates eventual findings. This problem can only be solved using individual data and the adequate matching of the participants with non-participants prior to policy effects evaluation.
• Reverse causality problem. Basing on the above statement, it is obvious that participants are bound
to have systematically different chances on the labour market as the non-participants (higher or lower - depending on whether case workers apply positive or negative selection criteria). Consequently, the eventual differences in the matching performance for participants and non-participants are not necessarily an effect of ALMPs, but essentially a measure of the statistical consistency of applying the screening criteria.
Because of these obstacles, differentiated estimating strategies have been employed so far. Fahr and Sunde (2002) estimate for Germany separately elasticities and stochastic production functions technical efficiency coefficients by occupation and by region and furthermore try to explain the differentiation in the efficiencies by the properties of respective labour markets (e.g. size, turnover, properties of the neighbourehooding regions). Vassiliev, Ferro Luzzi, Fluckiger and Ramirez (2006) apply Data Envelopment Analysis to Swiss data instead of the stochastic production frontier, but the approach is virtually the same.
Some innovation has been introduced by Ibourk, Maillard, Perelman and Sneessens (2001) on French data, who developed a model allowing to disentangle matching efficiency by taking the unemployment structure and other characteristics of the labour markets as determinants of efficiency estimates and not matching directly. Building on this approach, Fahr and Sunde (2005) reiterate their research on German labour market, enriching it also by the spatial approach with the use of spatial weights. Most recently Destefanis and Fonseca (2007) apply the frontier estimation to the case of Italy to see if the so called Treu Act contributed to the higher matching efficiency. Interestingly, since for Italy no official vacancies data exist, they construct a measure basing on indicators taking into account effective job creation. This paper finds a sort of a ladder effect, namely that due to the policy change efficiency was improved for all but low skilled job seekers, which is exactly the opposite of the policy makers motivation.
3.2
Levels
versus
difference-in-difference estimations
but less than proportional impact. Unfortunately, Dmitrijeva and Hazans (2007) take the share of trained directly in the stochastic frontier estimation instead of the two stage approach, thus risking the endogeneity consequences.
For a larger selection of the transition economies this was done by Munich and Svejnar (2006) and Munich and Svejnar (2007). They demonstrate that inflow rates were rising gradually in the western part of Germany as well as in the Czech Republic, Hungary, Poland, and Slovakia. Their analysis suggests that the extent to which the these transition economies undertook reforms and had some private enterprise activities before the transition appears to have influenced these countries’ subsequent restructuring and growth paths, limiting the spread of the restructuring-lead unemployment. Munich and Svejnar (2007) find that West German part of Germany is an economy with slow trends of rising unemployment and inflow, declining vacancies and relatively efficient matching (thus: high returns to scale). Czech Republic appears to be in a similar situation enjoying -despite transitory decreases in outflow rates - high returns to matching. Conversely, Slovak economy displays high unemployment and inflows, low vacancies, outflows and increasing returns to scale as well as a positive trend in efficiency. Finally, for Poland high unemployment persists in the presence of low vacancies and outflows with constant returns to matching.
Munich and Svejnar (2007) argue that in order to obtain consistent estimates of the latter one needs to apply difference-in-difference approach. Namely, they argue that, since any local labour market mean is computed from all local labour market observations over time, these means contain all values of the error terms, which creates correlation between transformed explanatory variables and transformed error terms and hence leads to biased estimates. On the other hand, the first difference transformation contaminates the transformed variables only with recent error terms, thus enabling the use of ∆ut−1 as instruments and making the error terms no
longer contemporaneously correlated with the predicting variables.
3.3
Final specifications for estimation
Matching efficiency for Poland has been analysed by Puhani (1999) with main findings suggesting that public training programmes can indeed be used to reduce unemployment. However, in the way Puhani (1999) uses the augmented matching function, endogeneity accusation cannot be dismissed7. Using regional administrative
data prior to 1999 administrative reform (49voivodship units at approximately current NUTS3 level) he puts ALMPs expenses directly in the matching function. This yields directly interpretable coefficients (e.g. average cost to reduce unemployment by one person in Poland through training programmes was estimated to amount between 200 and 500 euro). However, the time period covered in this study comprised mainly unemployment reductions, while ALMPs at the time were not implemented at a level at which their effects have been measured. Therefore, the positive outcome may actually be a spurious result.
In this paper we cover the period covering both the increases and decreases in the unemployment rate. There have been also considerable changes in the reported vacancies (beyond seasonal variation), Figure 1. Conse-quently, it seems that flows may actually play an important role in observed changes in matching efficiency. Therefore, following Greg and Petrongolo (2005) and Dmitrijeva and Hazans (2007) empirical specification
7
allows to include separately stocks and flows in both vacancies and job seekers. Thus the first empirical specification is altered to:
mi,t=αusustocki,t−1+αufuf lowi,t−1+αvsvi,tstock−1+αvfvf lowi,t−1+ǫi,t. (3)
Vacancies (as well as vacancy ratios) demonstrate high volatility over time, since labour market outlooks have changed significantly over the analysed period. Average vacancy ratios (number of offers per one job seeker) have ranged between 0.001 and 0.059, with the mean value of 0.01 offer per one job seeker. Naturally, this property of the data may lead to many estimation problems. Among others, it seems that time trend needs to be controlled for in a non-linear way, taking into account up and down swings in the labour market outlooks. Secondly, large part of observed heterogeneity will be an interaction of time and unit characteristics. Since one should expect that units ”react” differently to country-wide shocks, the response in the labour market may owe a lot to the local response to shock apart from efficiency of a local labour office. Finally, larger labour markets are characterised by larger flows, including outflows to employmentwithout any support from the public employment services. Figure (1) demonstrates the (average) anti-cyclicality of of vacancies over time vis-a-vis the pro-cyclicality dynamics of flows to employment in relation to a number of job offers at the disposal of labour offices.
Actually, the relatively high values observed at the left scale imply that indeed public employment services dispose of only a fraction of unsubsidised vacancies available in the economy. In the periods of high labour demand (both cyclical and seasonal), considerably more unemployed find jobs than are at the disposal of local labour offices. In fact, as seen from the outflows to non-seasonal employment, not all of these transitions are of strictly temporary character, while strong short and medium term cyclicality remains.
In as far as the effects of ALMPs are concerned, although by construction ALMPs and other variables should not be simultaneously correlated, endogeneity might occur in the form of the statistical phenomenon. Therefore, building on the contributions briefed above, we follow the approach commenced by Ibourk et al. (2001), incorporating the ALMPs effects to determine the technical efficiency scores, but not the matching process itself. Namely, we consider the model in which one could demonstrate that different groups of job seekers may exhibit different search intensities, either due to the individual characteristics (e.g. gender, age, education) or because of ALMPs (to be specific, the likelihood of having been subjected to ALMPs). The Cobb-Douglas matching function can be written as:
Mi,t = Ei,t·(Vi,tstock−1)αvs·(V
f low
i,t−1)αvf (4)
X
j
(1 +cj)
αus
αus+uf(Ustock
j,i,t−1) αus αus+uf ·X
j
(1 +cj)
αuf
αus+uf(Uf low
j,i,t−1) αuf αus+uf ·
αus+αuf
.
In this setting,cj coefficients correspond to the actual group-wise search intensities, so that negative values of cj are characteristic for less than average search effort. Rearranging, one obtains:
Mi,t = Ei,t·(Vi,tstock−1)αvs·(Vi,tf low−1)αvf ·(Ui,tstock−1)αus·(Ui,tf low−1)αuf · (5)
1 +X
j cj
Ustock j,i,t−1
Ustock i,t−1
αus
·
1 +X
j cj
Uj,i,tf low−1 Ui,tf low−1
αuf
.
When equation (5) is subjected to logarithmisation, it yields:
mi,t ≈ α0+αusustocki,t−1+αufuf lowi,t−1+αvsvi,tstock−1+αvfvf lowi,t−1+ (6)
+ X
j ρjγi
uf lowj,i,t−1 uf lowi,t−1 +
X
j ̺j
ustock j,i,t−1
ustock i,t−1
Figure 1: Unemployed, vacancies, vacancy ratio and unsubsidised flows from unemployment to employment.
Source: own computations based on ML&SA, 2000-2008.
whereρj≡cjαuf and̺j ≡cjαus. Similar transformation could be made for the vacancies. In other words, as
ei,t= expmaxi{γˆi+t
ˆ
δ}−{γˆi+δt}. (7)
To account for the ALMPs effects one can transform equation (5) to include either a group of job seekers who were subjected to activisation programmes (as in the case of Dmitrijeva and Hazans (2007)) or finance allocated to ALMPs in a particular labour office (as in the case of Puhani (1999)). Ibourk et al. (2001) argue that if Mi,t does not include the number of job seekers de-listed from unemployment registers due to
activisation (e.g. inflows into training programmes), one can formulate a model in which these workers have below average search intensities, i.e. an increase in the size of special training programmes mechanically increases the average observed matching efficiency.
Unfortunately, throughout the 2000-2008 period, for which detailed regional data is available, there have been continuous changes of the reporting standards with job seekers in activisation programmes and pro-grammes themselves were defined differently across years. While the construction of the data set makes it impossible to unequivocally separate some categories of job seekers in treatment, we were able to obtain the reliable sums of people covered by programmes in each local labour office at each point in time. Therefore, in this paper we have decided to consider ALMPs coverage. The starting point for this approach is to assume:
ei,t=Ei,tZi,tθ =Ei,t·Ci,tθF ·T θT
i ·S θS
i , (8)
whereCi,tcorresponds to the coverage in a a particular labour officeiin timet, whileTirefer to the technology
facilities available in a particular office. Similarly,Stry to control for the skills available in a respective offices, namely for example the number of job brokers per number of job seekers. Taking logarithm of (8) and plugging it to equation (5) one can see that the technical efficiency score obtained through the stochastic frontier estimation can be in the second stage tested to depend on ALMPs, labour market structure and capacity in each labour office.
If we additionally specify that efficiency of a labour office might depend on internal resources at disposal, equation (8) yields the standard technical efficiency (7) to change for
ei,t = expmaxi{γˆi+ΘF+ΘT+ΘS+t
ˆ
δ}−{γˆi+ ˆΘF+ ˆΘT+ ˆΘS+δt}. (9)
After obtaining the results of equation (9)viathe estimation of (5) as a stochastic frontier, estimated values of equation (9) will yield left-hand side variables for equation (8). This last equation can be estimated as a regular panel regression, correcting for eventual heteroscedasticity.
The second approach taken in this paper is to estimate the Beveridge curves. Unlike Dmitrijeva and Hazans (2007) we chose to follow Munich and Svejnar (2007) by using the difference-in-difference estimators. Namely, formdenoting matches,
∆mi,t = mi,t−mi,t−1=β(ui,t−1−ui,t−2) +γ(vi,t−1−vi,t−2) +ǫt−ǫt−1 (10)
∆mi,t = β∆ui,t−1+γ∆vi,t−1+ ∆ǫi,t, (11)
where ui,t−1 represents the log of job seekers and vi,t−1 corresponds to vacancies. In addition, Munich and
Svejnar (2007) suggest that further lags of ∆ui,t will be uncorrelated withǫi,tandǫi,t−1, which they use as an
argument in favour of the instrumental variables as a method of estimation.
to approximately 14 500 000 people in the labour force8. Therefore, we avoid scaling by the labour force size,
as it would introduce additional variation negatively affecting statistical properties of the model. However, model is estimated on a subsample without large cities.
Finally, since these are relatively high frequency data, controlling for seasonal variation seems particularly important. Therefore, estimations include monthly dummies to control for differentiated vacancies and job seekers arrival rates throughout each year. In addition, linear and quadratic trends are included to control for country wide labour market fluctuations.
4
Data and results
Data set covers the period of January 2000 till December 2008 of monthly data for eventually 380 local labour offices at policy relevant NUTS4 level. It includes registry information about the number of job seekers, reported vacancies, basic structural characteristics of the local labour markets (i.e. share of female, inexperienced, youth, restructuring and inhabitants of the rural areas among the unemployed). In addition, for each local labour office monthly budgetary data as well as annual human capital endowment data is available. Finally, in 2006 a survey about the use of IT tools in brokering was conducted, providing additional data.
Since these are registry data, they suffer from many well-known shortcomings. First of all, vacancies are systematically underreported and therefore cannot serve for more than a proxy of the employers needs, cfr. Meyer and Sullivan (2003). Unlike in the Czech Republic, in Poland the obligation to declare vacancies is not effectively enforced. Therefore, local labour offices posses information about the vacancies more or less voluntarily submitted by the employers. This problem is severe, because the extent of underreporting may differ from region to region. Namely, in more dynamic labour markets (for example in the big agglomerations) smaller share of employers resorts to use the assistance of labour offices in staffing. Thus, outflow to employment may represent to a lesser extent the effectiveness of matching.
The main interest of this paper lies in the matching efficiency. At the same time, without individual level data it is virtually impossible to evaluate the efficiency of subsidised employment schemes. Therefore, throughout the paper we only analyse unsubsidised (open market) matches, computed as a difference between total matches and subsidised flows into employment9. Summary statistics for the data are presented in Table
(1).
As discussed earlier, vacancies (as well as vacancy ratios) demonstrate variability across time, but also the variance across local labour markets is very large. Vacancy ratio (number of offers per one job seeker) has ranged between 0 and 0.89 in 2008 and between 0 and 0.11 in 2001. Since in respective years severity of this problem was of different magnitudes, one should expect varying output levels - but not necessarily the
relative performance - for labour offices in respective years. Consequently, the ranking of labour offices based on time-specific technical efficiency estimators may be unaffected by the general changes in the labour market outlooks while difference-in-difference estimators may demonstrate variability in the coefficients.
8
This is due to the fact that unemployed frequently deactivate temporarily - one falls out of the labour force if the registration in the local labour office is not confirmed, while the incentives for confirmation partially disappear 12 months after the incidence of unemployment. Each registered unemployed receives health insurance covered by Employment Fund. Once the title to the unemployment benefit expires, this is the only incentive to register, since social assistance benefits are operated by social assistance administration, organisationally and financially independent of PES and means-tested. In some instances, social assistance case workers require registration with the labour office, but this is subject to internal local regulations. In case of households, it is sufficient for one family member to be registered, to assure family coverage.
9
Table 1: Summary statistics
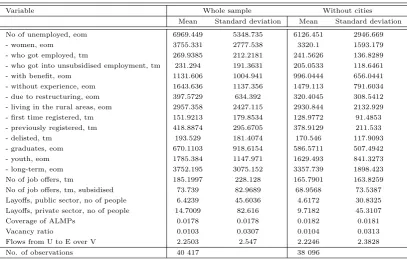
Variable Whole sample Without cities Mean Standard deviation Mean Standard deviation No of unemployed, eom 6969.449 5348.735 6126.451 2946.669 - women, eom 3755.331 2777.538 3320.1 1593.179 - who got employed, tm 269.9385 212.2181 241.5626 136.8289 - who got into unsubsidised employment, tm 231.294 191.3631 205.0533 118.6461 - with benefit, eom 1131.606 1004.941 996.0444 656.0441 - without experience, eom 1643.636 1137.356 1479.113 791.6034 - due to restructuring, eom 397.5729 634.392 320.4045 308.5412 - living in the rural areas, eom 2957.358 2427.115 2930.844 2132.929 - first time registered, tm 151.9213 179.8534 128.9772 91.4853 - previously registered, tm 418.8874 295.6705 378.9129 211.533 - delisted, tm 193.529 181.4074 170.546 117.9093 - graduates, eom 670.1103 918.6154 586.5711 507.4942 - youth, eom 1785.384 1147.971 1629.493 841.3273 - long-term, eom 3752.195 3075.152 3357.739 1898.423 No of job offers, tm 185.1997 228.128 165.7901 163.8259 No of job offers, tm, subsidised 73.739 82.9689 68.9568 73.5387 Layoffs, public sector, no of people 6.4239 45.6036 4.6172 30.8325 Layoffs, private sector, no of people 14.7009 82.616 9.7182 45.3107 Coverage of ALMPs 0.0178 0.0178 0.0182 0.0181 Vacancy ratio 0.0103 0.0307 0.0104 0.0313 Flows from U to E over V 2.2503 2.547 2.2246 2.3828 No. of observations 40 417 38 096
Source: Ministry of Labour and Social Affairs monthly reports from local labour offices (MPiPS-01 and MPiPS-02). EOM stands for the end-of-month figures, TM stands for this-month figures. Coverage of ALMPs denotes the share of unemployed in ANY treatment (training, public or intervention, etc.).
4.1
Results of difference-in-difference estimations
[image:13.595.105.500.545.741.2]Following Munich and Svejnar (2006) and Munich and Svejnar (2007) we adopted a standard procedure. All variables were taken in logs and subsequently first differences (when relevant, lagged). Naturally, this procedure leads to narrowing the sample (one observation for each local labour market is lost due to differentiating and yet one for lagging). We analyse both unsubsidised and subsidised employment. The results are reported in Table (2).
Table 2: Estimates using difference-in-difference estimators
Unsubsidised employment Total employment
Variables All unemployed Only newly registered All unemployed Only newly registered Offers 0.0835*** 0.0839*** 0.166*** 0.169***
(0.00195) (0.00197) (0.00307) (0.00312) Job seekers -1.328*** 0.0265*** -1.919*** 0.0120
(0.0501) (0.00684) (0.0636) (0.00883) Time trend -0.140*** -0.122*** -0.175*** -0.151*** (0.00653) (0.00656) (0.00839) (0.00844) Square of time trend 0.000130*** 0.000114*** 0.000164*** 0.000141***
(6.12e-06) (6.14e-06) (7.85e-06) (7.91e-06) Constant 37.33*** 32.61*** 46.72*** 40.02***
(1.731) (1.737) (2.221) (2.236) Monthly dummies Yes Yes Yes Yes
Annual dummies Yes Yes Yes Yes
Returns to scale Decreasing Decreasing Decreasing Decreasing R2
0.380 0.369 0.298 0.282
F statistic 1 079.86*** 1 063.59*** 743.44*** 685.88*** No. of observations 38 567 38 567 38 880 38 880
The results seem to suggest that the availability of unemployed affects the matching in a negative ways, while the positive effects of access to vacancies is surprisingly small. One might expect that this effect is a spurious scale effect, but such presumption finds no confirmation in data10. Indeed, the estimator for vacancies
is surprisingly small, especially if one considers how low its values with respect to the number of unemployed and employed are (see: Figure 1).
On the other hand, it seems that the availability of the newly registering job seekers affects positively the matching, which is consistent with the hypothesis, that the newcomers may fit better the needs of the employers. However, we are reluctant in interpreting these high values as evidence that newly unemployed match better with vacancies than the existing unemployed. In fact, 87% of unemployment inflows in Poland comprise formerly unemployed, which is confirmed in Munich and Svejnar (2007) (they find the difference in estimators for newly coming unemployed and those already in the registers insignificant for Poland). Moreover, according to the self-reported modes of operations, Piotrowski (2005), newcomers are more likely to receive treatment and job brokering than the individuals with longer unemployment tenure.
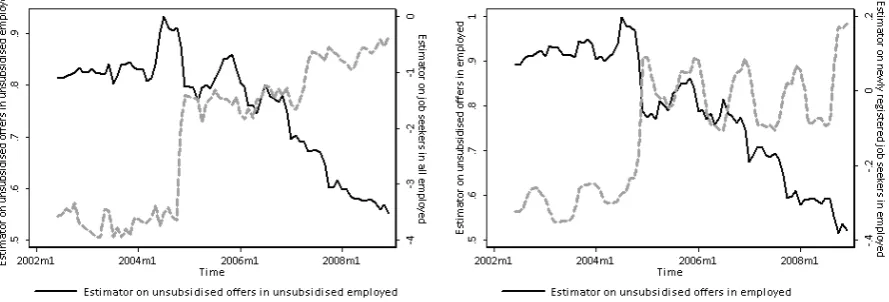
Furthermore, the values of estimators seem to suggest in almost each case decreasing returns to scale. All the estimations tend to support the hypothesis of generally decreasing efficiency (negative coefficients with the time trend, and very low but positive of the squared term). The magnitudes of the vacancies estimators are fairly consistent with Munich and Svejnar (2007). However, the changing of the sign between all unemployed and newly registered unemployed seems puzzling. More specifically, one should expect lower inflows when labour market prospects are better, which implies that our results may be just spurious. To verify this hypothesis we have additionally performed rolling window estimates (with one month step size and 30-month size of the window). These original input variables have been averaged for all units (non-weighted average) to perform the estimation on national aggregates, while the results are depicted on the Figure (3). Visibly, the evolution in across 2002-2003 was very different than in the other periods, while this period coincides with large increase in the unemployment rate and contraction in labour demand.
Our findings differ significantly from the ones presented by Munich and Svejnar (2007). Namely, we use policy relevant data - information about unemployed, vacancies and flows to employment is collected directly from the respective labour offices (districts). Secondly, we present the estimation for unsubsidised employment, which constitutes our preferred specification, columns (1) and (2). As suggested by Figure 1, outflows to employment are considerably bigger over the whole time period than actual matching by the labour offices. Therefore, matching does not correspond to directly to the activities of labour offices but the shallowness of a local labour market12. Finally, these estimates have demonstrated that despite inclusion of monthly and
annual dummies, one can demonstrate negative trend, which was not analysed by Munich and Svejnar (2007), while there is little stability of the matching processes (large responsiveness to the changing labour market outlooks). This is confirmed despite seizable improvement as of 2005.
Although these findings provide some useful insights, they do not allow to capture the relation between local conditions and the matching performance. This is enabled if one takes stochastic frontier approach, which is pursued in the next section.
10
In fact, this finding holds even if one considers regions with below average pool of unemployed. Detailed results available upon request.
12
Figure 2: Upper left and right: all employed are the predicted variable
Figure 3: Unsubsidised employment is the predicted variable11.
4.2
Stochastic frontier estimations
For the estimation of stochastic frontier we have used a time-varying decay model,i.e. Battese-Coelli parametri-sation of time effects. In this parametriparametri-sation, the inefficiency term is modeled as a truncated-normal random variable multiplied by a specific function of time. In both models, the idiosyncratic error term is assumed to have a normal distribution, while the random inefficiency term constitutes the only panel-specific effect. Results are reported in Table (3).
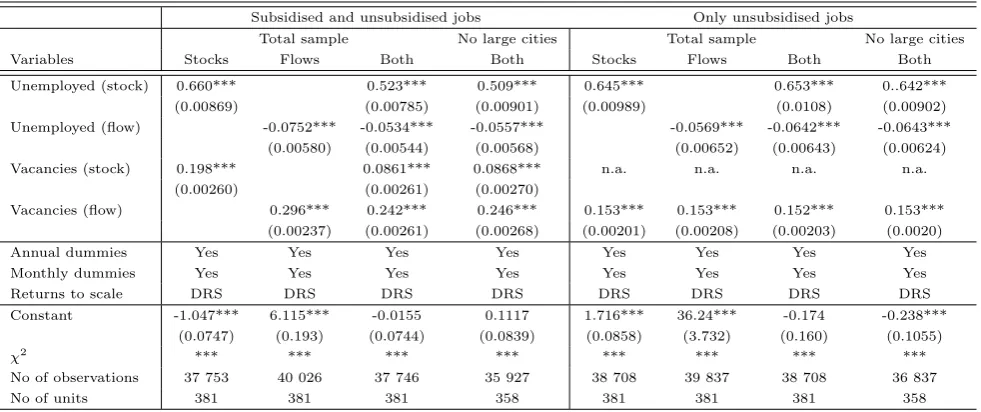
These results are somewhat more intuitive than difference-in-difference estimators. Firstly, all specifications consistently confirm decreasing returns to scale. Secondly, estimates are fairly stable across specifications. Thirdly, estimators by the pool of unemployed are considerable, while the ones by vacancies tend to be mi-nuscule13. Intuitively, ”newly coming” unemployed diminish the matching capacity (negative and significant
coefficient), while arriving job offers increase it. While the latter is consistent with Dmitrijeva and Hazans (2007), the former is supported by the self-reported usus of operation by labour offices, Piotrowski (2005), as discussed earlier.
Unlike in the case of Estonia, as discussed by Dmitrijeva and Hazans (2007), inclusion of flows does not lead to lowering the significance of stocks. Nonetheless, the elasticity with respect to the unemployed seems to
13
[image:15.595.70.515.298.449.2]Table 3: Stochastic frontier estimations
Subsidised and unsubsidised jobs Only unsubsidised jobs
Total sample No large cities Total sample No large cities Variables Stocks Flows Both Both Stocks Flows Both Both Unemployed (stock) 0.660*** 0.523*** 0.509*** 0.645*** 0.653*** 0..642***
(0.00869) (0.00785) (0.00901) (0.00989) (0.0108) (0.00902) Unemployed (flow) -0.0752*** -0.0534*** -0.0557*** -0.0569*** -0.0642*** -0.0643***
(0.00580) (0.00544) (0.00568) (0.00652) (0.00643) (0.00624) Vacancies (stock) 0.198*** 0.0861*** 0.0868*** n.a. n.a. n.a. n.a.
(0.00260) (0.00261) (0.00270)
Vacancies (flow) 0.296*** 0.242*** 0.246*** 0.153*** 0.153*** 0.152*** 0.153*** (0.00237) (0.00261) (0.00268) (0.00201) (0.00208) (0.00203) (0.0020) Annual dummies Yes Yes Yes Yes Yes Yes Yes Yes Monthly dummies Yes Yes Yes Yes Yes Yes Yes Yes Returns to scale DRS DRS DRS DRS DRS DRS DRS DRS Constant -1.047*** 6.115*** -0.0155 0.1117 1.716*** 36.24*** -0.174 -0.238***
(0.0747) (0.193) (0.0744) (0.0839) (0.0858) (3.732) (0.160) (0.1055)
χ2
*** *** *** *** *** *** *** ***
No of observations 37 753 40 026 37 746 35 927 38 708 39 837 38 708 36 837 No of units 381 381 381 358 381 381 381 358
Notes: Dependent variable: log of monthly flows to employment out of unemployment (unemployed de-registered due to com-mencing employment). Monthly and annual dummies statically significant, detailed results available upon request. ”Flows” of variables are original data (reported by labour offices as ”this month” registrations and ”this month” vacancies). ”Stocks” of unemployment are originally reported (as ”end of month”), however stock of vacancies was computed as a sum of this month vacancies and the lagged ”end of month” status (the number of unfilled vacancies reported on the last day of the previous month). Variables taken in logarithms, lagged when necessary. Standard errors reported in parentheses. ***, ** and * denote significance at 1%, 5% and 10% levels, respectively
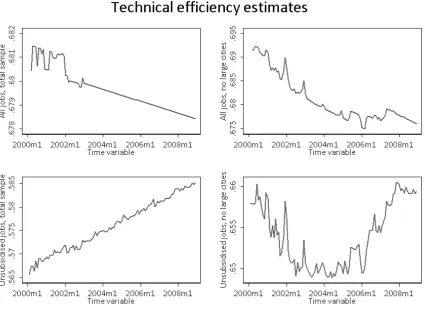
be the largest, with one 1% more people in the stock of unemployed resulting in 0.6-0.7% persons employed. However, if one accounts for the dynamic effects, increase by 1% of the inflows leads effectively lowers the employment by slightly more than a half of a percentage point. Having established the production function as specified in Table 3 one may obtain a variety of technical efficiency estimates. Indeed, they differ across specifications. Figure 4 depicts evolutions across time (averaged over units).
Clearly, all these estimates are fairly stable across time, with a maximum of two-three percentage points of changes. The average across specifications ranges between 0.57 (unsubsidised jobs, total sample) and 0.68 (all jobs, without large cities), standard deviation ranges from 0.12 to 0.13. Based on schemes in Figure 4 one can say that average efficiency of matching lowers with the growth of vacancies (upper left and upper right schemes). The clear downward trend in the upper left panel may signify either of the two effects: either the best districts (usually large cities) move the frontier outwards consistently, which leaves everybody else lagging behind or efficiency for leaders decreases slower than for everybody else. The scheme in the upper right corner seems to lend support to the former hypothesis, since without large cities the trend is downward sloping as well.
At the same time, lower left and right schemes reveal an interesting pattern. Namely, for unsubsidised job offers - our preferred specification - there seems to be a clear growing trend for the total sample, which changes to a u-shaped one if large districts are excluded. This u-shaped pattern is a reverse of the general labour market outlooks, but demonstrates no correspondence either across units or across time to the ratio of unsubsidised over subsidised offers (correlation of 0.038 within and 0.071 between).
Figure 4: Distributions across specifications, time and unit dimensions
4.3
Covariates of technical efficiency
Following Ibourk et al. (2001) we analyse the covariates of technical efficiency scores. Naturally, the best approach would have been to adopt difference-in-difference, but the actual scores of efficiency at each point in time are estimated in a relative way. Therefore, the change in the score from time t to time t+ 1 does not necessarily give any information as to the actual performance of a particular labour market. Therefore, we estimate the regression in levels. Although, the regression construct specifies causality direction from the RHS variables to the LHS one - we are only trying to establish if there is a link between some control factors and the individual efficiency scores14
The characteristics of a local labour market are approached by the means of proxies. Namely, some local markets may be more dynamic than others, while some may be populated by more ”difficult” unemployed than others. To account for this differentiation we have used the following measures:
• Labour market structure
– Share of females in total unemployment (mean 0.544, min 0.39 max 0.79) and in total flows to employment (mean 0.464, min 0.026, max 0.981). In general this corresponds to the diversity of job
14
creation and destruction in particular labour markets.
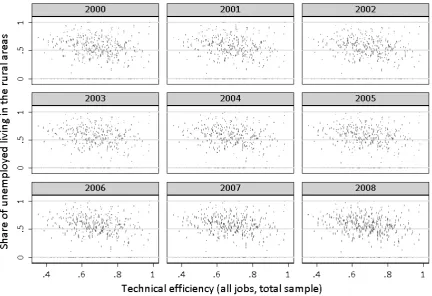
– Share of rural unemployed in total unemployment (mean 0.483, min 0, max 1). In general rural labour markets are less dynamic. Therefore we expect this variable to account for relative labour market hardship.
– Share of youth (mean 0.265, min 0.047, max 0.527) in the pool of unemployed. Youth demonstrate usually higher adaptability.
– Share of no or low skilled unemployed among jobless (mean 0.244, min 0.052, max 0.544). These workers represent typically lower value to the employers, which may constitute an obstacle in smooth unemployment-to-employment transitions.
– Share of first-time registrants in inflows (mean 0.022, min 0.002, max 0.155). This measure captures the availability of ”new” job seekers that may foster the quality of the matching process.
– Share of delisted in the total unemployment (mean 0.030, min 0.009, max 0.226). This measure captures the so-called ”discouraged” job seekers.
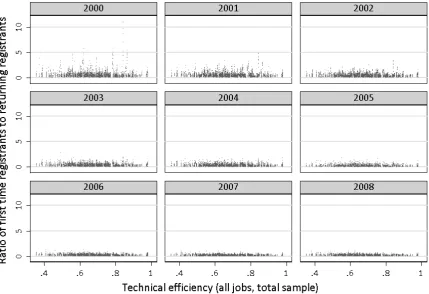
– Ratio of first time to returning registrants (mean 0.404, min 0.032, max 11.08)
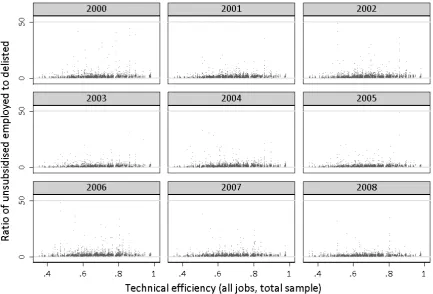
– Ratio of employed to delisted (mean 1.897, min 0.170, max 222.049) and unsubsidised employed to delisted (mean 1.584, min 0.135, max 192.665).
– No of job brokers per one unemployed (mean 0.00002, min 0.000004, max 0.00083).
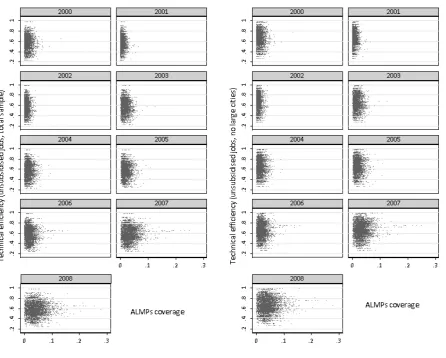
• Coverage of ALMPs (mean 0.017, min 0.005, max 0.277). As discussed earlier, this measure is constructed
as a number of individuals in ANY treatment (trainings, intervention employment, public works) over the pool of unemployed in a respective district at each point in time15.
• Size of the labour market (no. of unemployed, inflows and offers).
Results of these estimations are reported in Table (4).
The capacity in the public employment services to match employers needs with the job seekers may be negatively affected by some structural characteristics, but is supposed to be positively affected by policy variables, e.g. number of job brokers (per no of unemployed) or ALMPs coverage. However, the verification of these hypotheses is largely discouraging. Namely, despite statistical significance, most of the obtained estimators are extremely low. Consequently, it seems that all of these covariates have little power to explain the differentiation of technical efficiency scores. This contention is confirmed byR2- between values are mostly
negligible, while within values are driven by regularities in trends. Although signs are consistent across samples and specification, they are also intuitive and mostly confirm common sense relations.
As to the structural variables larger percentage of females in the pool of unemployed signifies less diversified labour markets, which correlates well with lower capacity for matching. At the same time, higher share of female outflows signifies exactly the opposite, which is consistent with a positive and significant estimator. Counter intuitively, rural areas seem to be characterised by higher matching efficiency, but - as we already argued - the between variance is poorly addressed by our model. Consequently, the significance of the estimator refers to the changes in the shares of rural unemployed, which tend to grow with labour market improvements (people in small and mid-sized towns outflow to employment) and decrease in the downturns on the labour market (see Figure 6).
15
Table 4: Determinants of technical efficiency
All jobs Unsubsidised jobs All jobs Unsubsidised jobs Unsubsidised jobs Variables Total sample No large cities Total sample No large cities Total sample No large cities Total sample No large cities Total sample No large cities
(1) (2) (3) (4) (5) (6) (7) (8) (9) (10)
Share of females -0.00622*** -0.0511*** -0.0495*** -0.00175*** -0.00866*** -0.000487*** -0.00160*** -0.0143*** -0.0142*** -0.000775*** in unemployment (0.000187) (0.00152) (0.00143) (0.0000) (0.000648) (0.0000) (0.000128) (0.00110) (0.000643) (0.0000) Share of females 0.000743** 0.00713*** 0.00680*** 0.000120 0.0114*** 0.000693*** 0.00209*** 0.0190*** 0.0162*** 0.000824*** in employment (0.000296) (0.00238) (0.00230) (0.0000) (0.00118) (0.0000) (0.000236) (0.00196) (0.00100) (0.0000) Share of people -0.00643*** -0.0507*** -0.0492*** -0.00163*** -0.00745*** -0.000444*** -0.00201*** -0.0166*** -0.00739*** 0.000436*** with low or no skills (0.000148) (0.00119) (0.00117) (0.0000) (0.000482) (0.0000) (7.93e-05) (0.000650) (0.000509) (0.0000) Share of laid off 0.00298*** 0.0234*** 0.0281*** 0.000738*** 0.00284*** -0.000132*** 0.000384*** -0.00286*** 0.00385*** 0.000189*** (due to restructuring) (0.0000) (0.0000) (0.0000) (0.0000) (0.000367) (0.0000) (7.28e-05) (0.000598) (0.000369) (0.0000) Share of people 0.00321*** 0.0258*** 0.0288*** 0.00103*** 0.00471*** 0.000314*** 0.000259** 0.00464*** 0.00698*** 0.000369*** living in the rural areas (0.0000) (0.00151) (0.00142) (0.0000) (0.000554) (0.0000) (0.000113) (0.000931) (0.000576) (0.0000288) Share of first-time -0.00559*** -0.0452*** 0.0452*** 0.00138*** -0.00504*** -0.000259*** 0.00132*** 0.0107*** -0.00134 0.00000655 registrants (0.000508) (0.00413) (0.00372) (0.0000) (0.00144) (0.0000) (0.000289) (0.00251) (0.00147) (0.0000) Share of people delisted -0.00166*** -0.0128*** -0.0151*** -0.000425*** -0.00129** -0.000782*** -0.000447*** -0.00384*** -0.000893 -0.00000346 from the registries (0.000186) (0.00150) (0.00143) (0.0000) (0.000537) (0.0000) (0.000110) (0.000923) (0.000620) (0.0000) Share of youth 0.00948*** 0.0741*** 0.0866*** 0.00249*** 0.00147*** 0.0523*** 0.000117 0.00139** 0.00332*** 0.000124*** (under 25/27 years) (0.0000) (0.00075) (0.0000) (0.0000) (0.0000) (0.00052) (0.0000) (0.0000) (0.0000) (0.0000) Ratio of first-time to 0.000254*** 0.00202*** 0.00199*** 0.00005*** 0.00010* 0.00005* 0.00011 0.00095 0.000136 0.000279 returning registrants (0.0000) (0.000212) (0.000189) (0.0000) (0.0000) (0.0000) (0.0000) (0.0000) (0.0000) (0.0000) Ratio of employed to 0.00000649 0.00000550* 0.00000280 0.00000123* 0.00000780 0.00000510* 0.00000302 0.0000277* 0.000683 0.000453* delisted (0.0000) (0.0000) (0.0000) (0.0000) (0.0000) (0.0000) (0.0000) (0.0000) (0.0000) (0.0000) Ratio of employed to 0.0000116** 0.0000782** 0.000131*** 0.000295** 0.0000215* 0.0000125** 0.0000504** 0.0000450** 0.0000240* 0.0000162** delisted in the rural areas (0.0000) (0.0000) (0.0000) (0.0000) (0.0000) (0.0000) (0.0000) (0.0000) (0.0000) (0.0000) Ratio of unsubsidised -0.0000720 -0.0000621 0.0000228 -0.0000112 0.0000705 0.0000505 0.0000443* 0.0000390** 0.0000280 -0.00000339 employed to delisted (0.0000) (0.0000) (0.0000) (0.0000) (0.0000) (0.0000) (0.0000) (0.0000) (0.0000) (0.0000) No of job brokers 0.00812*** 0.0275 0.00554*** 0.000007 0.00788*** 0.000005 0.00820*** 0.000008 0.0045*** 0.000006 per one unemployed (0.000183) (0.0014) (0.0014) (0.0000) (0.0000) (0.0000) (0.0000) (0.00086) (0.0000) (0.0000) ALMPs coverage -0.00346*** -0.0275*** -0.0254*** -0.000807*** -0.00380*** -0.000150*** -0.000820*** -0.00587*** -0.00245*** -0.000106*** (0.000183) (0.00147) (0.00144) (0.0000481) (0.000509) (0.0000251) (0.000104) (0.000862) (0.0000) (0.0000) Fixed effects Unit Unit Unit Unit Unit Unit Unit Unit Year, month and unit No of registered Negative*** Negative*** Negative*** Positive***
No of unemployed Negative*** Negative*** Negative*** Negative*** No of vacancies Negative*** Negative*** Negative*** Negative***
Time trend Negative*** Negative*** Negative*** Negative***
Squared time trend Negative*** Negative*** Negative*** Positive***
Constant 0.672*** 0.610*** 0.646*** 0.648*** 0.568*** 0.647*** 0.668*** 0.554*** 0.568*** 0.650***
R2
between 0.083 0.073 0.054 0.077 0.000999 0.000770 0.0141 0.000609 n.a. n.a.
R2within 0.791 0.788 0.832 0.790 0.977 0.937 0.930 0.925 n.a. n.a.
No of units 379 314 380 315 378 315 378 314 360 314
No of observations 31 189 30 638 31 962 31 396 31 962 31 396 31 189 30 638 31 962 31 396
Note: Dependent variables: estimates of the technical efficiency from the stochastic frontier as reported in Table 3. Monthly and annual dummies statically significant, detailed results available upon request. Heckman test confirms the use of fixed effects.
Similarly, although the statistical significance is very high, the relationship between restructuring and matching efficiency is clearly spurious - it changes signs across specifications, while clearly the effects of restruc-turing decreased in time, which correlates positively with downward sloping estimations of technical efficiency and negatively with upward sloping ones (please, recall Figure 4). Indeed, graphical inspection reveals higher variation in this variable in earlier years (see Figure 7). Youth, on the other hand, is steadily positively related to efficiency, which is consistent with the creaming hypothesis, as suggested by Tyrowicz (2006).
The interesting findings concern the proxy for job brokering capacity - namely the number of job brokers over the number of unemployed. Naturally, the estimators are positive, but they loose significance if large cities are excluded from the sample. This may be a consequence of the fact that predominantly the labour offices in the large cities have larger numbers of job brokers (mean for total sample is around 5.7, mean for large cities is around 22.6). Because these are larger labour markets, also the potential for obtaining vacancies is larger, which means that job brokers may actually be more productive.
Finally, the ratios of the nature of inflows and the reasons for outflows have the intuitive signs, but their significance is not too high. Also, the sizes of the estimators are extremely low. Again, as revealed by graphical inspection - most of the ”explanatory” power is driven by the year effects, Figures 8 - 10.
As to the active labour market policies, the results suggest consistently negative and significant estimators, which would suggest either a very high lock-in effect or essentially ineffectiveness of ALMPs. Either way, these findings are rather counterintuitive and striking. However, it seems that the significance is largely driven by some spurious effects. Namely, graphical inspection fails to provide any convincing evidence supporting the negative slope in the relationship - other than higher dispersion of ALMPs coverage in mid-ranges of technical efficiencies, Figure 5. Such ”coincidence” is natural if one recognises that the mid-range is also usually mostly diversified in terms of all underlying structural characteristics.
Summarising, there seem to be little systematic covariates of the technical efficiency estimates - be it policy variables of structural characteristics of the local labour markets. The fit of the model is satisfactory only in the within context - the between variance has remained unaddressed despite inclusion of a wide variety of measures. The conclusions suggest however, that the efficiency of matching has not been affected by the increase of the ALMPs coverage that has occurred over this period. Consequently, although failure to reject the null hypothesis of no relationship between these two variables is not a strong finding - it points to the lack of efficiency fostering mechanism in the algorithms of ALMPs financing.
5
Conclusions
The ”black box” of Petrongolo and Pissarides (2001) is somewhat more comprehensible when differentiated estimation techniquest are applied, but remains fairly ”black” in the case of Poland. In this paper we have used a unique data set and estimated the matching function at a policy relevant level of local labour markets. We sought to link the matching efficiency with the ALMPs and this link has proven to be nonexistent.
This paper approaches the question of efficiency in job placement using regional data for Polish regions (policy relevant NUTS 4 level) over the time span of 2000-2008. Using a unique data set we estimate the matching function using stochastic frontier as well as difference-in-difference estimators. The former provides an estimate of the matching efficiency changes observed in both time and regional dimensions. The latter provided point estimates, but employing rolling window estimation on averaged data revealed high time variation of the parameters.
Figure 5: Scatterplots for coverage and estimated technical efficiency scores for unsubsidised employment.
offices. We use these data to explain the exceptional variation in estimated efficiency scores. Our findings suggest that matching abilities are highly driven by demand fluctuations, while unemployment structure, ALMPs and individual labour office capacities have little explanatory power.
Analysing the data for Polish regions over 2000-2008 is barely an analysis of a transition country. Despite extremely high values of unemployment rates throughout this period, transition has commenced in 1989, while the period of 1999-2002 is believed to convey the so-called ”second” wave of unemployment. Regional differentiation of labour market conditions - exceptionally large in the region, Tyrowicz and W´ojcik (2010) -is not only pers-istent, but also cannot be explained by the structural factors. As th-is research demonstrates, currently ALMPs and in principle the capacity of local labour offices do not translate to higher matching efficiency. This may be explained by two competing hypotheses. In the first, the dynamics of this relationship may require some threshhold, which has not yet been attained. However, the values of ALMPs coverage have increased considerably, while no clear pattern of relation may be said to emerge. The other hypothesis involves the incentives associated with the algorithm allocating funds for ALMPs. If availability of funds is not related to the effectiveness, increasing the financing (and thus the coverage) does not have to lead to better matching efficiency.
seekers are exploited. Secondly, the fact that none of the analytical techniques was able to link reliably changes in technical efficiency to active labour market policies, while the individual capacity of labour offices was only relevant as a filter between large cities (with large labour markets) and the majority of the districts. Thus, it seems that if availability of finance was more directly related to results, funds allocated to ALMPs and labour offices could yield better, more tangible results.
References
Calmfors, L.: 1993, Centralisation of Wage Bargaining and Macroeconomic Performance: A Survey, OECD Economics Department Working Papers 131, OECD Economics Department.
Calmfors, L., Forslund, A. and Hemstr¨om, M.: 2002, Does Active Labour Market Policy Work? Lessons from the Swedish Experiences,Seminar Papers 700, Stockholm University, Institute for International Economic Studies.
Calmfors, L. and Skedinger, P.: 1995, Does Active Labour Market Policy Increase Employment? Theoretical Considerations and Some Empirical Evidence from Sweden,Oxford Review of Economic Policy11(1), 91– 109.
Coles, M. G. and Petrongolo, B.: 2002, A Test Between Unemployment Theories Using Matching Data,CEPR Discussion Papers 3241, C.E.P.R. Discussion Papers.
Coles, M. G. and Smith, E.: 1998, Marketplaces and matching,International Economic Review39(1), 239–54.
Destefanis, S. and Fonseca, R.: 2007, Matching Efficiency and Labour Market Reform in Italy. a Macroecono-metric Assessment,Labour 21, 57–84.
Dmitrijeva, J. and Hazans, M.: 2007, A Stock-Flow Matching Approach to Evaluation of Public Training Program in a High Unemployment Environment,Labour21(3), 503–540.
Fahr, R. and Sunde, U.: 2002, Estimations of Occupational and Regional Matching Efficiencies Using Stochastic Production Frontier Models,IZA Discussion Papers 552, Institute for the Study of Labor (IZA).
Fahr, R. and Sunde, U.: 2005, Regional Dependencies in Job Creation: An Efficiency Analysis for Western Germany,IZA Discussion Papers 1660, Institute for the Study of Labor (IZA).
Greg, P. and Petrongolo, B.: 2005, Stock-flow Matching and the Performance of the Labor Market,European Economic Review49, 1987–2011.
Hagen, T.: 2003, Three Approaches to the Evaluation of Active Labour Market Policy in East Germany Using Regional Data,Technical report.
Ibourk, A., Maillard, B., Perelman, S. and Sneessens, H.: 2001, The Matching Efficiency of Regional Labour Markets a Stochastic Production Frontier Estimation, France 1990-1995, IZA Discussion Papers 339, Institute for the Study of Labor (IZA).
Lehmann, H.: 1995, Active Labor Market Policies in the OECD and in Selected Transition Economies,Policy Research Working Paper Series 1502, The World Bank.
Meyer, B. D. and Sullivan, J. X.: 2003, Measuring the Well-Being of the Poor Using Income and Consumption,
NBER Working Papers 9760, National Bureau of Economic Research, Inc.
M¨unich, D., Svejnar, J. and Terrell, K.: 1997, The Worker-Firm Matching in the Transition: (Why) Are the Czechs More Successful than Others?,Working Paper 107, The William Davidson Institute.
Munich, D. and Svejnar, J.: 2006, Unemployment and Worker-Firm Matching: Theory and Evidence from East and West Europe,mimeo, University of Michigan.
Munich, D. and Svejnar, J.: 2007, Unemployment in East and West Europe, IZA Discussion Papers 2798, Institute for the Study of Labor (IZA).
Munich, D., Svejnar, J. and Terrel, K.: 1998, Worker-Firm Matching and Unemployment in Transition to a Market Economy: Why Are The Czechs More Successful Than Others,University of Michiganmimeo.
Petrongolo, B. and Pissarides, C. A.: 2001, Looking Into the Black Box: A Survey of the Matching Function,
Journal of Economic Literature39(2), 390–431.
Piotrowski, B. e.: 2005, Raport z badania ankietowego dotyczacego realizacji projektow w ramach dzialania 1.2 i 1.3 spo rzl,Technical report, Ministry of Labour and Social Affairs.
Puhani, P. A.: 1999, Estimating the Effects of Public Training on Polish Unemployment by Way of the Augmented Matching Function Approach,Technical report.
Sztanderska, U. and Socha, M.: 2001, Strukturalne podstawy bezrobocia w Polsce (Structural Character of Unemployment in Poland), PWN, Poland.
Tyrowicz, J.: 2006, Organizacje pozarzadowe na rynku pracy: unikatowe grupy czy universalne kompetencje? (ngos in the labour market services: Unique groups or universal competences?),inM. Boni, I. Gosk, B. Pi-otrowski, J. Tyrowicz and K. Wygnanski (eds),Rola organizacji pozarzadowych na rynku pracy (The Role of NGOs in Providing Employment Services in Poland), Fundacja Inicjatyw Spoleczno-Ekonomicznych (Socio-Economic Initiatives Foundation.
Tyrowicz, J. and W´ojcik, P.: 2009, Regional Unemployment Dynamics In Poland - A Convergence Approach,
inF. Caroleo and F. Pastore (eds),A New Regional Geography of Europe?, Physica Verlag.
Tyrowicz, J. and W´ojcik, P.: 2010, Some Stylised Facts on Unemployment Convergence in Transition,Eastern European Economics1(1).
Figure 6: Scatterplot
Figure 8: Scatterplot