Munich Personal RePEc Archive
Are self-employment training programs
effective? Evidence from Project GATE
Michaelides, Marios and Benus, Jacob
IMPAQ International, University of Maryland - College Park
1 February 2010
Are Self-Employment Training Programs Effective?
Evidence from Project GATE
Jacob Benus
(IMPAQ International)
Marios Michaelides
(University of Maryland – College Park; IMPAQ International)
February 2010
Abstract
In 2002, the U.S. Department of Labor and the Small Business Administration implemented Project GATE, an experimental demonstration program designed to provide free self-employment assistance to individuals interested in starting their own business. This paper uses data from Project GATE to examine the efficacy of public self-employment training programs in the modern U.S. economy. Our analyses show that GATE led to significant improvements in the post-training outcomes of treatment group participants who were unemployed at the time of application. Particularly, GATE had a significant positive impact on new business starts and sustainability for unemployed participants five years after random assignment. For those who were unemployed at random assignment, GATE also led to higher employment likelihood and higher total earnings five years after random assignment. GATE had no impact, however, for participants who were employed, self-employed, or out of the labor force at the time of application.
Keywords: self-employment, small business, unemployment, workforce development, SEA, Project GATE.
Are Self-Employment Training Programs Effective? Evidence from Project GATE
Introduction
Self-employment has historically been an attractive option for American workers. At the start of the 21st century, about 12% of employed workers in the U.S. were self-employed.1 In 2004, the median income of self-employed workers was 35% higher than the median income of salary workers, while the family worth of the self-employed was five times larger than that of salary workers (Bucks et al., 2006). Besides the potential individual gains, self-employment also contributes at the macroeconomic level. According to the U.S. Census Bureau, new businesses created an average of 3.0 jobs in 2005, compared to an average of 1.9 jobs for existing businesses. So, the successful pursuit of self-employment is important since it provides an attractive alternative to salary employment (Bates, 1997; Kwansa, 1998; Glocker and Steiner, 2007) and also contributes to the overall growth of the U.S. economy (Bregger, 1996; Reynolds and White, 1997; Acs, 1999; Minniti and Bygrave, 2004; Davies et al., 2008).
Aspiring business owners may be willing to work hard and invest a substantial portion of their time in starting their own business, but face numerous obstacles in their efforts to successfully pursue self-employment. Some of the most important obstacles may be lack of business background and expertise (Hout and Rosen, 2000; Dunn and Holtz-Eakin, 2000; Fairlie and Robb, 2007) and lack of access to credit (Blanchflower et al., 2003; Cavalluzzo and Wolken, 2005). These problems may be responsible for the high failure rate of new businesses within the first two years of operation (Dennis, 1999; Lowrey, 2009).
Because of the importance of small businesses in the U.S. economy, supporting self-employment has received a lot of attention from policymakers in the past 20 years. At the
1
beginning of the 1990s, the U.S. Department of Labor (DOL) funded two self-employment demonstration programs; the Washington Self-Employment and Enterprise Development and the Massachusetts Self-Employment Demonstration. The goal of those programs was to explore if self-employment training programs were a viable policy tool for promoting the reemployment of unemployed workers through the creation of small businesses. Both programs were found to be effective in assisting participants start their own business (Benus et al., 1995). With the passage of the North America Free Trade Agreement Implementation Act in 1993, Congress authorized states to establish self-employment assistance (SEA) programs targeting unemployed workers for a 5-year period. This led to the implementation of a number of SEA programs, including those in Maine, New Jersey, and New York (Kosanovich et al., 2002). The early SEA programs were considered generally effective, prompting Congress to permanently authorize such programs for the unemployed (Vroman, 1997).
Project GATE’s design provides a unique opportunity to examine the effectiveness of self-employment programs in the modern U.S. economy. In addition, GATE differs from the early 1990s demonstration programs and the SEA programs (which specifically targeted the unemployed) in that it served all interested applicants, regardless of their employment status. Previous research suggests that the unemployed may be more motivated than their peers to pursue self-employment since they view self-employment as an alternative to salary employment or as a way to avoid labor market discrimination (Sowell, 1981; Meager, 1992; Bates 1997; Rissman, 2003; Glocker and Steiner, 2007). It is possible, therefore, that self-employment programs may be more effective for the unemployed than for other individuals. Project GATE provides an opportunity to examine if self-employment training programs have a heterogeneous treatment effect, by employment status.
This paper uses Project GATE program data to answer questions relating to the effectiveness of self-employment training programs in the modern U.S. economy. Do self-employment training programs have a significant impact on the post-training outcomes of participants? Are such programs more effective for the unemployed? What should be the focus of future self-employment training programs?
comparison of treatment-control outcome means shows that treatment group participants had significantly better post-training outcomes than their control group peers.
Section 3 uses regression models to estimate the average GATE treatment effect controlling for treatment-control group differences in observed characteristics that may have occurred by chance. In addition, we examine whether GATE had a heterogeneous impact on participants, by employment status. Our analyses show that GATE led to substantial improvements in the post-training outcomes of participants who were unemployed at the time of application, but had no impact on other participants. Finally, we provide a summary of our findings and discuss their policy implications.
1. Project GATE Overview
In their efforts to promote self-employment and create jobs during a period of relatively slow economic activity, DOL partnered with SBA in 2002 to sponsor a self-employment training program, called Project GATE (Growing America Through Entrepreneurship). The goal of Project GATE was to assist individuals interested in starting their own business by providing them an array of free self-employment services. Project GATE was implemented between 2003 and 2005 in Pennsylvania, Minnesota, and Maine. All interested individuals could enroll in the program by applying in one of the seven designated DOL One-Stop Career Centers (one site in each Philadelphia, Pittsburgh, and Minneapolis/St. Paul, two sites in rural Minnesota, and two sites in rural Maine).
circumstances, particularly regarding their finances (e.g., credit history, household income). Upon application, applicants were randomly assigned to the treatment or to the control group. Those in the treatment group were offered an initial assessment of their individual business needs and were then referred to a wide array of self-employment services. These included classes, workshops, and seminars that aimed to assist them in understanding all the different aspects of starting and operating a business. Moreover, individual business counseling was offered where participants had the opportunity to discuss their business idea, receive help in producing or improving their business plan, and identify ways to address their individual business needs. In addition, treatment group participants were offered assistance in securing financing for their business, either through the SBA MicroLoan program or through other sources. These services were provided by the SBA’s Small Business Development Centers and by nonprofit community-based organizations. In contrast, those in the control group were offered none of the available services under Project GATE.
responded to the Wave 1 and Wave 2 surveys and 58% responded to all three surveys.2 The high response rates in the follow-up surveys resulted in a nearly equal representation of treatment and control group members among respondents.
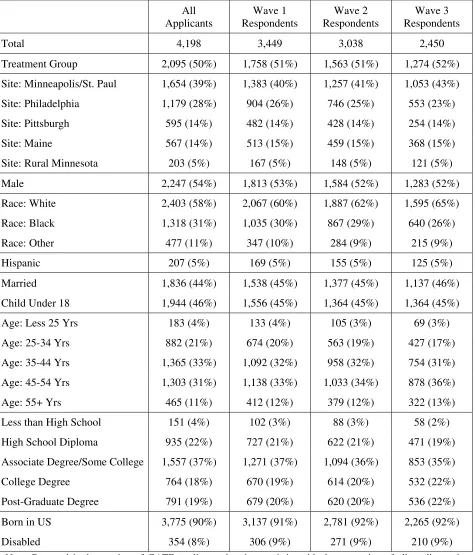
Table 2 presents the baseline characteristics of four groups of GATE applicants: all applicants, Wave 1, Wave 2, and Wave 3 respondents. Most GATE applicants were in the Minneapolis/St. Paul site (39%), followed by Philadelphia (28%). Pittsburgh accounted for 14% of all applicants, as did Maine, while only 5% of applicants were in rural Minnesota. Notably, there were only slightly more male than female applicants and, while the majority of applicants were white, there was also great interest in GATE participation by blacks. About two thirds of all applicants were between the ages of 35-55, while only a quarter had a high school diploma or less. The high survey response rates resulted in mostly similar proportions of applicants by GATE site and by baseline characteristic in the three follow-up surveys.
Table 3 shows about half the applicants were unemployed at the time of application, that is, they did not have a salary job and reported they were actively looking for a job at that time.3 The remaining applicants were employed in a salary job (28%), were self-employed (13%), or were not in the labor force (9%).4 As Table 3 shows, 37% of applicants reported having prior self-employment experience (Ever Self-Employed), while 23% already had a completed business plan at the time of application (Business Plan). Nearly half the GATE applicants had a poor credit history score either because they lacked credit history or because they had a bad credit history record (Bad/No Credit History). About 45% of applicants had relatives supporting their family
2
The data also report weights that can be used to adjust for differences in survey non-response. These weights were constructed using variation in the observable characteristics between respondents and non-respondents – for more details, see Benus et al. (2009).
3
Note that 272 (or 13%) of unemployed GATE applicants reported owning a business that was inactive at the time of application.
4
while they were pursuing self-employment (Family Support). Finally, 51% of applicants had annual household income of $25,000 or higher but less than $75,000 (Income: $25K-$75K), while 35% had income of less than $25,000 (Income: <$25K). Notably, the distribution of employment characteristics, self-employment experience, and personal finances of respondents in the follow-up surveys was similar to that of all GATE applicants.
2. Post-Training Outcomes of GATE Applicants
GATE applicants reported their post-training outcomes in the three follow-up surveys, conducted 6 months (Wave 1), 18 months (Wave 2), and 60 months (Wave 3) following random assignment. Using participant responses to the follow-up surveys, we construct the following measures of post-training outcomes: likelihood of starting a new business after random assignment; likelihood of starting a new business by Wave 1 that still operates at the time of each survey; likelihood of being self-employed at the time of each survey; and likelihood of employment (i.e., in a salary job or self-employed) at the time of each survey.
New business sustainability was higher among treatment group than among control group participants. As Table 4 shows, 20.0% of the treated started a business by Wave 1 that was still in operation at the time of the Wave 1 survey, compared to 14.8% of those in the control group; the difference is 5.2 percentage points and significant at the 1% level. Similarly, the treated were more likely than others to start a new business by Wave 1 and sustain it 18 months and 60 months after random assignment. Treatment group participants were also significantly more likely than their control group peers to be employed at Wave 1, but equally likely to be self-employed at Wave 2 and at Wave 3.5 Furthermore, the employment likelihood was higher among treatment group than among control group participants at Wave 1 but statistically equal at Waves 2 and 3.
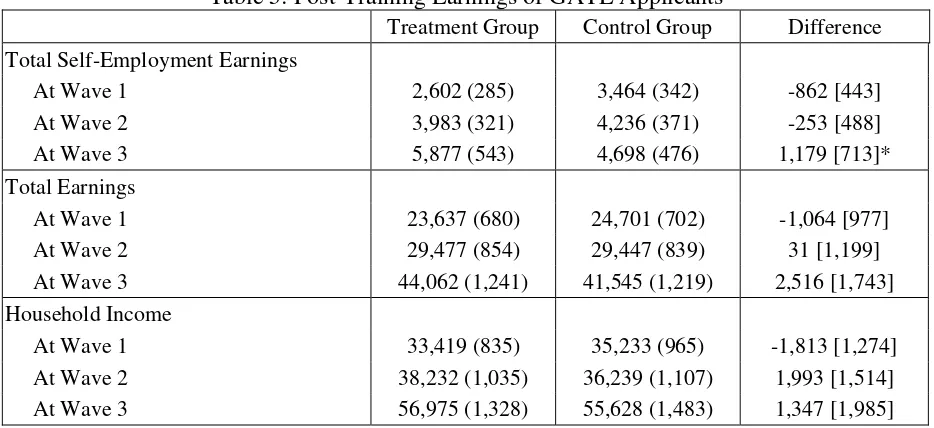
In addition to the above outcomes, participants were also asked to provide information on their earnings and family income. Table 5 presents the average earnings of treatment and control group participants, as reported in the follow-up surveys. There was no statistically significant difference between treatment and control group participants in the total self-employment earnings at Wave 1 and Wave 2, but at Wave 3, treatment group participants had $1,179 higher self-employment earnings than their peers. The remaining earnings variables – total earnings (self-employment earnings plus labor earnings) and household income – were statistically equal between treatment and control group participants.
The numbers in Tables 4 and 5 indicate that GATE may have had a significant impact on the post-training outcomes of participants. In the following section, we estimate GATE’s impact on these outcomes using regression models to adjust for differences in participant characteristics between the treatment and the control group that may have occurred by chance. The analysis that
5
follows will eliminate any disparities between the treatment and the control group outcomes that may have occurred as a result of differences in observable characteristics. Our regression analysis will also serve an additional purpose; it will enable us to test if there was a heterogeneous treatment effect, by employment status.
3. Regression-Adjusted Treatment Effects
In this section, we estimate the GATE treatment effect6 on the aforementioned post-training outcomes and test whether there was a heterogeneous impact by employment status at the time of application. We do this by using the following regression model:
i i i
i i
i i
i i
i T X T UNEMP T SELF T LFNO e
Y =α⋅ + ⋅β +γ1⋅ ⋅ +γ2⋅ ⋅ +γ3⋅ ⋅ +
The dependent variable in the above model is the post-training outcome for participant i (Yi),
while Ti is a dummy indicating if participant i was in the treatment group. To adjust for
differences in observed characteristics between the treatment and the control group, the regression model includes all available demographics, self-employment experience, and personal
finance characteristics of participant i (Xi), as shown in Tables 2 and 3. UNEMPi is a dummy
indicating if participant i was unemployed, SELFi is a dummy indicating if participant i was
self-employed, and LFNOi is a dummy indicating if participant i was out of the labor force at
the time of application. The parameter of Ti (α) is the baseline treatment effect, while the
coefficients of the three interaction terms (γ1,γ2, and γ3) indicate if GATE had a heterogeneous
impact on participants who were unemployed, self-employed, or not in the labor force at the time
6
of application. The above model is estimated using weighted linear least squares, using weights that adjust for survey non-response between treatment and control group participants.
3.1. GATE Impact on Self-Employment
Table 6 reports the regression results when the dependent variable is the likelihood of starting a new business by the time of each survey. As the first column shows, the baseline treatment effect on the likelihood of starting a new business by Wave 1 is statistically zero, while only the interaction treatment effect for the unemployed is positive and significant. This suggests that GATE only had a significant impact on starting a new business by Wave 1 for participants who were unemployed at the time of application. Similarly, GATE had a significant positive effect on the likelihood of starting a new business by Wave 2 only for unemployed participants; the baseline treatment effect was statistically zero while the interaction effect for the unemployed was positive and significant. The baseline and interaction treatment effects on the likelihood of starting a new business by Wave 3 were statistically insignificant.
Table 7 presents the regression results when the dependent variable is the likelihood of starting a new business by Wave 1 which still operates at the time of each survey. We again find that the treatment interaction effects for the unemployed are significantly positive; .098 at Wave 1, .073 at Wave 2, and .054 at Wave 3. The baseline and the remaining interaction treatment effects were statistically zero, indicating that GATE had no impact on new business sustainability for participants who were employed, self-employed, or out of the labor force at the time of application.
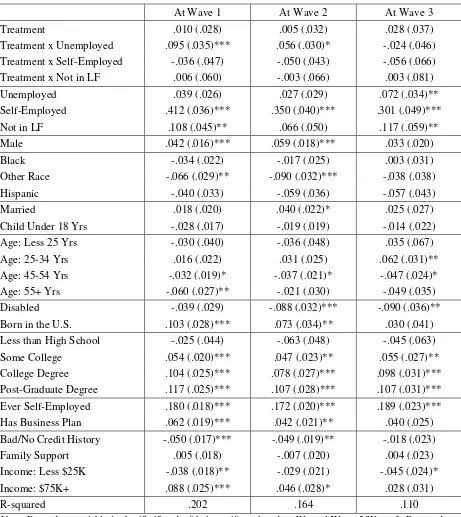
likelihood. As Table 8 shows, GATE had no impact on the self-employment likelihood of employed participants, while the treatment interaction effect for the unemployed was positive and significant at Wave 1 and at Wave 2. Finally, as Table 9 shows, none of the baseline and interaction treatment effects were significant when the dependent variable is the likelihood of employment at the time of each survey.
These analyses show that GATE significantly improved the self-employment outcomes of the unemployed, but had no significant effect on the outcomes of the remaining participants. Using the regression results from Tables 6-9, we construct GATE’s treatment effect on each outcome for the unemployed, by taking the sum of the baseline treatment effect and the treatment interaction effect for the unemployed. Then, to assess the magnitude of the program’s impact on the post-training outcomes of the unemployed, we compare the GATE treatment effect on each outcome with the control group mean for the unemployed.
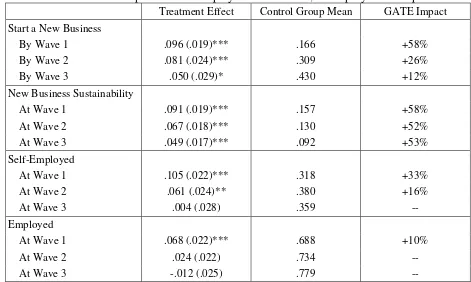
As Table 10 shows, the average GATE treatment effect on the likelihood of starting a new business for the unemployed is 9.6 percentage points and is significant at the 1% level.7 Table 10 also shows that 16.6% of unemployed participants in the control group started a new business by Wave 1. Comparing the treatment effect for the unemployed to their control group mean shows that, by Wave 1, GATE increased new business starts for unemployed participants by 58%. The results reported in Table 10 also show that GATE significantly increased new business starts by Wave 2 (+23%) and by Wave 3 (+11%) for unemployed participants.
GATE also led to significant improvements in new business sustainability among the unemployed. In particular, GATE led to an increase in the likelihood of starting a new business within 6 months of random assignment that was still in operation at Wave 1 by 58%. The
7
positive impact of GATE on new business sustainability was maintained even 18 months (+52%) and 60 months (+53%) after random assignment. So, GATE led to a significant increase in new business starts among the unemployed within 6 months of random assignment, but it also doubled the likelihood of sustaining those businesses long after random assignment.
Partly due to these effects, GATE also significantly affected the likelihood of self-employment among unemployed participants. As Table 10 shows, the unemployed in the treatment group were 33% and 16% more likely than their peers to be self-employed, 6 and 18 months following random assignment. There was no effect, however, on the likelihood of self-employment at Wave 3. Table 10 also shows that GATE increased the likelihood of being employed at Wave 1 by 10% among unemployed participants, but had no impact on employment at Waves 2 and 3. This indicates that GATE had a significant short-term effect in assisting unemployed participants return to employment either through a salary job or through self-employment.
1989; Carr, 1996; Carter, 2000) and by race (e.g., Fairlie and Meyer, 1996; Fairlie, 1999; Fairlie and Robb, 2007).
The parameters of some of the remaining characteristics are also of interest. Participants who had a completed business plan at the time of application were more likely to start a new business by Waves 1 and 2, while they were also more likely to sustain their new business even 60 months after random assignment. Those with self-employment experience were more likely to start a new business than their peers, but were equally likely to sustain that business.8 These results confirm the findings of previous work that individuals with a self-employment background are more likely to be successful in pursuing self-employment. Participants with a bad or no credit history were less likely than their peers to start a new business, start a new business and sustain it, and be self-employed. Moreover, those with low family income had lower self-employment likelihood and were less likely to start and sustain a new business after random assignment. The impact of a poor credit history and low income on self-employment persisted even five years after random assignment. These results are consistent with the conclusion of previous research that access to financing is an important deterrent to self-employment participation and success.
3.2. GATE Impact on Participant Earnings
Using the same specification as above, we estimate GATE’s impact on self-employment earnings, labor earnings, total earnings, and household income. Based on the regression results, which are available upon request, we constructed the average GATE treatment effect for
8
unemployed participants on the earnings outcomes.9 We then compare the GATE treatment effect with the control group means of these outcomes for unemployed participants – results are reported in Table 11.
As Table 11 shows, GATE did not have a statistically significant impact on self-employment earnings for unemployed participants. It is noteworthy, though, that the treatment effect on self-employment earnings increases with each follow-up survey, providing an indication that GATE may lead to improvements in self-employment earnings over time. In fact, our results show that GATE had a significantly positive impact on total earnings (i.e., self-employment earnings plus labor earnings) and on the total household income of unemployed participants at Wave 3 (60 months after random assignment). In particular, GATE led to 10% higher total earnings and to 9% higher household income for unemployed participants at Wave 3. These impacts, which are significant at the 10% level, provide evidence that GATE led to improved earnings in the long-run. Although the mechanism that led to higher overall earnings and household income is unknown, we can speculate that GATE helped the unemployed in the treatment group gain valuable knowledge and skills that they otherwise would not have the opportunity to learn.
5. Conclusion
Supporting self-employment through the public workforce development system has been a major focus of policymakers in the past 20 years. But following the success of early self-employment training programs and the authorization of self-self-employment assistance (SEA) programs by Congress in 1997, only 11 states passed SEA-enabling legislation. As of 2007, only Delaware, Maine, Maryland, New Jersey, New York, Oregon, and Pennsylvania were
9
implementing a SEA program, of which 3 states (New York, New Jersey, and Oregon) served more than 70% of all participants.
In 2002, during a period of slow economic activity, the U.S. Department of Labor and the Small Business Administration created Project GATE, a self-employment training program. The goal of Project GATE, implemented between 2003 and 2005 in Maine, Minnesota, and Pennsylvania, was to provide free self-employment services to individuals interested in starting their own business. Project GATE, which is the most recent large scale self-employment program in the U.S., was specifically designed as an experiment, where participants were randomly selected to receive services. In addition, the program was open to all interested individuals, regardless of their employment status, which was a departure from previous programs that targeted only the unemployed. Project GATE, therefore, provides a unique opportunity to test the effectiveness of self-employment programs and whether they have a heterogeneous impact on participants, by employment status.
GATE led to a 10% increase in total earnings and household income for unemployed participants five years after random assignment.
Table 1: Random Assignment of GATE Applicants
Total Treatment Control
All Applicants 4,198 (100%) 2,095 (50%) 2,093 (50%) Wave 1 Respondents
[response rate]
3,449 (100%) [82%]
1,758 (51%) [84%]
1,691 (49%) [81%] Wave 2 Respondents
[response rate]
[cumulative response rate]
3,038 (100%) [88%] [72%]
1,563 (51%) [89%] [75%]
1,475 (49%) [87%] [70%] Wave 3 Respondents
[response rate]
[cumulative response rate]
2,450 (100%) [81%] [58%]
1,274 (52%) [82%] [61%]
1,176 (48%) [80%] [56%]
Table 2: Baseline Characteristics of GATE Applicants
All Applicants
Wave 1 Respondents
Wave 2 Respondents
Wave 3 Respondents
Total 4,198 3,449 3,038 2,450 Treatment Group 2,095 (50%) 1,758 (51%) 1,563 (51%) 1,274 (52%)
Site: Minneapolis/St. Paul 1,654 (39%) 1,383 (40%) 1,257 (41%) 1,053 (43%) Site: Philadelphia 1,179 (28%) 904 (26%) 746 (25%) 553 (23%) Site: Pittsburgh 595 (14%) 482 (14%) 428 (14%) 254 (14%) Site: Maine 567 (14%) 513 (15%) 459 (15%) 368 (15%) Site: Rural Minnesota 203 (5%) 167 (5%) 148 (5%) 121 (5%) Male 2,247 (54%) 1,813 (53%) 1,584 (52%) 1,283 (52%) Race: White 2,403 (58%) 2,067 (60%) 1,887 (62%) 1,595 (65%) Race: Black 1,318 (31%) 1,035 (30%) 867 (29%) 640 (26%) Race: Other 477 (11%) 347 (10%) 284 (9%) 215 (9%)
Hispanic 207 (5%) 169 (5%) 155 (5%) 125 (5%) Married 1,836 (44%) 1,538 (45%) 1,377 (45%) 1,137 (46%) Child Under 18 1,944 (46%) 1,556 (45%) 1,364 (45%) 1,364 (45%) Age: Less 25 Yrs 183 (4%) 133 (4%) 105 (3%) 69 (3%) Age: 25-34 Yrs 882 (21%) 674 (20%) 563 (19%) 427 (17%) Age: 35-44 Yrs 1,365 (33%) 1,092 (32%) 958 (32%) 754 (31%) Age: 45-54 Yrs 1,303 (31%) 1,138 (33%) 1,033 (34%) 878 (36%) Age: 55+ Yrs 465 (11%) 412 (12%) 379 (12%) 322 (13%) Less than High School 151 (4%) 102 (3%) 88 (3%) 58 (2%) High School Diploma 935 (22%) 727 (21%) 622 (21%) 471 (19%) Associate Degree/Some College 1,557 (37%) 1,271 (37%) 1,094 (36%) 853 (35%) College Degree 764 (18%) 670 (19%) 614 (20%) 532 (22%) Post-Graduate Degree 791 (19%) 679 (20%) 620 (20%) 536 (22%) Born in US 3,775 (90%) 3,137 (91%) 2,781 (92%) 2,265 (92%) Disabled 354 (8%) 306 (9%) 271 (9%) 210 (9%)
Table 3: Employment Characteristics and Personal Finances of GATE Applicants
All Applicants Wave 1 Respondents
Wave 2 Respondents
Wave 3 Respondents
Total 4,198 3,449 3,038 2,450
Unemployed 2,089 (50%) 1,737 (50%) 1,539 (51%) 1,261 (51%) Salary Employment 1,185 (28%) 937 (27%) 817 (27%) 635 (26%) Self-Employed 548 (13%) 470 (14%) 419 (14%) 349 (14%) Not in the Labor Force 376 (9%) 305 (9%) 263 (9%) 200 (8%) Ever Self-Employed 1,547 (37%) 1,310 (38%) 1,176 (39%) 965 (39%) Business Plan 949 (23%) 767 (22%) 664 (22%) 521 (21%) Bad/No Credit History 1,874 (45%) 1,491 (43%) 1,265 (42%) 958 (39%) Family Support 1,893 (45%) 1,561 (45%) 1,387 (46%) 1,124 (46%) Income: $25K or Less 1,483 (35%) 1,176 (34%) 1,008 (33%) 767 (31%) Income: $25K-$75K 2,145 (51%) 1,782 (52%) 1,575 (52%) 1,277 (52%) Income: > $75K 570 (14%) 491 (14%) 455 (15%) 406 (17%)
Table 4: Post-Training Employment Outcomes of GATE Applicants
Treatment Group Control Group Difference Started New Business
By Wave 1 .208 (.010) .155 (.009) .053 [.013]*** By Wave 2 .332 (.012) .281 (.012) .051 [.017]** By Wave 3 .455 (.014) .416 (.014) .039 [.020]* Started New Business by Wave 1
Still Operates at Wave 1 .200 (.010) .148 (.009) .052 [.013]*** Still Operates at Wave 2 .161 (.009) .119 (.008) .043 [.013]*** Still Operates at Wave 3 .125 (.009) .084 (.008) .041 [.012]*** Self-Employed
At Wave 1 .404 (.012) .359 (.012) .045 [.017]*** At Wave 2 .429 (.013) .409 (.013) .020 [.018] At Wave 3 .389 (.014) .378 (.014) .011 [.020] Employed At Wave 1 .751 (.010) .724 (.011) .026 [.015]* At Wave 2 .754 (.011) .742 (.011) .011 [.016] At Wave 3 .783 (.012) .797 (.012) .013 [.016]
Table 5: Post-Training Earnings of GATE Applicants
Treatment Group Control Group Difference Total Self-Employment Earnings
At Wave 1 2,602 (285) 3,464 (342) -862 [443] At Wave 2 3,983 (321) 4,236 (371) -253 [488] At Wave 3 5,877 (543) 4,698 (476) 1,179 [713]* Total Earnings
At Wave 1 23,637 (680) 24,701 (702) -1,064 [977] At Wave 2 29,477 (854) 29,447 (839) 31 [1,199] At Wave 3 44,062 (1,241) 41,545 (1,219) 2,516 [1,743] Household Income
At Wave 1 33,419 (835) 35,233 (965) -1,813 [1,274] At Wave 2 38,232 (1,035) 36,239 (1,107) 1,993 [1,514] At Wave 3 56,975 (1,328) 55,628 (1,483) 1,347 [1,985]
Table 6: Regression Results, Likelihood of Starting a New Business
By Wave 1 By Wave 2 By Wave 3 Treatment -.009 (.021) .014 (.030) -.004 (.040) Treatment x Unemployed .105 (.029)*** .067 (.039)* .054 (.049) Treatment x Self-Employed .059 (.041) .075 (.056) .050 (.070) Treatment x Not in LF .044 (.050) -.016 (.065) .033 (.084) Unemployed .060 (.020)*** .062 (.028)** .060 (.036)* Self-Employed -.016 (.030) -.010 (.040) .033 (.053) Not in LF .074 (.037)** .116 (.050)** .116 (.062)* Male .026 (.013)** .020 (.018) -.007 (.022) Black -.049 (.018)*** -.012 (.024) -.005 (.032) Other Race -.075 (.023)*** -.078 (.032)** -.023 (.041) Hispanic -.017 (.030) -.044 (.037) -.044 (.047) Married -.002 (.017) .020 (.022) .044 (.027) Child Under 18 Yrs -.031 (.014)** -.009 (.019) .015 (.023) Age: Less 25 Yrs -.005 (.033) .034 (.049) .071 (.068) Age: 25-34 Yrs .007 (.019) .039 (.025) .140 (.032)*** Age: 45-54 Yrs -.025 (.017) -.028 (.021) -.041 (.026) Age: 55+ Yrs -.075 (.022)*** -.050 (.029)* -.059 (.036)* Disabled .005 (.024) -.001 (.031) .003 (.039) Born in the U.S. .018 (.024) -.003 (.034) -.005 (.043) Less than High School -.020 (.034) -.064 (.045) -.064 (.067) Some College .041 (.017)** .046 (.023)** .071 (.029)** College Degree .016 (.021) .019 (.027) .023 (.033) Post-Graduate Degree .054 (.021)** .065 (.027)** .056 (.033)* Ever Self-Employed .041 (.015)** .042 (.020)** .075 (.024)*** Has Business Plan .052 (.016)*** .056 (.021)*** .030 (.026) Bad/No Credit History -.032 (.014)** -.054 (.019)*** -.034 (.026) Family Support .006 (.015) .011 (.020) .005 (.024) Income: Less $25K -.061 (.014)*** -.060 (.020)*** -.064 (.026)** Income: $75K+ .077 (.024)*** .073 (.028)** .102 (.032)***
R-squared .069 .059 .063
Table 7: Regression Results, Started New Business by Wave 1, Still in Operation
Started New Business by Wave 1, Still Operates At Wave 1 At Wave 2 At Wave 3 Treatment -.004 (.021) -.004 (.019) -.007 (.020) Treatment x Unemployed .098 (.028)*** .071 (.026)*** .056 (.026)** Treatment x Self-Employed .059 (.041) .056 (.041) .053 (.039) Treatment x Not in LF .028 (.049) .030 (.049) .018 (.049) Unemployed .014 (.020) .020 (.019) .012 (.019) Self-Employed -.008 (.029) .015 (.029) .005 (.026) Not in LF .079 (.037)** .063 (.036)* .065 (.038)* Male .027 (.013)** .016 (.012) .019 (.012) Black -.049 (.017)*** -.033 (.016)** -.024 (.015) Other Race -.075 (.022)*** -.093 (.020)*** -.088 (.017)*** Hispanic -.021 (.029) -.009 (.027) -.036 (.024) Married -.005 (.016) .006 (.016) -.019 (.016) Child Under 18 Yrs -.034 (.014)** -.030 (.013)** -.029 (.013)** Age: Less 25 Yrs -.017 (.031) -.046 (.025)* -.003 (.032) Age: 25-34 Yrs .004 (.018) .010 (.018) 0.024 (.019) Age: 45-54 Yrs -.016 (.016) -.003 (.016) -.008 (.015) Age: 55+ Yrs -.066 (.022)*** -.050 (.021)** -.047 (.020)** Disabled .008 (.023) -.015 (.022) -.042 (.018)** Born in the U.S. .007 (.024) .010 (.023) .000 (.020) Less than High School -.013 (.034) .018 (.035) .001 (.032) Some College .035 (.017)** .018 (.016) .025 (.015) College Degree .010 (.021) .019 (.020) .018 (.019) Post-Graduate Degree .051 (.021)** .053 (.021)** .044 (.019)** Ever Self-Employed .003 (.015) .001 (.014) .003 (.013) Has Business Plan .046 (.016)*** .038 (.015)** .036 (.015)** Bad/No Credit History -.035 (.014)** -.046 (.014)*** -.027 (.013)** Family Support .012 (.015) .003 (.014) .012 (.014) Income: Less $25K -.053 (.014)*** -.034 (.014)** -.043 (.014)*** Income: $75K+ .073 (.024)*** .055 (.023)** .023 (.021)
R-squared .066 .063 .054
Table 8: Regression Results, Self-Employment Likelihood
At Wave 1 At Wave 2 At Wave 3 Treatment .010 (.028) .005 (.032) .028 (.037) Treatment x Unemployed .095 (.035)*** .056 (.030)* -.024 (.046) Treatment x Self-Employed -.036 (.047) -.050 (.043) -.056 (.066) Treatment x Not in LF .006 (.060) -.003 (.066) .003 (.081) Unemployed .039 (.026) .027 (.029) .072 (.034)** Self-Employed .412 (.036)*** .350 (.040)*** .301 (.049)*** Not in LF .108 (.045)** .066 (.050) .117 (.059)** Male .042 (.016)*** .059 (.018)*** .033 (.020) Black -.034 (.022) -.017 (.025) .003 (.031) Other Race -.066 (.029)** -.090 (.032)*** -.038 (.038) Hispanic -.040 (.033) -.059 (.036) -.057 (.043) Married .018 (.020) .040 (.022)* .025 (.027) Child Under 18 Yrs -.028 (.017) -.019 (.019) -.014 (.022) Age: Less 25 Yrs -.030 (.040) -.036 (.048) .035 (.067) Age: 25-34 Yrs .016 (.022) .031 (.025) .062 (.031)** Age: 45-54 Yrs -.032 (.019)* -.037 (.021)* -.047 (.024)* Age: 55+ Yrs -.060 (.027)** -.021 (.030) -.049 (.035) Disabled -.039 (.029) -.088 (.032)*** -.090 (.036)** Born in the U.S. .103 (.028)*** .073 (.034)** .030 (.041) Less than High School -.025 (.044) -.063 (.048) -.045 (.063) Some College .054 (.020)*** .047 (.023)** .055 (.027)** College Degree .104 (.025)*** .078 (.027)*** .098 (.031)*** Post-Graduate Degree .117 (.025)*** .107 (.028)*** .107 (.031)*** Ever Self-Employed .180 (.018)*** .172 (.020)*** .189 (.023)*** Has Business Plan .062 (.019)*** .042 (.021)** .040 (.025) Bad/No Credit History -.050 (.017)*** -.049 (.019)** -.018 (.023) Family Support .005 (.018) -.007 (.020) .004 (.023) Income: Less $25K -.038 (.018)** -.029 (.021) -.045 (.024)* Income: $75K+ .088 (.025)*** .046 (.028)* .028 (.031)
R-squared .202 .164 .110
Table 9: Regression Results, Employment Likelihood
At Wave 1 At Wave 2 At Wave 3 Treatment .022 (.028) .037 (.030) -.007 (.030) Treatment x Unemployed .046 (.035) -.013 (.038) -.005 (.040) Treatment x Self-Employed -.060 (.043) -.076 (.055) -.006 (.054) Treatment x Not in LF -.066 (.064) -.068 (.070) -.095 (.077) Unemployed -.103 (.026)*** -.013 (.028) -.024 (.029) Self-Employed .035 (.015)** .020 (.033) -.015 (.038) Not in LF -.185 (.048)*** -.068 (.070) -.069 (.054) Male .035 (.015)** -.013 (.028) -.035 (.018)* Black .009 (.023) .057 (.024)** -.048 (.028)* Other Race .056 (.029)* -.052 (.033) -.083 (.034)** Hispanic .000 (.035) .001 (.038) -.077 (.040)* Married -.003 (.019) .014 (.021) .027 (.022) Child Under 18 Yrs -.013 (.017) -.016 (.018) .038 (.020)* Age: Less 25 Yrs .031 (.038) .041 (.043) .015 (.062) Age: 25-34 Yrs .033 (.021) .053 (.023)** .068 (.026)*** Age: 45-54 Yrs -.036 (.019)* -.008 (.020) -.038 (.022)* Age: 55+ Yrs -.080 (.027)*** -.044 (.029) -.121 (.031)*** Disabled -.153 (.030)*** -.160 (.033)*** -.192 (.039)*** Born in the U.S. .091 (.030)*** .051 (.034) -.020 (.034) Less than High School -.004 (.048) -.026 (.052) .092 (.058) Some College .016 (.021) .033 (.022) .030 (.027) College Degree .010 (.024) -.032 (.026) .077 (.028)*** Post-Graduate Degree .009 (.025) -.032 (.027) .095 (.028)*** Ever Self-Employed .082 (.017)*** .057 (.018)*** .087 (.019)*** Has Business Plan .046 (.017)*** .021 (.019) -.008 (.022) Bad/No Credit History .013 (.017) .006 (.018) -.032 9.020) Family Support .008 (.017) .031 (.018)* -.026 (.020) Income: Less $25K .016 (.019) .009 (.019) -.097 (.022)*** Income: $75K+ -.035 (.024) -.056 (.026)** .005 (.023)
R-squared .077 .065 .107
Table 10: GATE Impact on Self-Employment Outcomes, Unemployed Participants
Treatment Effect Control Group Mean GATE Impact Start a New Business
By Wave 1 .096 (.019)*** .166 +58% By Wave 2 .081 (.024)*** .309 +26% By Wave 3 .050 (.029)* .430 +12% New Business Sustainability
At Wave 1 .091 (.019)*** .157 +58% At Wave 2 .067 (.018)*** .130 +52% At Wave 3 .049 (.017)*** .092 +53% Self-Employed
At Wave 1 .105 (.022)*** .318 +33% At Wave 2 .061 (.024)** .380 +16% At Wave 3 .004 (.028) .359 -- Employed
At Wave 1 .068 (.022)*** .688 +10% At Wave 2 .024 (.022) .734 -- At Wave 3 -.012 (.025) .779 --
Table 11: GATE Impact on Earnings, Unemployed Participants
Treatment Effect Control Group Mean GATE Impact (%)
Self-Employment Earnings
At Wave 1 172 (512) 2,488 (11,246) -- At Wave 2 310 (681) 3,699 (13,739) -- At Wave 3 1,556 (1,030) 4,606 (16,679) --
Total Earnings
At Wave 1 -359 (1,412) 23,293 (29,621) -- At Wave 2 1,226 (1,720) 30,288 (34,290) -- At Wave 3 4,340 (2,435)* 43,403 (43,983) +10%
Household Income
At Wave 1 -757 (1,617) 33,155 (41,448) -- At Wave 2 3,377 (2,110) 35,941 (44,567) -- At Wave 3 5,019 (2,939)* 56,473 (52,689) +9%
References
Acs Z.J. (1999). Are Small Firms Important? Their Role and Impact. Kluwer Academic Publishers, Boston, MA.
Bates T. (1997). Race, Self-Employment, and Upward Mobility: An Illusive American Dream. Woodrow Wilson Center Press, Washington DC; Johns Hopkins University Press, Baltimore, MD.
Benus J., McConnell S., Bellotti J., Shen T., Fortson K., Kahvecioglu D. (2008). Growing America Through Entrepreneurship: Findings from the Evaluation of Project GATE. U.S. Department of Labor, Washington DC, May 2008.
Benus J., Shen T., Zhang S., Chan M., Hansen B. (2009). Growing America Through Entrepreneurship: Final Evaluation of Project GATE. U.S. Department of Labor, Washington DC, December 2009.
Benus, J., Johnson T., Wood M,, Grover N., and Shen T. (1995). Self-Employment Programs: A New Reemployment Strategy: Final Report on the UI Self-Employment Demonstration. Unemployment Insurance Occasional Paper no. 95-4. U.S. Department of Labor, Washington DC, 1995.
Blanchflower D.G., Levine P.B., Zimmerman D.J. (2003). Discrimination in the Small Business Credit Market. Review of Economics and Statistics, 85: 930-943.
Boden R.J. (1999). Flexible Working Hours, Family Responsibilities, and Female Self-Employment: Gender Differences in Self-Employment Selection. American Journal of Economics and Sociology, 58: pp. 71-83.
Bregger J.E. (1996). Measuring Self-Employment in the United States. Monthly Labor Review, 119: 3-9.
Bucks B.K., Kennickell A.B., Moore K.B (2006). Recent Changes in U.S. Family Finances: Evidence from the 2001 and 2004 Survey of Consumer Finances. Federal Reserve Bulletin, 92: 1-38.
Carr D. (1996). Two Paths to Self-Employment? Women's and Men's Self-Employment in the United States, 1980. Work and Occupations, 23: 26-53.
Cavalluzzo K., Wolken J. (2005). Small Business Loan Turndowns, Personal Wealth, and Discrimination. Journal of Business, 78: 2153-2177.
Davis S.J., Haltiwanger J., Jarmin R. (2008). Turmoil and Growth: Young Businesses, Economic Churning, and Productivity Gains. Ewing Marion Kauffman Foundation Report, June 2008. Dennis W.J. (1999). Business Starts and Stops. National Federation of Independent Business
Paper Series, November 1999.
Dunn T., Holtz-Eakin D. (2000). Financial Capital, Human Capital, and the Transition to Self-Employment: Evidence from Intergenerational Links. Journal of Labor Economics, 18: 282-305.
Fairlie R.W. (1999). The Absence of the African-American Owned Business: An Analysis of the Dynamic of Self-Employment. Journal of Labor Economics, 17: 80-108.
Fairlie R.W., Meyer B.D. (1996). Ethnic and Racial Self-Employment Differences and Possible Explanations. Journal of Human Resources, 31: 757-793.
Fairlie R.W., Robb A.M. (2007). Why are Black-Owned Businesses Less Successful than White-Owned Businesses? The Role of Families, Inheritances, and Business Human Capital. Journal of Labor Economics, 25: 289-323.
Glocker D., Steiner V. (2007). Self-Employment: A Way to End Unemployment? Empirical Evidence from German Pseudo-Panel Data. IZA Discussion Paper No. 2561.
Hout M., Rosen H.S. (2000). Self-Employment, Family Background, and Race. Journal of Human Resources, 35: 670-692.
Kosanovich W.T., Fleck H., Yost B., Armon W., Siliezar S. (2002). Comprehensive Assesment of Self-Employment Assistance Programs. Employment and Training Administration Occasional Paper 2002-01. U.S. Department of Labor, Washington DC 2002.
Kwansa, F.A. (1998). Black-American Entrepreneurship: The Case of the Foodservice Industry. Marriage and Household Review, 18: 43-53.
Lowrey Y. (2009). Startup Business Characteristics and Dynamics: A Data Analysis of the Kauffman Firm Survey. SBA Working Paper, August 2009.
Meager N. (1992). Does Unemployment Lead to Self-Employment? Small Business Economics, 4: 87-103.
Reynolds P.D., White S.B. (1997). The Entrepreneurial Process. Greenwood Publishing, Westport, CT.
Rissman E.R. (2003). Self-Employment as an Alternative to Unemployment. Federal Reserve Bank of Chicago, Working Paper 2003-34.
Vroman, W. (1997). Self-Employment Assistance: Revised Report. Report to Congress, Washington DC, 1997.