Lancaster University Management School
Working Paper
2003/086
Curriculum
Geraint Johnes
The Department of Economics Lancaster University Management School
Lancaster LA1 4YX UK
©Geraint Johnes
All rights reserved. Short sections of text, not to exceed two paragraphs, may be quoted without explicit permission,
provided that full acknowledgement is given.
The LUMS Working Papers series can be accessed at http://www.lums.co.uk/publications
CURRICULUM
Geraint Johnes
Department of Economics The Management School
Lancaster University Lancaster LA1 4YX
United Kingdom
Voice: +44 1524 594215 Fax: +44 1524 594244 E-mail:[email protected]
First version November 2001 Latest version November 2003
ABSTRACT
Regression and neural network models of wage determination are constructed where the explanatory variables include detailed information about the impact of school curricula on future earnings. It is established that there are strong nonlinearities and interaction effects present in the relationship between curriculum and earnings. The results have important implications in the context of the human capital versus signalling and screening debate. They also throw light on contemporary policy issues concerning the desirability of breadth versus depth in the school curriculum.
JEL Classification: I21, J24, J31, C45
Keywords: curriculum, earnings, neural networks
Introduction
Since the seminal work of Schultz (1961), Becker (1964) and Mincer (1974), the human
capital model has dominated economic discussions about education. The signalling model,
developed by Spence (1974), and the screening model of Arrow (1973) have provided the
human capital model with competitors which are theoretically plausible.1 But the weight of
empirical evidence supports the view that schooling does result in learning which in turn
raises worker productivity and earnings. For instance, Wolpin (1977), Cohn et al. (1987), and
Johnes (1998) all find no evidence that self-employed workers (who have no need to use
education as a sorting mechanism) have lower returns to educational investments than do
other workers.2 And Grubb (1993), Cohn et al. (1987) and Johnes (1998) find that the returns
to education are as strong amongst older workers as they are amongst younger workers,
despite the fact that employers presumably have learned something about the productivity of
those employees who have long tenure.
One piece of evidence exists that points in the other direction. The work of Altonji (1995)
suggests that, while years of schooling are rewarded by higher earnings in the labour market,
the number and nature of courses taken while at school is not. This would seem to indicate
that employers use years of schooling as a signal or screen, and that productivity and wages
do not depend on the instructional content of those years.
This work is partially reinforced by other studies, notably Levine and Zimmerman (1995),
Vignoles (1999) and Dolton and Vignoles (2002a,b), which have found – both in the United
1 In a broader context, signalling is an important phenomenon wherever there are asymmetries in information. It
is therefore often associated with principal-agent models. Recent surveys of this literature include Riley (2001). The present paper is linked to this literature inasmuch as it provides an empirical test of signalling as a response to asymmetric information in one particular context - that of the labour market.
2 As Hanushek (1986) notes, the test used in these papers may be unreliable in the presence of sample selection
States and the United Kingdom – that mathematics is the only secondary school subject which
subsequently makes a significantly positive contribution to earnings. If these arguments are
accepted, then any curriculum which does not include mathematics does not contribute to
increased productivity – though the evidence of numerous studies demonstrates that the extra
period of schooling does lead to increased earnings, presumably through sorting effects.3
These results, contradictory as they are, warrant closer inspection. In the present paper, I use
data from the UK to examine the impact which post-compulsory curriculum has on earnings.
The method used here represents an advance on earlier studies because I use new, nonlinear
methods of estimation which take full account of the synergies which might exist between the
subjects that a student reads within the school curriculum. To anticipate the results, I shall
demonstrate that synergy does matter in the context of curriculum, and that mathematics is not
the only subject which impacts upon earnings. Both these results are sympathetic to the
human capital model.4
The United Kingdom provides a particularly instructive laboratory for examining the effects
of curriculum, since a system of national examinations well suited to this type of analysis is in
place. These are taken at age 16 (the General Certificate of Secondary Education, or formerly
the Ordinary – ‘O’ – level) and at age 18 (the Advanced – ‘A’ – level).5 The former cover a
3 There is also a sociological literature concerning curriculum and school performance, typified by the
contributions of Adelman (1999) and Alexander and Pallas (1984). But this does not focus on labour market outcomes.
4 This supposes that it is legitimate to follow Altonji (1995) in assuming that employers perceive years of
education attained but not details of the curriculum undertaken between the ages of 16 and 18. In a highly co-ordinated educational system such as Britain's, however, curriculum itself might be treated as a signal by employers. But, having researched the NCDS data, Dolton and Vignoles (2002a) conclude that 'it is the specific skills and knowledge provided … that attracts a wage premium'. In other words, they find against the argument that curriculum serves as a signal. I concur. For more on the relationship between job market signalling and curriculum, see Altonji (1995) and Dolton and Vignoles (2002a).
5 Before the creation of the GCSE examinations in 1988, pupils took subject-specific O level examinations or the
broad range of subjects, but from age 16 onwards, British pupils choose a relatively
specialised curriculum. Until the year 2000 cohort of entrants to post-compulsory education,
students in the 16-18 year age group have typically taken 3 A level examinations; in other
words, from age 16 to age 18, they study just three subject areas.6 The returns to curricula of
many different types can therefore be estimated by looking at the experience of a variety of
students who choose different subject mixes. In particular, it is possible to investigate the
extent to which benefits accrue to students pursuing a narrow curriculum – for instance, 3 arts
subjects or 3 science subjects – vis-à-vis those which attach to a broader curriculum in which
arts and science subjects are mixed.
It is important to note that all the examinations referred to above are national qualifications,
designed to evaluate pupils' performance in a range of subjects each of which is taught
according to a national curriculum. The examinations are administered by a small number of
examination boards that operate at national level - pupils do not therefore sit examinations
that are set or graded by their own teachers. The examinations are widely regarded,
internationally, as providing a reliable measure of pupil performance.7
The analysis of curriculum effects is of particular interest in the context of changes which are
currently under way in the British system of post-compulsory secondary education. Since
2000, those studying at this level have been able to take some combination of Advanced
Subsidiary (AS) and A2 level qualifications. The former entail one year of study, while the
achievement level of grade 1 were deemed to have demonstrated achievement equivalent to a pass at O level. Where I refer to O level passes in the sequel, I therefore take this to include CSE grade 1 passes.
6 The move toward modular courses and the Curriculum 2000 reforms mean that the A levels taken by my
sample (for the most part, in 1976) differ from those that students take now. But the insights that the analysis affords into the role played by curriculum in the accumulation of human capital are nonetheless likely to be generally valid.
7 Further information on the structure of examinations in the British system is provided by Dolton and Vignoles
latter are comparable to the A levels which have existed heretofore. The intention of the new
scheme is that students might take a mix of courses which provide depth (an A2 qualification)
in one or two subjects, but breadth (a larger number of AS qualifications) elsewhere. The
increased breadth which this new system will encourage is widely regarded as a move in the
right direction because comparisons with other countries indicate that British students have
specialised early. Whether the changes are truly likely to prove beneficial is, of course, an
empirical issue, however. Vignoles (1999), using similar data but different methods to those
used here, has argued that more breadth is not what the labour market appears to want. A
byproduct of the results reported in the present paper is to provide useful additional input into
this debate.
In the remainder of this paper, I propose a method whereby the effects of curriculum on
labour market returns can be evaluated. A novel feature of this analysis is that it uses a neural
network approach to allow for nonlinearities and interaction effects. The next section
describes the method, the following section describes the data, and this is followed by a
presentation of the results. The paper ends with conclusions and suggestions for future
research.
Method
Begin by postulating an extremely simple model of wage determination, where
ln w = Zβ + f(x) + u (1)
Here w represents the wage paid to an individual, Z is a vector of individual characteristics, x
been obtained by the individual, and u is an error.8 The simplest model to consider would be
one in which f is a linear function, and I report estimates of such a model in the sequel.
In general, such an approach would be unnecessarily restrictive, however. Standard linear
models suppose that each subject affects the wage in a manner which is independent of the
other subjects studied. It would be entirely plausible to suggest that the manner in which
subjects combine together is also important in determining a worker’s subsequent labour
market productivity and wage. For instance, the breadth afforded by a curriculum which
contains Mathematics, Social Science and History might render such a curriculum worth
more than the sum of its parts. Indeed, this notion is implicit in much recent government
policy in the United Kingdom, particularly the Curriculum 2000 reforms. In order to capture
the nonlinearity and synergy which is implied by the above argument, I adopt a neural
network modelling approach in which
f(x) = 1/{1+exp{-
∑
m ρi / [1+exp(- θij xj)]}} (2)i
∑
n
j
where m is the number of neurodes in the (single) hidden layer and n is the number of
different qualifications which it is possible to gain.9
8 I do not explore interactions between the x and Z vectors. This is, of course, a feature of the present analysis
that is common to all earlier, linear, studies of the effect of curriculum on subsequent earnings. While it would be possible to include the Z in the neural network, this would make the results of the analysis extremely difficult to interpret, and it is for this reason that that option has been eschewed here.
9 In one respect, it could be claimed that the neural network specification is a highly restrictive functional form,
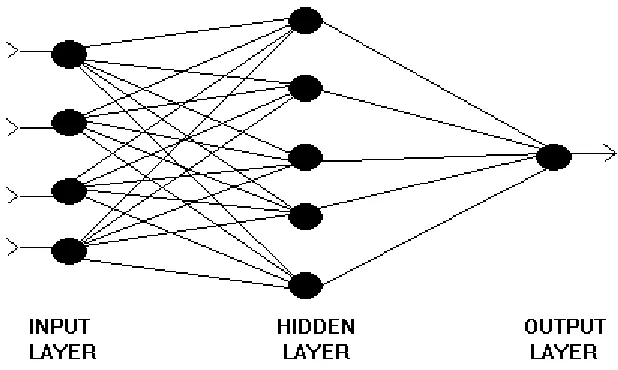
It is instructive to think of this neural network by reference to Figure 1, where I consider the
case of a single hidden layer feedforward network with (n=) 4 inputs, a single output and (m=)
5 nodes in the hidden layer. Signals pass from neurode to neurode within the network. In the
present case, these signals flow unidirectionally - that is, they enter the system as inputs, pass
through successive layers of neurodes, and then exit as outputs. There are no feedback loops.
The network comprises three layers of neurodes: the input and output layers, and one hidden
layer. When a neurode in the hidden or output layer receives signals from neurodes in the
preceeding layer, it constructs a (linear) weighted average of those signals, and then 'squashes'
this weighted average by putting it through a nonlinear transformation. The logistic
transformation employed in equation (2) is typical. Intuitively, the end result is that output is a
melange of nonlinear transformations of the input signals. Indeed, this melange is so rich that
the neural network can serve as an approximator to any linear or nonlinear process. Put
simply, it is not necessary to know the functional form of the relationship between inputs and
outputs; the neural network can approximate it arbitrarily closely, whatever it is.
The model in equation (2) is thus a single hidden layer feedforward network where a weighted
average of the signals which emerge from the hidden layer is squashed, and where a squasher
is also used to transform inputs into the hidden layer. In both cases the squashing function is
the logistic. It has been shown by White et al. (1989) that such a neural network can
approximate arbitrarily closely any underlying pattern in the data.
Neural networks have come to be extensively used in a variety of contexts within economics
over the past few years. First and foremost, they are used in time series work, and especially
for forecasting. Swanson and White (1997) and Johnes (2000) respectively provide examples
applications of the method are somewhat less common in disciplines related to economics, but
interesting examples include the work of Welch et al. (1998) in which networks are used to
detect fraudulent behaviour in the procurement process for contracts in national defence. An
excellent entry point to the literature on neural networks, which contains many key papers, is
given by White (1992). In the present context, a simple neural network is preferable to a linear
model which includes a full set of interaction terms for a number of reasons: the latter
approach would be purely descriptive and would not throw any light on the nature of the
synergies that are implicit in the technology determining wages; degrees of freedom would be
severely limited for many of the interaction dummies.
An issue which arises in the context of neural network modelling is the problem of
overfitting.10 Since a sufficiently complicated network is capable of approximating any data
set arbitrarily closely, the danger exists that the network might model noise as though it were
signal. While this would result in a good fit to the historical data, it would also mean that the
model is less than optimal in terms of its ability to capture the true nature of the relationship
between dependent and explanatory variables; it would not be a good predictor out of sample.
To guard against overfitting therefore, I choose a particularly parsimonious specification of
the network, and so set m=1.11 Note further that seventeen distinct types of A level
qualification are reported in the data set. Five of these, however, were taken by fewer than 20
respondents in the sample used below. These have been merged into a single variable
representing the ‘number of other A levels taken’. This, together with the 12 remaining A
level subject-specific binary variables leaves n=13 inputs to the nonlinear part of the neural
10 The parsimonious model employed here, however, is considerably less subject to the overfitting critique than
would be a linear model with a full set of curriculum dummies. In fact the latter approach could not be used in the present exercise in any event because of the loss of degrees of freedom that would be entailed.
11 Statistical tests for the irrelevance of hidden neurodes exist, but their development is embryonic and their
network. The full specification of the model is therefore given by substituting (2) into (1) to
yield
ln w = Zβ + 1/{1+exp{-ρ / [1+exp(-
∑
n θj xj)]}} + u (3) jThe parameters of this model are estimated by ‘training’ the neural network. This involves an
iterative process through which a measure of the model error is minimised. A variety of
approaches may be employed; here I simply use the nonlinear least squares command in
Limdep.12
It should be noted at this stage, that the neural network model as applied in this context
performs a function that is in many respects analogous to a model in which the vector of
regressors includes a full set of interaction terms between A level subjects. The latter
approach is clearly not feasible where many of the interaction terms would take zero value for
all observations. This is not a problem with the neural network approach, however, because in
essence the method fits a curve across all possible interactions. It uses the data on 3-tuples13
of subjects that are observed in the sample to provide predictions of the dependent variable for
all possible 3-tuples (whether these are observed in the data or not). This allows an obvious
economy in terms of degrees of freedom, and allows also predictions to be made about
combinations of subjects that are not observed in the data - a feat that would be beyond the
alternative approach of a linear model augmented by a full set of interaction terms.
12 I have retained linear terms in the equation, rather than placing these in a nonlinear framework, for two
reasons. First, the primary interest of this paper is in the role of the A level curriculum and the possibility of synergies and nonlinearities therein. Secondly, maintaining a parsimonious specification of the controls guards against overfitting.
Data
The data are taken from stages 3 through 5, and also from the examinations files, of the
National Child Development Study (NCDS). All children born in the United Kingdom during
the week 3-9 March 1958 comprise the base for the NCDS. Parents of these children were
surveyed in 1958 as the Perinatal Mortality Survey; they were later also surveyed in 1965,
1969 and 1974, these being the first three stages of the NCDS proper. The fourth and fifth
stages of the NCDS took place in 1981 and 1991; since the children born in 1958 were adults
by the time these stages took place, the surveys were completed by them rather than by their
parents. The fifth stage has been extensively used in labour market analyses, including
Harmon and Walker (2000) and Blundell et al. (1997).
The NCDS data are particularly notable in that they include comprehensive information about
the educational qualifications earned by respondents. This includes full details of CSEs, O
levels and A level subjects in which pass grades were obtained. The information about A
levels forms the cornerstone of the analysis which follows. In addition, information on a large
number of control variables is available from the NCDS. These include further information
about the respondent (family background, innate ability, work history, household
composition, health, area of residence), his or her employer (firm size, industry), and other
controls.
In discussions about wage equations, the issue of sample selection bias frequently arises, and
this is especially so when the sample comprises women. The NCDS data are sufficiently rich
to allow correction for sample selection effects following the approach of Heckman (1979).
networks.14 For this reason, and also because the number of females in the NCDS who were
working at the time of the fifth sweep is rather small, the analysis reported in the present
paper focuses exclusively on males.
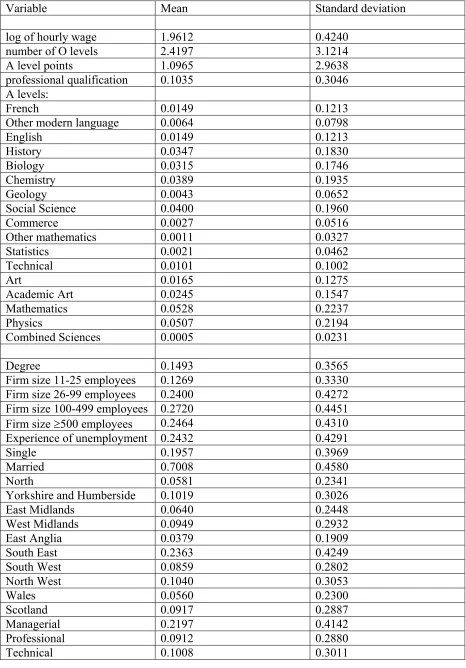
In Table 1, descriptive statistics are reported for variables used in the models that follow.
These are based on the full sample of 1875 men for which complete data are available.15 The
mean hourly wage amounted to a little over £7 per hour (in 1991). On average, respondents
had just over 2 O levels; but one half of the respondents have none at all. Some 18 per cent
proceeded to earn at least one A level qualification, while 15 per cent earned a degree. Of this
sample, 31 per cent are employed in managerial or professional occupations, and a slightly
higher proportion (34 per cent) are employed as craftsmen or operatives. Most of the
remainder are in other manual occupations.16 Just under 44 per cent of the sample are union
members.
14 One possibility would be to follow Curry and Morgan (1997) and estimate a linear approximation to the neural
network. The Heckman (1979) method could then be applied to this in the usual way. In the case of the present exercise, however, taking a Taylor expansion of the network with 17 subjects would involve an unacceptable loss of degrees of freedom. In order to ensure that the analysis for males is not biased due to sample selection effects, a variety of Heckman models have been estimated using the linear specification of the earnings equation with the number of children used as an identifier in the selector equation. The λ term in the outcome equation does not come close to significance, and indeed for most specifications of the selector equation its t statistic lies below 0.05.
15 The NCDS contains about 17000 men and women. But there has been attrition between sweeps, and there is
incomplete information on several of the variables included in the present analysis.
16 This is the excluded group in our regressions, and refers to occupations in the 900 group of the Standard
Results
In the first column of Table 2 I report a simple linear specification of the model (1). This
includes all men in the sample, whether or not they achieved A level qualifications.17 The first
column of this table provides a fairly parsimonious specification of the model in which A
level curriculum and performance appears alongside information about higher education,
health, family composition variables. The results are plausible and generally in line with other
studies. Study of social science and mathematics at A level significantly enhances earnings,
given the overall performance at this level as measured by A level points. Improved
performance at A level, given curriculum, enhances earnings, but the level of significance of
this coefficient is not terribly high; it falls just below 5 per cent on a one-tailed test. These
results are very much in concord with the outcomes of previous studies. The results reported
here suggest that there is a substantial and significant wage premium associated with a degree.
As is often found in empirical studies, marriage enhances earnings for men (see, for example,
Akerlof, 1998), and so does health.
In the second column of Table 2, a simple control is introduced for ability - namely the
number of O levels (or grade 1 CSEs) obtained. This affects the coefficients on the other
education variables; as one might expect, it reduces their impact on earnings and reduces also
their significance. The results suggest that each O level enhances earnings by about 5 per cent,
while a degree adds around 15 per cent to earnings, other things being equal. Binary variables
indicating whether or not an individual achieved an A level pass in each of a number of
subjects appear as regressors, but now none is significant. This calls into question the
specification of models in previous work examines curriculum without adequately controlling
for prior educational performance.
17 This distinguishes the analysis from that of Dolton and Vignoles (2002a) who include in their sample only
Much of the recent literature on education concerns the possible endogeneity of schooling
(Harmon and Walker, 1995). If individuals optimise their behaviour in a human capital model,
then their choice of educational investment will depend on the return that they expect to get
from that investment. Hence education is partly endogenous. The expected return from an
educational investment depends, inter alia, on factors such as innate ability. Endogeneity bias
therefore attaches to the coefficients on education variables if data limitations preclude the
inclusion of ability in the analysis. In the present paper, I tackle the problem using two
methods. First, I instrument for the schooling variables18. The results of this exercise are
shown in column 3 of Table 2.19 The results are broadly similar to those obtained in the
second column, but the coefficients on the O level and degree variables are now slightly
raised, though less significant.
The binary variables indicating subject choice at A level have not been instrumented in
column 3. Despite extensive experimentation, a suitable set of instruments passing the
Hausman (1978) test could not be found. In view of the rich variety of prior educational
attainment data that are available in the NCDS data set, this suggests that endogeneity of
curriculum choice is not a problem in these data.
A number of further variables are added into the model in column 4.20 These show that there
is a firm size effect, such that larger firms pay higher wages. This accords with the literature
on insider power in wage determination, in which workers use the monopoly power which
18 Number of O levels, A level points, and degree are instrumented using measures of prior educational
attainment (reading and maths test scores at ages 7 and 11), secondary school type, and the social class of the main income earning parent.
19 In this column, A level points no longer appears as a regressor owing both to its insignificance in the second
column and difficulty in finding adequate instruments.
their incumbency confers upon them to capture a share of the rents represented by company
profits; an alternative interpretation of this finding is that dynamic monopsony results in firms
facing an upward sloping labour supply schedule (Blanchflower et al., 1990; Green et al.,
1996; Hildreth and Oswald, 1997). Experience of unemployment serves to reduce an
individual’s wage, and membership of a trade union enhances it (though only slightly and
with an imprecisely estimated coefficient).
There are a number of occupation and region effects which are, for the sake of conciseness,
not reported in the table. Amongst manual workers, craftsmen are the best paid, receiving on
average about 7 per cent higher earnings than the ‘other manual’ group. Apart from clerical
workers, wages are higher for those employed in non-manual work than for others. This is
especially so for those employed in managerial, professional and technical occupations, which
are typically remunerated at a rate which is between 17 and 28 per cent higher than the ‘other
manual’ category. Relative to London and the South East, wages are low in every region.
These findings fit in well with casual observation.
Including these extra variables in the equation has an impact on the coefficients of the
education variables. The premium that attaches to the number of O levels obtained is now
estimated at 3 per cent per O level, while the degree premium is around 13 per cent. These
declines are not altogether surprising, since there is collinearity between education and
occupation.
The second method whereby possible biases in the coefficients on the education variables
may be checked is to include as full as possible a set of regressors - including measures of
the approach adopted by Blundell et al. (2000) and is adopted here in column 5 of Table 2.
This brings about a further fall in the coefficients on O levels and on degree, though in the
latter case at least the drop is quite slight.
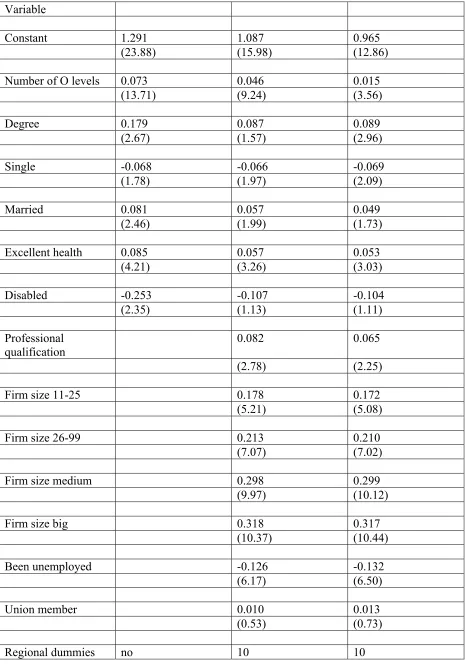
Turn now to consider the neural network estimates. I report the results obtained from three
specifications; in terms of the variables included in the analysis, these correspond to the final
three columns of Table 2. The estimated parameters for the neural network models are
reported in Table 3. It is easily seen that the signs and magnitudes of the coefficients on all the
controls (the variables in Z) are similar to those obtained in the corresponding linear
regressions of Table 2.
The coefficients on the nonlinear terms are not so easy to interpret, though, and as might be
expected in a system of this kind, some of these coefficients are ticklish with respect to
specification of the model. Table 4 is designed to facilitate understanding of some salient
features of the results. It shows the wages predicted by the neural network model reported in
the final column of Table 3,21 for workers who studied a variety of curricula at A level, given
mean values for all the Z variables.
The pattern of predicted wages in Table 4 is complex. For instance, if French and History are
studied at A level, then it makes no difference to the predicted wage whether the third subject
studied is Mathematics or Social Science. If, on the other hand, it is studied in combination
with Physics and Biology, then Social Science has a greater impact on the expected wage than
does Mathematics. This results from the nonlinear and interactive structure of the neural
network; rather than being linear as in a traditional regression approach, the impact on
21 An analogous table, constructed from the results in the first column of Table 3, yields qualitatively similar
predicted wages of a subject is dependent on the other subjects that are studied. Put simply,
there are synergies which are allowed for (though not imposed) in the neural network model.
Some interesting patterns can be observed in the results. A concentrated curriculum in either
the (broadly defined) arts or the sciences may enhance wages - for instance, a curriculum of
Physics, Chemistry and Biology yields a predicted wage of £7.69 per hour, and one of
History, French and Art yields £7.68. On the other hand, there are examples of concentrated
curricula that do not yield high expected returns: English, French and History yields a
predicted wage of £6.59, while Mathematics, Statistics and Physics yields £6.60. Meanwhile
there are many examples of curricula that straddle the boundary between arts and science
subjects which are remunerative (French, History and Chemistry, for instance, gives a
predicted wage of £7.66), but there are other examples where this is not the case (English,
History and Physics offers £6.59). More important than deep or broad, clearly, is the precise
mix of subjects studied. We do not as yet understand why some groups of subjects synergise
more effectively than do others, though this would be an interesting topic for further
research.22
Several of the combinations of subjects listed in Table 4 yield the same predicted wage. This
is an unsurprising outcome of the nonlinear process which determines the wage in this model.
If we think of combinations of subjects in terms of a single variable which is defined along a
continuum from 'unfavourable' to 'favourable', then the relationship between that variable and
earnings is generally positive, but becomes flat at the extremes. The predicted wages obtained,
with mean values of all but the curriculum variables, range from £6.59 per hour to £7.69
22 It is now many years since Hanushek (1986) observed that our understanding of the
depending on the precise mix of subjects studied at A level, and there is bunching at each of
these extremes.
From the above, we would conclude that a curriculum is considerably more than the sum of
its parts. There are synergies between subjects which are quite complex. Moreover, it does not
make sense to talk of the desirability of a broad curriculum or of a deep curriculum
independently of what subjects comprise that curriculum. The method advocated here allows
this problem to be analysed using a specification of the model which is both neat and general.
The linear models of Table 2 and the nonlinear models of Table 3 may be compared using a
standard likelihood ratio test. This provides a test statistics of 3.92, 11.45 and 4.17
respectively for the three columns of Table 3. All of these test statistics 4.10 exceed the
critical value of χ21 = 3.84 at the 5 per cent level. Hence we may conclude that the neural
network models dominate the corresponding linear specifications. Note that this also implies
that the presence in the model of the melange of all A level subjects has a significant effect on
earnings. 23
It was noted earlier that the neural network approach is similar in some respects to a model in
which the regressors include a full set of interaction terms between subjects. In the data used
for the full specification of the model in the final columns of Table 2, some 78 distinct
combinations of (one, two or three) subjects are studied at A level by individuals in the
sample. When a linear specification of the model is run with all these interactions included as
23 As noted by Coelli (1996) this likelihood ratio test is of more value than examination of the t ratios attached to
regressors, 12 of the interaction terms are significant at 5% or better.24 Interestingly, amongst
the combinations of subjects that significantly lower earnings are some that include maths,
while amongst the combinations that significantly increase earnings are some that do not
include maths. Of the 12 significant interaction terms, maths appears as a subject in only 4.
These results confirm the findings of the neural network analysis that suggest that curriculum
effects are widespread, and that the impact of curriculum on earnings is not confined to a
single subject.
Conclusions
The results obtained above cast some doubt on the question of whether a linear specification
for an earnings equation in which qualifications feature as regressors is correct. Such a
specification does not admit the plausible scenario in which some groups of qualifications
combine more effectively than do others to raise respondents’ earnings.
If it is accepted that synergies exist between subjects studied within the curriculum – and the
results obtained in the present paper indeed suggest that it should be – then the argument that
curriculum does not matter must be jettisoned. This is a profound finding, because it has
serious implications for the way in which we view the human capital versus sorting debate.
The only serious evidence which supports sorting as opposed to the human capital model has
come from linear regressions which seem to show that studying subjects while at school does
not raise earnings, though actually being at school does. I have shown above, however, that
the choice of subjects studied does affect earnings. Alongside the evidence in Wolpin (1977),
24 Those that negatively influence earnings are: French, modern languages and social science; French, modern
Cohn et al. (1987), Johnes (1998) and others, this is a telling blow against the empirical
relevance of the sorting model.25
The fact that curriculum in general plays an important part in determining earnings outcomes
of course implies that mathematics is not unusual in making a positive contribution to
earnings. This too is an important finding, not least because it stands in sharp contrast to
results from earlier studies which have used a linear estimation method. We may count
amongst these earlier studies the results reported by Vignoles (1999) and Dolton and Vignoles
(2002a,b) using the same data set as has been employed here. It would appear that the
apparent high return to mathematics in these studies is a chimera due to the imposition of an
excessively simple functional form. Other subjects matter too.
The results have also enabled this paper to make a contribution to the depth versus breadth
debate which is current in British educational research. In common with Dolton and Vignoles
(2002b), I have been unable to find any general pattern which suggests that breadth of
curriculum results in higher remuneration than does. However, my results also suggest that
the breadth versus depth debate is something of a diversion. A broad curriculum is neither a
good nor a bad thing. What matters is the precise mix of subjects that is studied within that
curriculum.
A distinctive feature of the present study is the methodology. While neural networks are not
entirely unfamiliar to economists, their use in cross-section work has been very limited. I
25 It might be argued that employers use information about curriculum as a screen, and this (rather than any
would argue that much is to be gained from more extensive use of this tool of analysis. In the
present context, for instance, the research could usefully be extended to examine the
determination of women’s earnings (given adequate data). Elsewhere in labour economics,
neural networks could be used to examine in more detail nonlinearities which we know or
suspect might exist.26
To conclude, the manner in which the curriculum studied at school affects future earnings is
subtle and complex. Synergies between subjects exist, and it appears that some groups of
subjects combine more productively than do others. The next step in the research process
should be to gain an understanding of why this should be the case. That, however, is one for
the specialists in educational research.
26 For instance, there is a well documented nonlinear effect linking experience to earnings. Indeed, the quartic
Table 1 Descriptive statistics
Variable Mean Standard deviation
log of hourly wage 1.9612 0.4240
number of O levels 2.4197 3.1214
A level points 1.0965 2.9638
professional qualification 0.1035 0.3046
A levels:
French 0.0149 0.1213
Other modern language 0.0064 0.0798
English 0.0149 0.1213 History 0.0347 0.1830 Biology 0.0315 0.1746
Chemistry 0.0389 0.1935
Geology 0.0043 0.0652
Social Science 0.0400 0.1960
Commerce 0.0027 0.0516
Other mathematics 0.0011 0.0327
Statistics 0.0021 0.0462
Technical 0.0101 0.1002
Art 0.0165 0.1275
Academic Art 0.0245 0.1547
Mathematics 0.0528 0.2237
Physics 0.0507 0.2194
Combined Sciences 0.0005 0.0231
Degree 0.1493 0.3565
Firm size 11-25 employees 0.1269 0.3330
Firm size 26-99 employees 0.2400 0.4272
Firm size 100-499 employees 0.2720 0.4451
Firm size ≥500 employees 0.2464 0.4310
Experience of unemployment 0.2432 0.4291
Single 0.1957 0.3969 Married 0.7008 0.4580 North 0.0581 0.2341
Yorkshire and Humberside 0.1019 0.3026
East Midlands 0.0640 0.2448
West Midlands 0.0949 0.2932
East Anglia 0.0379 0.1909
South East 0.2363 0.4249
South West 0.0859 0.2802
North West 0.1040 0.3053
Wales 0.0560 0.2300 Scotland 0.0917 0.2887
Managerial 0.2197 0.4142
Professional 0.0912 0.2880
Clerical 0.0693 0.2541
Craft 0.2064 0.4048
Personal services 0.0656 0.2476
Sales 0.0405 0.1973
Operatives 0.1419 0.3490
Excellent health 0.3701 0.4830
Disabled 0.0085 0.0920
Union member 0.4395 0.4965
Table 2 Regression results
Variable
constant 1.821 1.767 1.681 1.541 1.391 (63.04) (63.07) (49.55) (24.92) (18.98)
number of O levels
0.051 0.073 0.030 0.017
(12.80) (13.42) (7.23) (3.76)
A level points 0.010 0.007
(1.62) (1.26)
A level French -0.024 -0.132 -0.145 -0.067 0.085
(0.29) (1.69) (1.55) (0.84) (1.07)
A level English 0.062 -0.022 0.070 0.080 0.074
(0.77) (0.28) (0.83) (1.10) (1.03)
A level History 0.084 0.016 0.043 0.001 0.011
(1.39) (0.28) (0.66) (0.02) (0.21)
A level Biology 0.076 -0.030 0.053 -0.032 -0.016
(1.21) (0.50) (0.77) (0.53) (0.27)
A level
Chemistry -0.059 -0.094 -0.060 -0.027 -0.036
(0.88) (1.45) (0.82) (0.43) (0.58)
A level Social
Science 0.105 -0.018 0.078 0.029 0.024
(2.01) (0.35) (1.38) (0.61) (0.52)
A level Statistics 0.033 -0.043 0.112 -0.006 0.040
(0.17) (0.23) (0.58) (0.04) (0.24)
A level Technical
0.141 0.015 0.026 -0.127 -0.122
(1.53) (0.17) (0.27) (1.49) (1.43)
A level Art 0.024 -0.063 -0.001 -0.073 -0.076
(0.33) (0.88) (0.01) (1.12) (1.17)
A level Academic Art
0.102 -0.011 0.075 0.038 0.029
(1.54) (0.17) (0.96) (0.57) (0.44)
Mathematics
(1.98) (0.21) (0.77) (0.36) (0.33)
A level Physics 0.039 -0.068 0.021 -0.030 -0.020
(0.65) (1.18) (0.33) (0.55) (0.37)
number of other A levels
0.069 -0.055 -0.016 -0.070 -0.074
(0.86) (0.71) (0.19) (0.96) (1.02)
Degree 0.260 0.151 0.163 0.128 0.104
(8.00) (4.69) (1.78) (3.98) (3.22)
Single -0.066 -0.081 -0.069 -0.078 -0.069
(1.91) (2.44) (1.80) (2.32) (2.07)
Married 0.067 0.057 0.081 0.036 0.047 (2.23) (1.97) (2.44) (1.23) (1.61)
Excellent health 0.103 0.085 0.086 0.050 0.051
(5.47) (4.72) (4.24) (2.78) (2.84)
Disabled -0.329 -0.298 -0.247 -0.117 -0.093 (3.37) (3.19) (2.28) (1.22) (0.97)
Professional
qualification 0.068 0.062
(2.27) (2.07)
Firm size 11-25 0.172 0.171
(4.95) (4.93)
Firm size 26-99 0.209 0.209
(6.82) (6.84)
Firm size medium
0.296 0.297
(9.70) (9.81)
Firm size big 0.314 0.314
(10.06) (10.12)
Been
unemployed
-0.141 -0.131
(6.77) (6.31)
Union member 0.016 0.011
Regional
dummies no no no 10 10
Occupation dummies
no no no 8 8
number of observations
1875 1875 1488 1488 1488
R squared 0.171 0.238 0.232 0.426 0.444
log likelihood -875.61 -796.24 -631.31 -415.67 -391.79
Table 3 Coefficient estimates for the neural networks
Variable
Constant 1.291 1.087 0.965
(23.88) (15.98) (12.86)
Number of O levels 0.073 0.046 0.015
(13.71) (9.24) (3.56)
Degree 0.179 0.087 0.089
(2.67) (1.57) (2.96)
Single -0.068 -0.066 -0.069
(1.78) (1.97) (2.09)
Married 0.081 0.057 0.049
(2.46) (1.99) (1.73)
Excellent health 0.085 0.057 0.053
(4.21) (3.26) (3.03)
Disabled -0.253 -0.107 -0.104
(2.35) (1.13) (1.11)
Professional qualification
0.082 0.065
(2.78) (2.25)
Firm size 11-25 0.178 0.172
(5.21) (5.08)
Firm size 26-99 0.213 0.210
(7.07) (7.02)
Firm size medium 0.298 0.299
(9.97) (10.12)
Firm size big 0.318 0.317
(10.37) (10.44)
Been unemployed -0.126 -0.132
(6.17) (6.50)
Union member 0.010 0.013
(0.53) (0.73)
Occupation dummies no 8 8
ρ -0.902 -0.757 -0.637
(2.60) (2.98) (3.07)
θ associated with A level:
French 27.11 1.020 2.028
(0.00) (0.19) (0.22)
English -1.355 -12.083 -12.317
(0.39) (0.15) (0.09)
History -15.85 -8.564 -7.521
(0.00) (0.11) (0.06)
Biology -8.183 -3.703 11.792
(0.13) (0.44) (0.09)
Chemistry 6.922 0.040 9.114
(0.11) (0.01) (0.09)
Social Science -8.256 -17.343 -11.942
(0.13) (0.01) (0.09)
Statistics -8.598 1.638 3.576
(0.00) (0.12) (0.05)
Technical 0.851 3.599 4.708
(0.28) (0.50) (0.12)
Art 0.346 10.061 10.573
(0.18) (0.13) (0.08)
Academic Art 0.579 -3.624 -10.490
(0.22) (0.23) (0.08)
Mathematics -6.692 -6.459 -15.561
(0.11) (0.58) (0.11)
Physics 1.438 4.006 5.913
(0.53) (0.47) (0.04)
other subjects (number)
-13.549 22.224 12.119
number of observations
1488 1488 1488
R squared 0.234 0.430 0.445
Table 4 Examples of the neural network results
Curriculum Predicted wage (£/hr)
English History Physics 6.59 English French History 6.59
Mathematics French History 6.59
Social Science French History 6.59
Mathematics Statistics Physics 6.60
English French Art 7.18
Mathematics Physics Biology 7.56
Social Science Physics Biology 7.69
French History Chemistry 7.66
English Physics Biology 7.68
History French Art 7.68
Physics Chemistry Biology 7.69
[image:30.595.81.390.363.548.2]French History Biology 7.69
References
Adelman, Clifford (1999) Answers in the tool box: academic intensity, attendance patterns and bachelors degree attainment, Jessup MD: US Department of Education.
Akerlof, George A. (1998) Men without children, Economic Journal, 108, 287-309.
Alexander, Karl L., and Pallas, Aaron M. (1984) Curriculum reform and school performance: an evaluation of the 'new basics', American Journal of Education. 92, 391-420.
Altonji, Joseph (1995) The effects of high school curriculum on education and labor market outcomes, Journal of Human Resources, 30, 409-438.
Arrow, Kenneth (1973) Higher education as a filter, Journal of Public Economics, 2, 193-216.
Becker, Gary S. (1964) Human Capital, New York: Columbia University Press.
Blanchflower, David G., Oswald, Andrew J. and Garrett, Mario D. (1990) Insider power in wage determination, Economica, 57, 143-170.
Blundell, Richard, Dearden, Lorraine, Goodman, Alissa and Reed, Howard (1997) Higher education, employment and earnings in Britain, London: Institute of Fiscal Studies.
Blundell, Richard, Dearden, Lorraine, Goodman, Alissa and Reed, Howard (2000) The returns to higher education in Britain: evidence from a British cohort, Economic Journal, 110, F82-F99.
Coelli, Tim J. (1996) Measurement and sources of technical efficiency in Australian coal-fired electricity generation, mimeo, University of New England.
Cohn, Elchanan, Kiker, Billy F. and de Oliveira, M. Mendes (1987) Further evidence on the screening hypothesis, Economics Letters, 25, 289-294.
Curry, Bruce and Morgan, Peter H. (1997) Neural Networks: a Need for Caution, Omega, 25, 123-133.
Dolton, P. and Vignoles, A. (2002a) The returns on post-compulsory school mathematics study, Economica, 69, 113-141.
Dolton, P. and Vignoles, A. (2002b) Is a Broader Curriculum Better?, Economics of Education Review, forthcoming.
Green, Francis, Machin, Stephen and Manning, Alan (1996) The employer size wage effect: can dynamic monopsony provide an explanation?, Oxford Economic Papers, 48, 433-455.
Grubb, W. Norton (1993) Further tests of screening on education and observed ability,
Hanushek, Eric A. (1986) The economics of schooling: production and efficiency in the public schools, Journal of Economic Literature, 24, 1141-1177.
Harmon, Colm and Walker, Ian (1995) Estimates of the economic return to schooling for the United Kingdom, American Economic Review, 85, 1278-1286.
Harmon, Colm and Walker, Ian (2000) The returns to the quantity and quality of education: evidence for men in England and Wales, Economica, 67, 19-35.
Heckman, James J. (1979) Sample selection bias as a specification error, Econometrica, 47, 153-161.
Hildreth, Andrew K.G. and Oswald, Andrew J. (1997) Rent-sharing and wages: evidence from company and establishment panels, Journal of Labor Economics, 15, 318-337.
Johnes, Geraint (1998) Human capital versus sorting: new data and a new test, Applied Economics Letters, 5, 665-667.
Johnes, Geraint (2000) Up around the bend: linear and nonlinear models of the UK economy compared, International Review of Applied Economics, 14, 485-493.
Levine, Phillip B. and Zimmerman, David J. (1995) The benefit of additional high school math and science classes for young men and women, Journal of Business and Economic Statistics, 13, 137-149.
Mincer, Jacob (1974) Schooling, experience and earnings, New York: National Bureau for Economic Research.
Murphy, Kevin M. and Welch, Finis (1990) Empirical age-earnings profiles, Journal of Labor Economics, 8, 202-229.
Riley, J (2001) Silver signals: 25 years of screening and signalling, Journal of Economic Literature, 39, 432-478.
Rumelhart, David E., Hinton, Geoffrey E. and Williams, Ronald J. (1986) Learning representations by backpropagating errors, Nature, 323, 533-536.
Schultz, Theodore (1961) Investment in human capital, American Economic Review, 51, 1-17.
Spence, Michael (1973) Job market signalling, Quarterly Journal of Economics, 87, 355-374.
Swanson, Norman and White, Halbert (1997) Forecasting economic time series using flexible versus fixed specifications and linear versus nonlinear econometric models, International Journal of Forecasting, 13, 439-462.
Vignoles, Anna (1999) A levels: does less mean more?, LSE Centrepiece, 4(1), available at http://www.centrepiece-magazine.com/spring99/maths.htm.
White, Halbert (1989) Learning in artificial neural networks: a statistical perspective, Neural Computation, 1, 425-464; reprinted in White (1992).
White, Halbert (1992) Artificial neural networks: approximation and learning theory, Oxford: Blackwell.
White, Halbert, Hornick, Kurt, and Stinchcombe, Maxwell B. (1989) Multilayer feedforward networks are universal approximators, Neural Networks, 2, 359-366; reproduced in White, Halbert (1992) Artificial Neural Networks: Approximation and Learning Theory, Oxford: Blackwell.