Noninvasive Blood Glucose Monitoring System Based on
Distributed Multi-Sensors Information Fusion of
Multi-Wavelength NIR
*
Bo Zeng, Wei Wang#, Na Wang, Funing Li, Fulong Zhai, Lintao Hu
School of Information Science and Engineering, Lanzhou University, Lanzhou, China Email: zengbo11@gmail.com, #wangw@lzu.edu.cn
Received 2013
ABSTRACT
In this research, a near infrared multi-wavelength noninvasive blood glucose monitoring system with distributed laser multi-sensors is applied to monitor human blood glucose concentration. In order to improve the monitoring accuracy, a multi-sensors information fusion model based on Back Propagation Artificial Neural Network is proposed. The Root- Mean-Square Error of Prediction for noninvasive blood glucose measurement is 0.088mmol/L, and the correlation coef- ficient is 0.94. The noninvasive blood glucose monitoring system based on distributed multi-sensors information fusion of multi-wavelength NIR is proved to be of great efficient. And the new proposed idea of measurement based on distri- buted multi-sensors, shows better prediction accuracy.
Keywords: Noninvasive Glucose Monitoring; NIR Arrays Signals Fusion; BP-Artificial Neural Network
1. Introduction
Diabetes has become a modern disease and more than 150 million people are suffering from it all around the world [1]. In order to prevent complication, the tight blood glucose level control is very essential. Currently, patients are recommended to monitor their blood glucose level via an invasive finger-tip stick method, this way will inevitably bring patients pain and infection [2]. In order to avoid the weakness of invasive method, a num- ber of noninvasive measurements occurred, like middle- infrared emission spectroscopy [3,4], Near Infrared (NIR) spectroscopy [5,6]. The main drawback of infrared mea- surement is its accuracy and stability. In our past work, an infrared noninvasive blood glucose measurement sys- tem based on multi-sensors and Mixture of Experts (ME) [7] was designed. ME algorithm greatly improved the precision of noninvasive blood glucose measurement. In the noninvasive blood glucose monitoring system based on distributed multi-sensors information fusion of mul- ti-wavelength NIR, this system was designed on the pur- pose of continuous blood glucose monitoring for patients at home and hospital [2]. Another advantage of this sys- tem was the introduction of distributed multi-sensors idea, this change has been proved to be better improvement for blood glucose prediction accuracy. In this distributed
multi-sensors system, a multi-sensors information fusion model, Back Propagation Artificial Neural Network (BP- ANN), was applied.
2. Noninvasive Blood Glucose Monitoring
Model
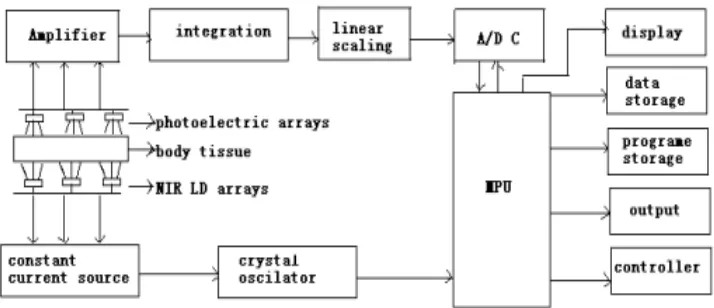
The experimental data for this research was obtained via NIR based on laser arrays as shown in Figure 1. The NIR light source consists of 3*3 laser diodes arrays op- erating at output powers of 5 mW [8].
2.1. Hardware Design
Wavelengths selection: According to the specialty of glucose molecular structure and absorption specialty, second order times frequency absorption exists between 1100 - 1300 nm, and first order times frequency absorp- tion exists between 1500 - 1800 nm. Other components in blood, such as hemoglobin and water contain groups of hydrogen which can trigger NIR absorption as well. Water absorption peaks are mainly distributed between 1440 - 1460 nm and between 1940 - 1960 nm, those regions should be avoided in wavelength selection. Be- tween 1400 - 1800 nm, water absorption only exists at 1787 nm, fat and protein exist no absorption peak in this region. Therefore, 1400 - 1800 nm region is suitable for measurement wavelength selection.
Measurement sites selection: In noninvasive blood
*The work is supported by National Nature Science Fund of China (No
30970876, 81141076).
Figure 1. Framework of the multiwavelength arrays monitoring system.
glucose measurement, the selection of an ideal measure- ment site is essential. Four factors should be considered: First, for the convenience of measurement, the measure- ment site should be exposed outside; Second, in order to decrease the influence from outside factors, individual difference like gender, age and physical state should be low; Third, the measurement site should contain rich blood and the interference from other components is low; Last, NIR light can transmit measurement site easily. In the noninvasive blood glucose monitoring system based on distributed multi-sensors, left ear lobe, right ear lobe and the right hand part between thumb and index finger are selected as distributed measurement sites.
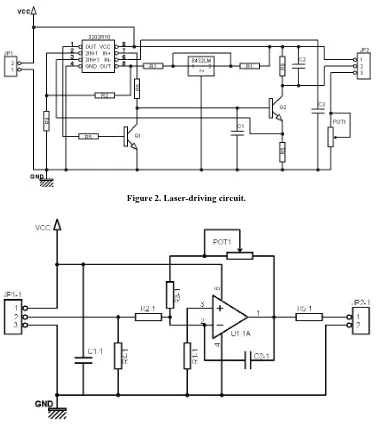
Circuit design: six channels of laser-driving and photo- electronic amplification circuit are designed in this system. Figure 2 shows the laser-driving circuit, LD- driving and the part of photodiode feedback circuit help to maintain laser operate with output power of 5 mW and forward current of 30 mA. By adjusting POT1, forward current can be adjusted between 0 - 120 mA. Figure 3
shows the photoelectrical signal amplification circuit. By applying an operational amplifier POT1 and some af- filiated resisters and capacities, the obtained spectral signal can be amplified by 1000 to 3V, the amplified signal is transferred to plug seat JP2-1 which connected to AD converter.
2.2. Software Design
1) Data acquisition and save: Amplified spectral sig- nal is first conveyed to AD converter, which supports Labview drive. So the converted data can be displayed on the screen programmed by Labview language. Figure 4 shows the interface of acquired spectral data from six channels. At each channel, the average value of 10 successive acquired data is calculated as displaying infor- mation.
2) Distributed multi-sensors information fusion based on BP-ANN: BP-ANN is one kind of supervised learning
network. There are two phases of positive transmitting processing and error reverse transmitting processing in the study processing of BP-ANN.
A three layers BP neural network (Figure 5) is applied to model fuse multi-sensors information and predict the blood glucose concentration in experiments. Least Square function is adopted as error function in the training of BP network, which writes as:
(
)
21 1 2 q m
rk rk r k
k
y o
E = =
−
=
∑∑
(2)k
O is the output of note k; yk is the corresponding de- sired output; q is the number of output notes, and m is the number of training samples. For the output weight, the revise value ∆wjk is:
jk k k
w
ηδ
o∆ =
(3)
jk
w is the weight connecting the number k output note and the number j hidden note: η is the study speed,
k
o is output value at the number k output note; δk is the gradient factor. For the hidden layer, revise value writes as:
ij j j
w
δ
o∆ =
(4)
ij
w is the weight connecting the number j hidden note and the number i input note; oj is the output at the number j hidden note.
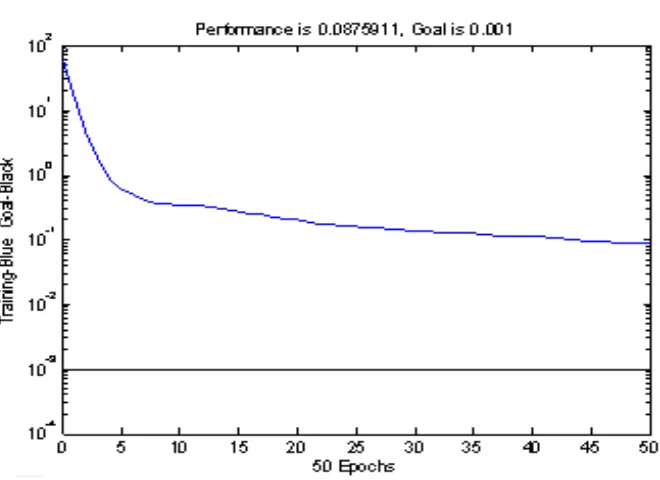
Figure 6 shows the training curve in the concentration prediction of blood glucose, after training of 10 times, the goal is reached and the performance can reach 0.088 mmol/L.
Figure 2. Laser-driving circuit.
Figure 3. Photoelectrical signal amplification circuit.
Figure 5. BP framework for multisensor information fusion.
Figure 6. Training curve in human blood glucose concentration prediction.
3. Experiments
In both glucose samples experiment and noninvasive blood glucose measurement experiment, 7 measurement methods with single, two and three wavelengths were applied, which were named A, B, C, A + B, A + C, B + C and A + B + C method respectively.
3.1. Glucose Samples Experiment
Process of glucose experiment: All samples were mea- sured in a 5 mm quartz cell and the temperature in the sample cell was controlled at about 37˚C. Two sets of 20
samples were prepared with varying concentrations, ranging from 10 to 200 mg/dL in 10 mg/dL steps. More than 500 original data sets were obtained, after eliminat- ing some outlier samples, 200 samples with different concentrations were left for building calibration model. In the experiment, the spectrum of empty cell was mea- sured firstly as a background [9].
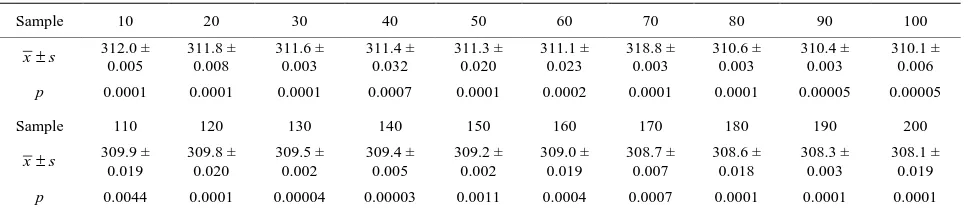
Data preparation of calibration model: It is essential to figure out the significant difference between each group of spectral data sample. Statistic method of T-test was used to prove the validity of samples and to check out the outliers data. In Table 1, a total of 200 glucose
1
x
2
x
3
x
4
x
5
x
6
x
Six spectra input
Hidden layer
Output (y) Spectra absorption of
wavelength A
Spectra absorption of wavelength B
[image:4.595.134.464.323.563.2]Table 1. Comparison of 20 glucose absorption spectra data.
Sample 10 20 30 40 50 60 70 80 90 100
x±s 312.0 ± 0.005 311.8 ± 0.008 311.6 ± 0.003 311.4 ± 0.032 311.3 ± 0.020 311.1 ± 0.023 318.8 ± 0.003 310.6 ± 0.003 310.4 ± 0.003 310.1 ± 0.006
p 0.0001 0.0001 0.0001 0.0007 0.0001 0.0002 0.0001 0.0001 0.00005 0.00005
Sample 110 120 130 140 150 160 170 180 190 200
x±s 309.9 ± 0.019 309.8 ± 0.020 309.5 ± 0.002 309.4 ± 0.005 309.2 ± 0.002 309.0 ± 0.019 308.7 ± 0.007 308.6 ± 0.018 308.3 ± 0.003 308.1 ± 0.019
p 0.0044 0.0001 0.00004 0.00003 0.0011 0.0004 0.0007 0.0001 0.0001 0.0001
absorption spectra were given out, the average and standard deviation of 10 measurement values for each glucose sample are calculated as well. Comparing with the differences between 20 groups of glucose NIR ab- sorption spectra, their differences achieve significant level (T-test, p < 0.05).
3.2. Human Noninvasive Measurement Experiment
Process of Human noninvasive measurement experiment: In order to get training data covering wide variety scope of human blood glucose concentration, the blood glucose tests were made on volunteers at certain time before or after their meal with the interval time of half an hour. After measurement of blood glucose, multi-sensors were attached to measurement sites to get responding spectra information [10]. A total of 142 samples for each type of measurements were got in this experiment and the blood glucose concentration ranges from 3.2 mmol/L to 10.8 mmol/L.
Data preparation for BP-ANN training and testing: Similarly to the data preparation of calibration model, experimental data in noninvasive blood glucose measure- ment were given in Table 2. T-test is applied to test the spectra difference of different groups of blood glucose concentration, p of T-test is smaller than 0.05, which demonstrates that their differences reach significant levels.
4. Results
4.1. Building Calibration Model
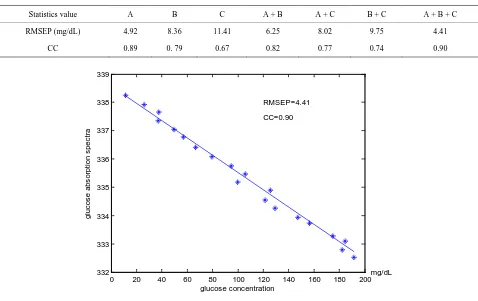
In both the glucose samples experiment and noninvasive blood glucose measurement experiment, 7 kinds of cali- bration model were built to realize the function of conti- nuous monitoring. In A + B + C method of glucose expe- riment, 20 spectra data samples were used to build the calibration model. Figure 7 shows the relation between glucose concentration and glucose absorption spectra, from the figure we can see this validation owns a fine prediction ability for unknown received spectra informa- tion. In Table 3, the performances of different measure-
ment methods were compared, in the A + B + C method, the RMSEP is 4.412 mg/dL and CC is 0.90, which shows a great improvement in prediction performance to other single or two wavelength methods. Compare with statis- tic values of three single wavelength and combination of two wavelength methods, single wavelength A shows best sensitivity
4.2. Results of Human Blood Glucose Noninvasive Measurement
4.2.1. BP-ANN Measurement Model
In the human noninvasive blood glucose measurement experiment, a total of 142 samples were obtained, 122 couples of blood glucose absorption spectra data and corresponding blood glucose reference values were used for the BP network training. As shown in Figure 6, the network can reach goal after 10 training, RMSEP of this model is 0.088 mmol/L and CC is 0.9315 in the method of A + B + C. Comparing with the other six methods, the BP-ANN greatly decreased the prediction error, which can be seen in Table 4.
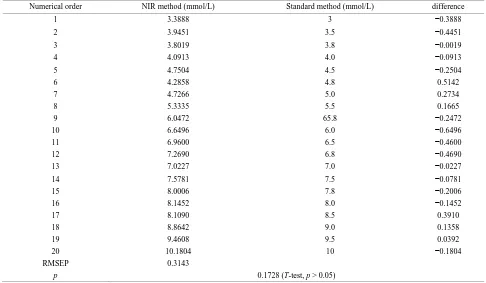
4.2.2. Testing of Measurement Model
The left 20 samples were used as validation data sets to test performance of the measurement model. 20 spectra information data were inputted to the BP-ANN multi- sensors information fusion model, 20 output values of predicted blood glucose concentration were received at the output layer, the result was given in Table 5. The RMSEP between NIR method and standard method is 0.3143 mg/dL. T-test is applied and p is 0.1728, bigger than 0.05, which demonstrate that the relation between those two values is well related.
5. Conclusion
Table 2. Difference comparison of 28 groups of blood glucose absorption spectra data.
Sample 10.8 10.5 10.1 10.0 9.8 9.6
x±s 567.95 ± 0.03 568.42 ± 0.15 568.93 ± 0.49 569.01 ± 0.33 568.98 ± 0.47 569.91 ± 0. 22
p 0.0125 0.0332 0.0318 0.0412 0.0215 0.0358
Sample 9.4 9.1 8.9 8.6 8.3 8.2
x±s 570.24 ± 0.10 570.67 ± 0.32 571.29 ± 0.41 571.44 ± 0.6071 572.06 ± 0.22 572.87 ± 0.49
p 0.0215 0.3025 0.0217 0.0160 0.0321 0.0245
Sample 7.8 7.6 7.4 6.9 6.7 6.5
x±s 573.52 ± 0.25 573.63 ± 0.21 574.03 ± 0.72 575.18 ± 0.43 575.36 ± 0.37 575.57 ± 0.39
p 0.0418 0.044 0.0360 0.0214 0.0124 0.0173
Sample 6.3 5.9 5.7 5.3 4.9 4.7
x±s 576.745 ± 0.36 577.15 ± 0.63 577.89 ± 0.26 578.13 ± 0.31 579.16 ± 0.11 579.58 ± 0.34
p 0.0368 0.0123 0.0451 0.0358 0.0201 0.0426
sample 4.4 4.2 3.9 3.7 3.5 3.1
x±s 579.80 ± 0.25 580.71 ± 0.23 581.07 ± 0.32 581.13 ± 0.21 581.21 ± 0.03 572.15 ± 0.16
[image:6.595.55.542.101.400.2]p 0.0103 0.29 0.0412 0.0328 0.01 0.0257
Table 3. Performance comparison with different measurement methods in calibration model.
Statistics value A B C A + B A + C B + C A + B + C
RMSEP (mg/dL) 4.92 8.36 11.41 6.25 8.02 9.75 4.41
CC 0.89 0. 79 0.67 0.82 0.77 0.74 0.90
Figure 7. Relation between glucose concentration and spectra absorption. 0 20 40 60 80 100 120 140 160 180 200 332
333 334 335 336 337 338 339
glucose concentration
gl
uc
os
e abs
or
pt
ion s
pec
tr
a
RMSEP=4.41
CC=0.90
[image:6.595.60.538.424.725.2]Figure 8. Relation of blood glucose concentration between measurement method and NIR arrays information fusion method.
Table 4. Performance comparison of different measurement methods in measurement model.
Statistics value A B C A + B
RMSEP(mmol/L) 0.175 0.362 0.423 0.2651
CC 0.8522 0.7325 0.6355 0.79342
Statistics value A + C B + C A + B + C A + B + C based on BP RMSEP(mmol/L) 0.31288 0.39528 0.115 0.088
CC 0.76392 0.6821 0.8938 0.94713
Table 5. Analysis result of blood glucose concentration between comparison method and NIR method.
Numerical order NIR method (mmol/L) Standard method (mmol/L) difference
1 3.3888 3 −0.3888
2 3.9451 3.5 −0.4451
3 3.8019 3.8 −0.0019
4 4.0913 4.0 −0.0913
5 4.7504 4.5 −0.2504
6 4.2858 4.8 0.5142
7 4.7266 5.0 0.2734
8 5.3335 5.5 0.1665
9 6.0472 65.8 −0.2472
10 6.6496 6.0 −0.6496
11 6.9600 6.5 −0.4600
12 7.2690 6.8 −0.4690
13 7.0227 7.0 −0.0227
14 7.5781 7.5 −0.0781
15 8.0006 7.8 −0.2006
16 8.1452 8.0 −0.1452
17 8.1090 8.5 0.3910
18 8.8642 9.0 0.1358
19 9.4608 9.5 0.0392
20 10.1804 10 −0.1804
RMSEP 0.3143
p 0.1728 (T-test, p > 0.05)
3 4 5 6 7 8 9 10
2 3 4 5 6 7 8 9 10 11
Actual value(mmol/L)
C
al
abt
at
ion v
al
ue(
m
m
ol
/L)
RMSEP=0.088 CC=0.9315
[image:7.595.54.540.454.737.2]property. In the later work, we hope that new multi-wa- velength strategy can be used to further improve the pre- diction accuracy.
REFERENCES
[1] A. A. Mbaideen and M. Benaissa, “Determination of Glu- cose Concentration from NIR Spectra Using Independent Component Regression,” Chemometrics and Intelligent
Laboratory Systems, Vol. 105, No. 1, 2010, pp. 131-135.
[2] M. Rohrscheib, R. Robinson and R. P. Eaton, “Non-In- vasive Glucose Sensors and Improved Informatics—The Future of Diabetes Management,” Diabetes, Obesity and
Metabolism, Vol. 5, No. 5, 2003, pp. 280-284.
[3] H. V. L. Toal, M. Weidenmuller, A. Xhelaj and W. Man- tele, “A Novel Approach to Non-Invasive Glucose Mea- surement by Mid-Infrared Spectroscopy: The Combina- tion of Quantum Cascade Lasers (QCL) and Photoacous- tic Detection,” Vibrational Spectroscopy, Vol. 38, No. 1- 2, 2005, pp. 209-215.
[4] M. Mueller, M. Grunze, E. H. Leiter, P. C. Reifsnyder, U. Klueh and D. Kreutzer, “Non-Invasive Glucose Mea- surements in Mice Using Mid-Infrared Emission Spec- troscopy,” Sensors and Actuators B: Chemical, Vol. 142, No. 2, 2009, pp. 502-508.
[5] K. Maruo, M. Tsurugi, J. Chin, T. Ota, H. Arimoto and Y. Yamada, “Noninvasive Blood Glucose Assay Using a Newly Developed Near-Infrared System,” IEEE Journal
of Selected Topics in Quantum Electronics, Vol. 9, No. 2,
2003, pp. 322-399.
[6] K. X. Xu, Q. J. Qiu, J. Y. Jiang and X. Y. Yang, “Non- Invasive Glucose Sensing with Near-Infrared Spectros- copy Enhanced by Optical Measurement Conditions Re- production Technique,” Optics and Lasers in Engineer- ing, Vol. 43, No. 10, 2004, pp. 1096-1106.
[7] W. Wang, L. F. Yan, B. W. Liu and H. Zhang, “Multi- sensors Information Fusion With Neural Networks for Noninvasive Blood Glucose Detection,” Lecture Notes in
Computer Science, Vol. 3498, 2005, pp. 760-766.
[8] Y. L. Yeh, “Real-Time Measurement of Glucose Concen- tration and Average Refractive Index Using a Laser In- terferometer,” Optics and Lasers in Engineering, Vol. 46, No. 9, 2008, pp. 666-670.
[9] Q. B. Li, L. N. Li and G. J. Zhang, “A Nonlinear Model for Calibration of Blood Glucose Noninvasive Measure- ment Using Near Infrared Spectroscopy,” Infrared Phys-
ics & Technology, Vol. 53, No. 5, 2010, pp. 410-417.
[10] A. Caduff, M. S. Talary, M. Mueller, F. Dewarrat, J. Kli- sic, M. Donath, L. Heinemann and W. A. Stahel, “Non- Invasive Glucose Monitoring in Patients with Type 1 Di- abetes: A Multisensor System Combining Sensors for Di- electric and Optical Characterisation of Skin,” Biosen-
sors and Bioelectronics, Vol. 24, No. 9, 2009, pp. 2778-